

Market Data

November 24, 2015
The Chicago Federal Reserve National Activity Index and Steel Supply
Written by Peter Wright
The following is the Chicago Federal Reserve statement followed by our own graphical analysis. The CFNAI is an excellent reality check for much of the economic analysis that we routinely provide in The Steel Market Update and is also a reasonably good predictor of the direction of steel demand with a six to nine month lead. For example by the time the steel market went off the cliff in September 2008, the CFNAI had been signaling an increasingly severe problem for eight months. Then in the first quarter of 2009 the CFNAI was recovering as steel supply was still going south. An explanation of the Index is provided at the end of this piece.
![]() The official statement reads as follows:
The official statement reads as follows:
Index shows economic growth improved in October
Led by improvements in employment- and production-related indicators, the Chicago Fed National Activity Index (CFNAI) rose to -0.04 in October from -0.29 in September. Two of the four broad categories of indicators that make up the index increased from September, but only one category made a positive contribution to the index in October. The index’s three-month moving average, CFNAI-MA3, decreased to -0.20 in October from -0.03 in September. October’s CFNAI-MA3 suggests that growth in national economic activity was somewhat below its historical trend. The economic growth reflected in this level of the CFNAI-MA3 suggests subdued inflationary pressure from economic activity over the coming year.
The contribution from production-related indicators to the CFNAI increased to -0.05 in October from -0.17 in September. Manufacturing production moved up 0.4 percent in October, following a decline of 0.1 percent in September. However, industrial production declined by 0.2 percent in October for the second straight month. The sales, orders, and inventories category made a contribution of -0.01 to the CFNAI in October, down slightly from +0.01 in September.
Employment-related indicators contributed +0.11 to the CFNAI in October, up from -0.06 in September. Nonfarm payrolls increased 271,000 in October after rising 137,000 in September, and the unemployment rate ticked down to 5.0 percent in October from 5.1 percent in the previous month.
The contribution of the personal consumption and housing category to the CFNAI ticked down to -0.09 in October from -0.07 in September. Housing starts declined to 1,060,000 annualized units in October from 1,191,000 in September. However, housing permits moved up to 1,150,000 annualized units in October from 1,105,000 in the previous month.
The CFNAI was constructed using data available as of November 19, 2015. At that time, October data for 51 of the 85 indicators had been published. For all missing data, estimates were used in constructing the index. The September monthly index value was revised to -0.29 from an initial estimate of -0.37, and the August monthly index value was revised to -0.29 from last month’s estimate of -0.39. Revisions to the monthly index value can be attributed to two main factors: revisions in previously published data and differences between the estimates of previously unavailable data and subsequently published data. The revisions to both the September and August monthly index values were due primarily to the former.
Figure 1 shows the SMU analysis of the 3MMA of the CFNAI through October.
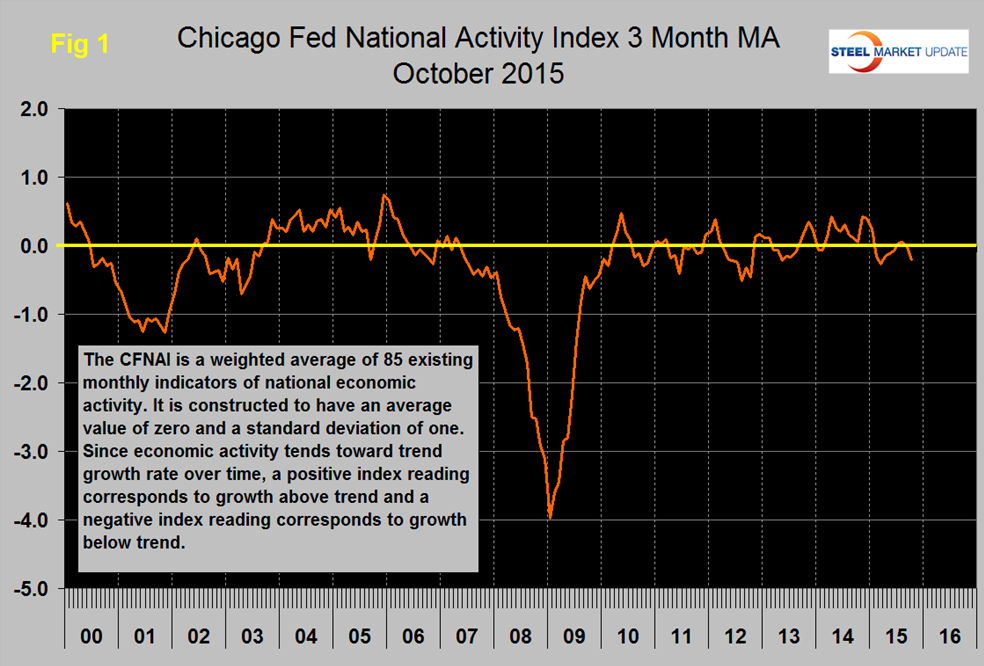
The index rose for four straight months through July to reach the neutral threshold, then was almost unchanged in August and fell back in September and October when it closed at negative 0.2 (see explanation below). Figure 2 shows the trends of the four main subcomponents.
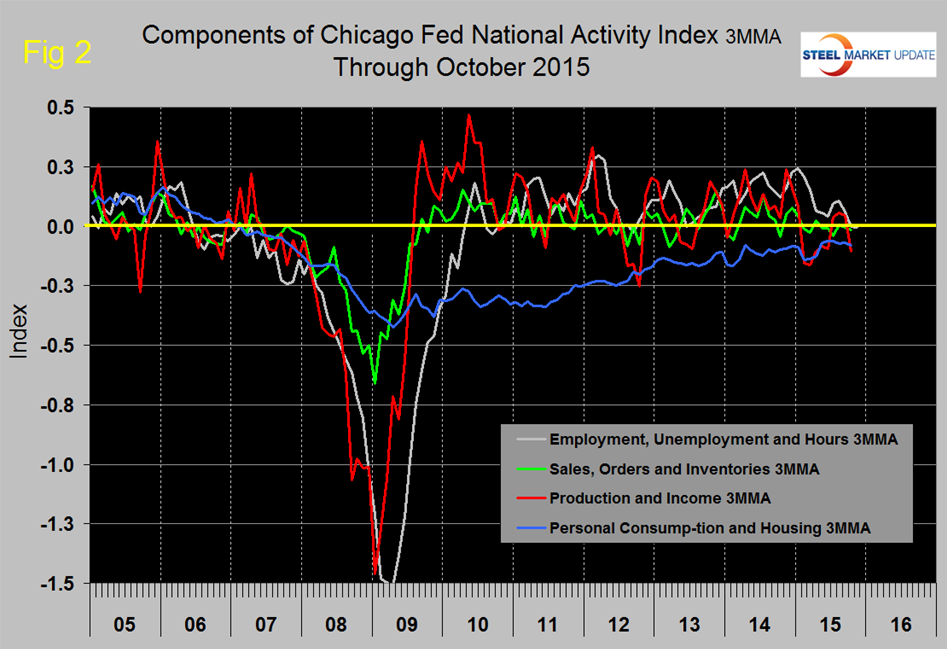
There has been a gradual five year improvement in personal consumption and housing that is ongoing though still below the neutral level. The other three sub-components continue to be erratic with a strong downward trend in employment and hours worked which doesn’t seem to jive with the Bureau of Labor Statistics data. There has been a marked drop in production and income in the last two months. If our observations here seem to be at odds with the official statement it is because we make no comment at all on the single month’s data and discuss only three month moving averages.
Figure 3 compares the 3MMA of steel supply with the CFNAI and shows that the CFNAI has historically been a reasonably accurate leading indicator of steel demand (apparent supply) with a lead time of six to nine months.
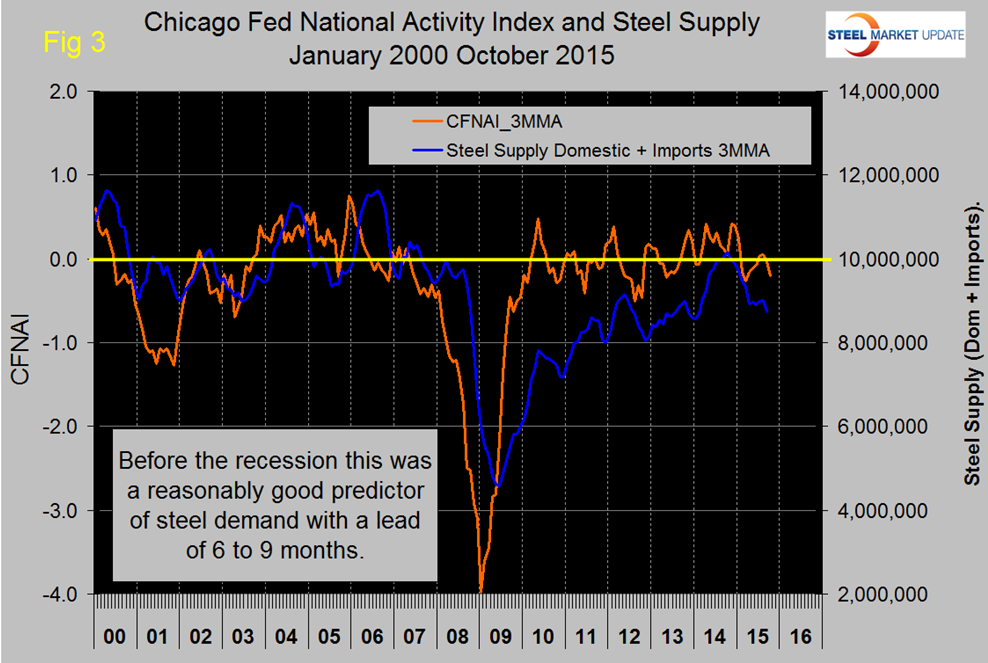
SMU monitors several benchmark indicators to evaluate whether steel consumption is where it should be based on historical patterns, this is one of them. Total steel supply closed the gap in the period mid 2009 through Q4 2014 but in the last eight months has fallen off again probably as a result of the depressed energy sector. Figure 4 and Figure 5 show this same relationship for flat rolled and long products separately, based on a rolling three months tonnage for each.
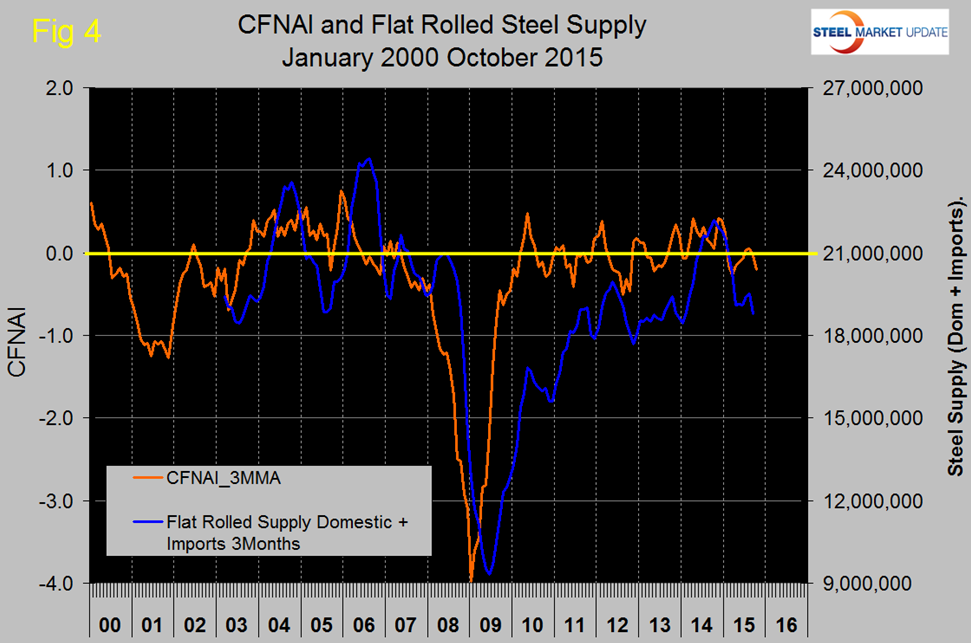
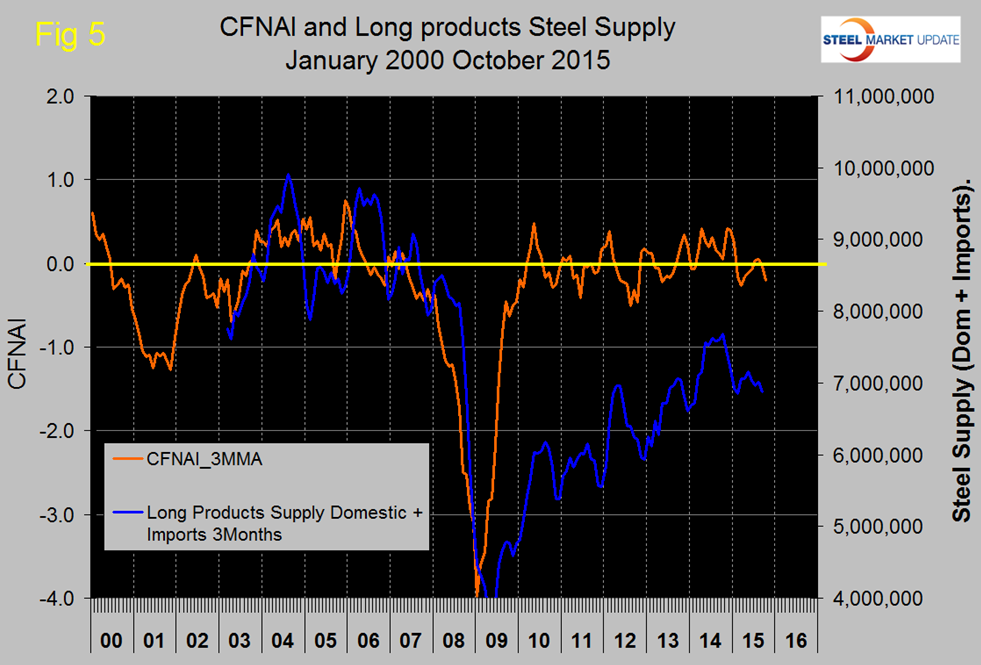
The difference is quite dramatic and qualitatively in agreement with our analysis of steel service center shipments. Flat rolled, driven mainly by manufacturing, came back in line at the end of 2014 but this year has fallen off again as the OCTG market has collapsed. Long products driven mainly by construction is still depressed and since the recession has not come anywhere near where this benchmark predicts. Based on the historical lead of the CFNAI it no longer looks as though total steel demand will pick up through Q1 2016. Note; steel supply shown is only through September as that is the latest data available.
Explanation: The index is a weighted average of 85 indicators of national economic activity drawn from four broad categories of data: 1) production and income; 2) employment, unemployment, and hours; 3) personal consumption and housing; and 4) sales, orders, and inventories. A zero value for the index indicates that the national economy is expanding at its historical trend rate of growth; negative values indicate below-average growth; and positive values indicate above-average growth. When the CFNAI-MA3 (three month moving average) value moves below -0.70 following a period of economic expansion, there is an increasing likelihood that a recession has begun. Conversely, when the CFNAI-MA3 value moves above -0.70 following a period of economic contraction, there is an increasing likelihood that a recession has ended. When the CFNAI-MA3 value moves above /+0.70 more than two years into an economic expansion, there is an increasing likelihood that a period of sustained increasing inflation has begun.


