

Market Data
November 30, 2015
November 2015 Consumer Confidence
Written by Peter Wright
Consumer confidence declined markedly in November continuing this year’s highly erratic trend and, in fact, the view of the present situation and expectations exhibited the sharpest reversal since November 2011 when they went the other way.
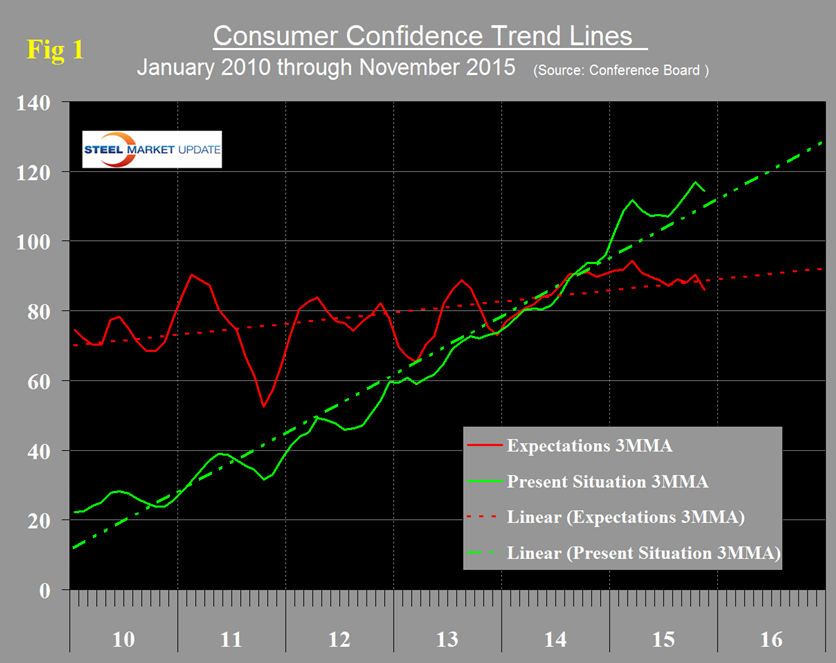
As we have reported in earlier write-ups on this subject, 2015 has been tremendously more variable month to month this year than last. In all of 2014 the monthly change ranged from +5.1 to -4.4, this year the range has been +10.7 to -8.8 points. In November the composite declined by 8.7 points to 90.4 but the three month moving average (3MMA) decreased by only 3.6 to 97.4 points. In the first 11 months of 2015 there have been 2 months, March and October when the 3MMA of the composite was 101 points. In the other 9 months the total spread was from 95.1 to 98.6 points. The 3MMA of the present situation continues to be above its five year trend and that of expectations has now fallen below its 5 year trend (Figure 1).
The historical pattern of the 3MMA of the composite, the view of the present situation and expectations are shown in Figure 2.
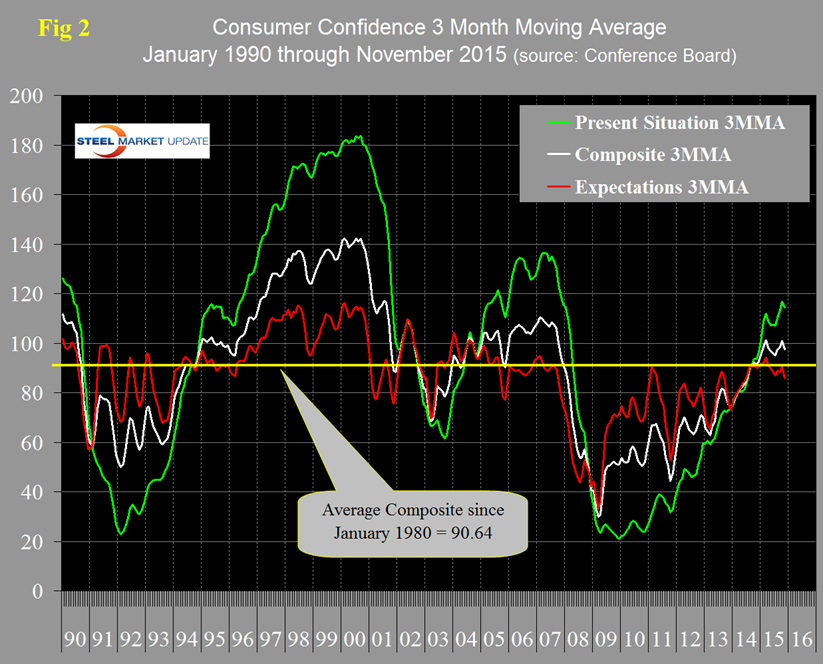
The consistency of the recovery of the composite is looking better than the turn around after the recession in 2003. The present situation component has been much more volatile over each multiyear time span than expectations since our data began 35 years ago with higher highs and lower lows. The view of the present situation moved ahead of that for expectations in November last year for the first time since the recovery began in 2009. If history repeats itself, the view of the present situation will continue to move ahead and widen the differential between it and expectations. On a year over year basis using a 3MMA, the composite at 97.4 is up by 6.0 led by consumer’s view of the present situation which is up by 20.6. Expectations at 86.0 are down 3.8 points year over year (Table 1).
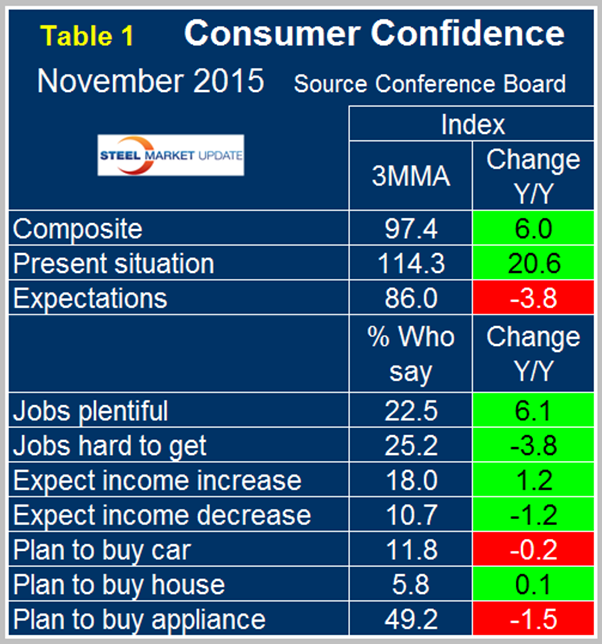
All four of the employment sub-indexes which describe job availability and wage expectations have strengthened for four consecutive month’s year over year as indicated by the color code green. The year over year trends for auto, home and appliance purchase were all negative in March. Intentions to buy an appliance became positive in April, intentions to buy a car became positive in May and in June and July all three were positive year over year. For the first time since April, the y/y intentions to buy a car became negative in August and remained negative through November. Automotive sales are still extremely strong therefore the negative reading in the consumer confidence report is probably a reflection of pent up demand being relieved. Intentions to buy an appliance became negative y/y in November for the first time since March. Overall in the first eleven months of 2015, the Conference Board index has maintained the strongest value since Q3 2007.
The official news release from the Conference Board reads as follows and is entirely based on monthly changes. We don’t believe their conclusions are valid because of the extreme variability of the data but include it here as an example of what not to believe in economic press releases.
The Conference Board Consumer Confidence Index Declines Again
The Conference Board Consumer Confidence Index, which had decreased moderately in October, declined further in November. The Index now stands at 90.4 (1985=100), down from 99.1 in October. The Present Situation Index decreased from 114.6 last month to 108.1 in November, while the Expectations Index declined to 78.6 from 88.7 in October. The cutoff date for the preliminary results was November 12.
“Consumer confidence retreated in November, following a moderate decrease in October,” said Lynn Franco, Director of Economic Indicators at The Conference Board. “The decline was mainly due to a less favorable view of the job market. Consumers’ appraisal of current business conditions, on the other hand, was mixed. Fewer consumers said conditions had improved, while the proportion saying conditions had deteriorated also declined. Heading into 2016, consumers are cautious about the labor market and expect little change in business conditions.”
Consumers’ assessment of current conditions was less positive in November. Those saying business conditions are “good” decreased from 26.8 percent to 24.4 percent. However, those claiming business conditions are “bad” also decreased from 18.3 percent to 16.9 percent. Consumers were less upbeat about the current state of the job market. Those stating jobs are “plentiful” decreased from 22.7 percent to 19.9 percent, while those claiming jobs are “hard to get” increased to 26.2 percent from 24.6 percent.
Consumers’ optimism about the short-term outlook declined sharply in November. The percentage of consumers expecting business conditions to improve over the next six months decreased from 18.1 percent to 14.8 percent, while those expecting business conditions to worsen increased slightly to 11.0 percent from 10.4 percent.
Consumers’ outlook for the labor market was also more pessimistic. Those anticipating more jobs in the months ahead fell from 14.4 percent to 11.6 percent, while those anticipating fewer jobs increased from 16.6 percent to 18.7 percent. The proportion of consumers expecting their incomes to increase declined from 18.1 percent to 17.2 percent, while the proportion expecting a decline increased from 10.5 percent to 11.8 percent.
About The Conference Board
The Conference Board is a global, independent business membership and research association working in the public interest. Our mission is unique: To provide the world’s leading organizations with the practical knowledge they need to improve their performance and better serve society. The monthly Consumer Confidence Survey, based on a probability-design random sample, is conducted for The Conference Board by Nielsen, a leading global provider of information and analytics around what consumers buy and watch. The index is based on 1985 = 100. The composite value of consumer confidence combines the view of the present situation and of expectations for the next six months. The Conference Board is a non-advocacy, not-for-profit entity holding 501 (c) (3) tax-exempt status in the United States.
(Sources: The Conference Board and SMU Analysis)


