Market Data

December 16, 2015
Another Dip for ABI in November
Written by Sandy Williams
Demand for architecture design services fell again in November. The Architecture Billings Index score was 49.3, down from 53.1 in October and 53.7 in September. The Index has been up and down throughout 2015. The new projects inquiry index was 58.6, up just barely from 58.5 in October.
“Since architecture firms continue to report that they are bringing in new projects, this volatility in billings doesn’t seem to reflect any underlying weakness in the construction sector,” said AIA Chief Economist Kermit Baker, Hon. AIA, PhD. “Rather, it could reflect the uncertainty of moving ahead with projects given the continued tightness in construction financing and the growing labor shortage problem gripping the entire design and construction industries.”
Key November ABI highlights:
Regional averages: South (55.4), West (54.5), Midwest (47.8), Northeast (46.2)
Sector index breakdown: multi-family residential (53.8), institutional (52.0), commercial / industrial (51.0), mixed practice (47.6)
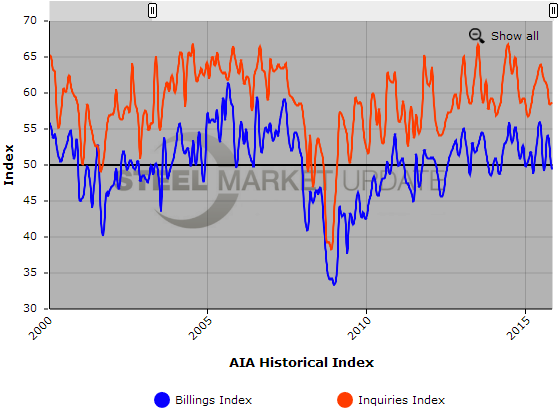
The Architecture Billings Index (ABI) is considered a leading economic indicator of construction activity, and reflects the approximate nine to twelve month lead time between architecture billings and construction spending. The regional and sector categories are calculated as a 3-month moving average, whereas the national index, design contracts and inquiries are monthly numbers.
Below is a graph showing the history of the Architecture Billings Index and Inquiries Index. You will need to view the graph on our website to use it’s interactive features, you can do so by clicking here. If you need assistance with either logging in or navigating the website, please contact our office at 800-432-3475 or info@SteelMarketUpdate.com.