

Prices

December 22, 2015
Global Steel Production and Capacity Utilization in November 2015
Written by Peter Wright
The following article is normally produced for our Premium level members, but we wanted to share it with our Executive level members as we think it is important and interesting as the world is flooded with excess steel capacity. If you find this article interesting you may be interested in upgrading your membership from Executive to Premium. We can answer any questions that you might have at info@SteelMarketUpdate.com.
![]() Global steel production in 12 months through November totaled 1.604 billion tonnes with a capacity of 2.3 billion tonnes. Production in the month of November was 126,844,000 tonnes, down from 132,729,000 in October or 4.4 percent, however there was one less day in November and on a tons/day basis production was down by 1.9 percent at 4.228 million tonnes, down from 4.518 in April which was the highest month of the year. If we look at the three month moving average and plot it over time we see that there has been a significant decline in the second half of the year since and including 2010 which usually extends into February of the next year, after which production kicks up rapidly (Figure 1).
Global steel production in 12 months through November totaled 1.604 billion tonnes with a capacity of 2.3 billion tonnes. Production in the month of November was 126,844,000 tonnes, down from 132,729,000 in October or 4.4 percent, however there was one less day in November and on a tons/day basis production was down by 1.9 percent at 4.228 million tonnes, down from 4.518 in April which was the highest month of the year. If we look at the three month moving average and plot it over time we see that there has been a significant decline in the second half of the year since and including 2010 which usually extends into February of the next year, after which production kicks up rapidly (Figure 1).
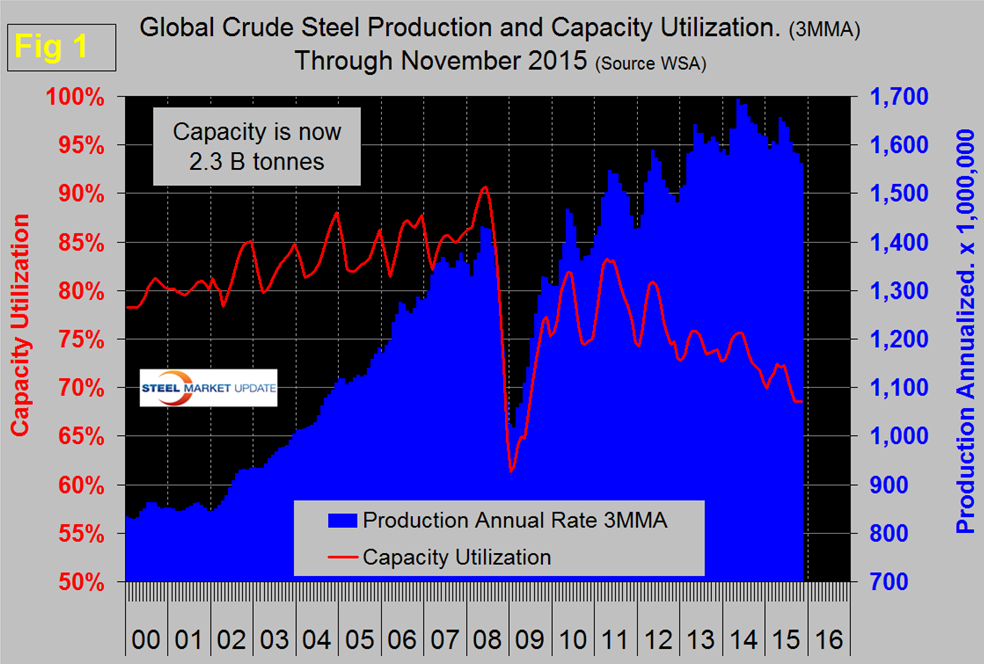
In 2015 the uptick was delayed until April and clearly the high point of 2014 has not been reached this year. On a 3MMA basis, production through November was the lowest since February 2013. As production has increased each year since the recession, capacity utilization has decreased, the gap is widening. Capacity utilization in three months through November was 68.6 percent, down from 72.2 percent in three months through April. China accounted for 49.9 percent of global production in November. Asia as a whole, including India, accounted for 68.8 percent. According to the Chinese General Administration of Customs on December 8th, China exported 9.61 million metric tons of steel in November, representing a rise of 6.5 percent month over month. The monthly total took China’s exports during the January through November period to 101.74 million mt, a 21.7 percent increase from the same period last year.
Last week the China Metallurgical Industry Planning & Research Institute (MPI) forecasted that China’s steel consumption will decline 4.8 percent in 2015 to 668 million metric tons, while next year consumption will continue falling but at the slower rate of 3 percent to 648 million mt.
Table 1 shows global production broken down into regions and also the production of the top ten nations in the single month of November and their share of the global total. It also shows the latest three months and twelve months production through November with year over year growth rates for each. Regions are shown in white font and individual nations in beige.
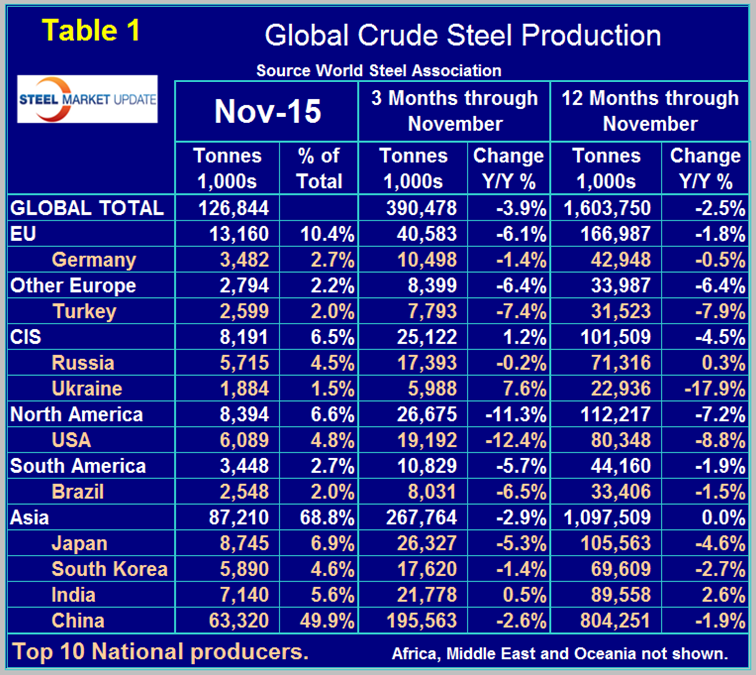
If the three month growth rate exceeds the twelve month, we interpret this to be a sign of positive momentum and accelerating growth. The situation this year is the reverse with negative momentum. The world as a whole currently has a negative growth of 3.9 percent in 3 months and negative 2.5 percent in 12 months. All regions except the CIS had negative growth and negative momentum in the latest data. The positive performance of the CIS was driven by Ukraine which had a growth of + 7.6 percent in three months through November year over year. India was the only other country to have positive Y/Y growth in three months through November. In the November data, China was down by 2.6 percent in three months year over year, North America was down by 11.3 percent in total with the US down by 12.4 percent, Canada down by 10.8 percent and Mexico by 6.2 percent. The European Union was down by 6.1 percent and other Europe was down by 6.4 percent led by Turkey down by 7.4 percent.
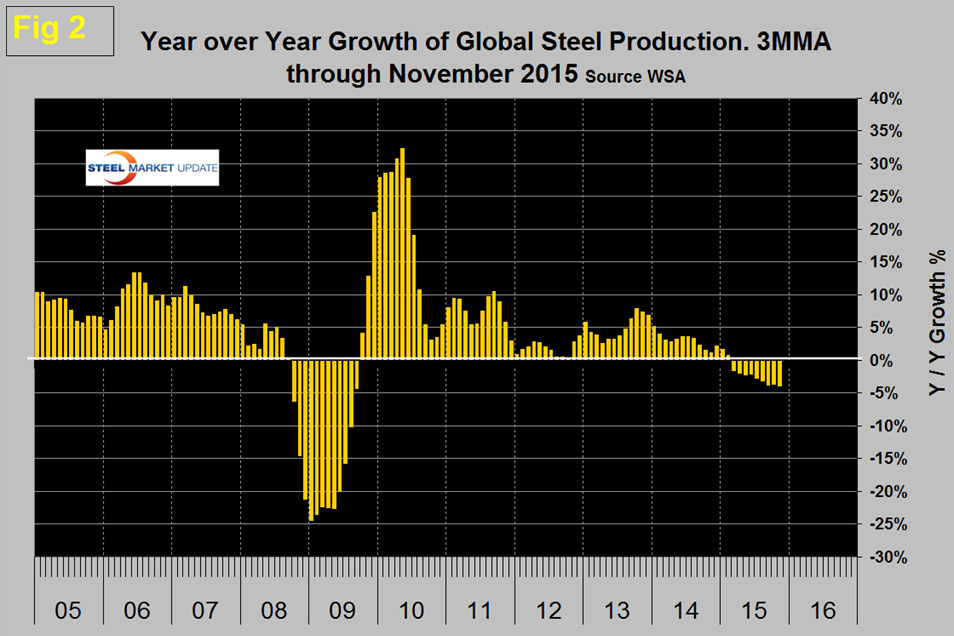
Figure 2 shows the 3MMA of the monthly year over year growth of global steel production which was negative in March for the first time since September 2009.
In October the World Steel Association published their latest Short Range Outlook (SRO) for apparent steel consumption in 2015 and 2016. We will leave these in our monthly updates until the April 2016 revision is released. (Note this forecast is steel consumption, not crude steel production which is the main thrust of what you are reading now.) The first table of the SRO is by region and the second for the top 10 consuming nations.
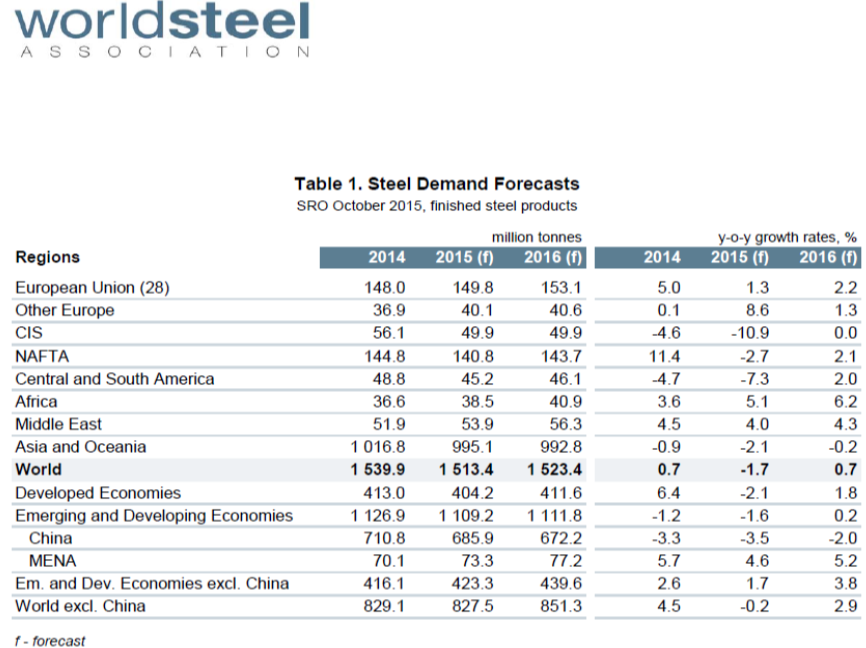
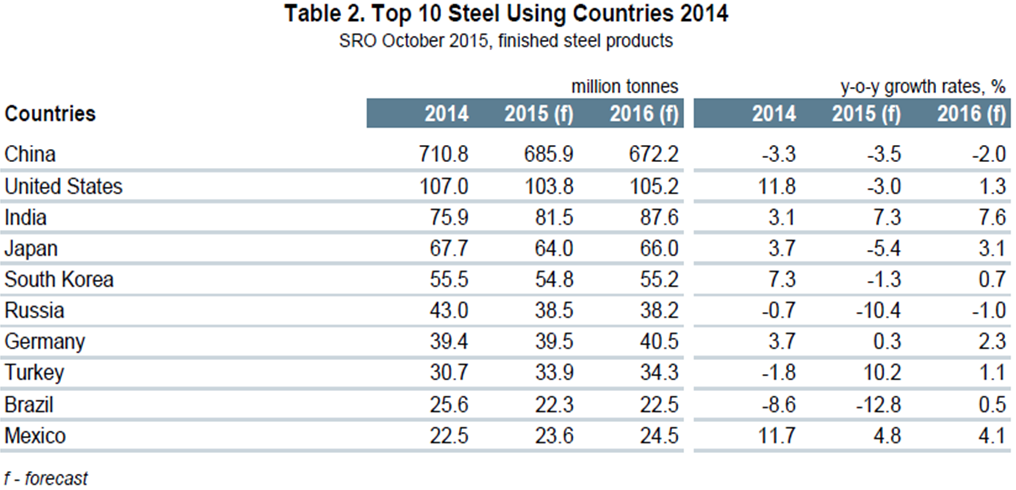
At the global level, consumption must equal production in the long term with inventory adjustments interfering with that relationship in the short term. WSA are forecasting a 1.7 percent contraction in demand this year followed by a 0.7 percent expansion next year. Based on this analysis by the WSA, NAFTA will decline by 2.7 percent this year and grow by 2.1 percent next year with the US contracting by 3.0 percent and growing by 1.3 percent on the same basis.
SMU Comment: Changes in production and consumption must be proportional in the long term and we think that the WSA forecast looks increasingly optimistic. They have demand declining at the global level by 1.7 percent this year but production is already down by 2.5 percent in 12 months through November and deteriorating. China is exporting far more than the US produces, a situation that is not likely to change in the short term as they play the game of shipping to destinations of least resistance. The relatively low price of ore compared to scrap is helping the competitive position of the Chinese integrated producers who are flooding the world with semi-finished billets. These exports are being disguised by classification as square bar which makes it difficult to comprehend the true nature of the global scrap and semis market. (Source World Steel Association)


