

Market Data

December 22, 2015
Oil and Gas Prices and Rotary Rig Count Analysis
Written by Peter Wright
Figure 1 shows historical gas and oil prices since January 2000. The daily spot price of West Texas Intermediate closed at $36.31 on December 14th, down from $45.91 on October 17th, according to the latest daily figure available from the Energy Information Administration (EIA). Brent closed at $36.51 on December 14th.
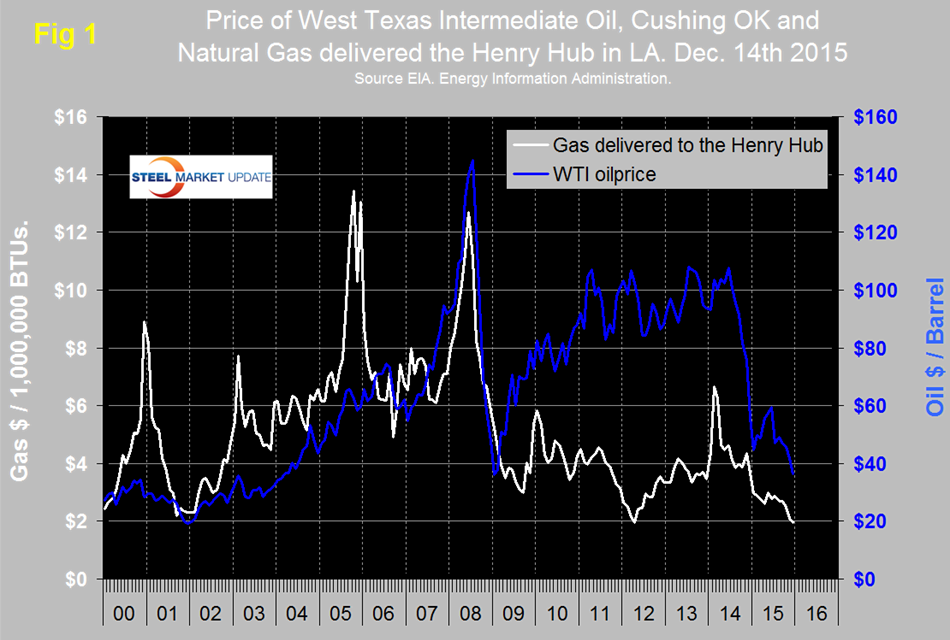
WTI was down from a recent high of $59.53 on June 15th. The current price of WTI is the lowest since February 2009. January 2009 at $36.00 was the low point of the recessionary commodity bust. Wall Street breakfast reported on December 21st; Brent crude is shattering records, losing a fifth of its value in the last month and a third since early October. The benchmark has now hit levels not seen since 2004, skidding 2 percent to as low as $36.06 per barrel, as oversupply concerns and a strong dollar continue to weigh on the market. With a lifting of the ban on U.S. oil exports and new supplies looming from Iran, West Texas Intermediate crude is also feeling the pressure and is at its lowest since February 2009. The December 4 meeting of OPEC, could reach no agreement on production curtailment. The lower oil goes, the more pumping is likely to occur. Gary Bourgeault, research analyst wrote on December 7th: “It has been known for some time that the official quotas for OPEC production have been routinely ignored by member states, but competitive forces and weakened economies have resulted in countries not even trying to keep up the façade. They are doing what’s best for themselves and not the cartel in general. With Russia stating it has no intention of cutting production and Saudi Arabia saying it won’t cut production unless non-OPEC and OPEC members agree to do the same, there is nothing suggesting a reduction in supply in 2016. OPEC is fraying because each of the member countries are being forced to fight for market share in the face of the arrival of U.S. shale as a new competitor. Everything else in the industry is the same as in the past. For that reason, lower oil prices are the new reality.”
The price of natural gas, delivered the Henry Hub in Louisiana closed at $1.96/MMBTUs on December 11th which is the latest data published by the EIA. This was the first time below $2.00 since April 2012 when it briefly reached $1.95. The price has been trending down for almost two years with an acceleration in the last few months. The United States is awash in natural gas in spite of the fact that U.S. power stations are now generating more power from natural gas than from coal. The reserves in the Marcellus and Utica shale regions amount to quadrillions of cubic feet of the commodity. The bottom line is that supply is far above demand and is driving the price direction on the New York Mercantile Exchange. The prospect for a relief rally any time soon is bleak.
Figure 2 shows the apparent supply of the two main steel tubular products used in oil and gas production from January 2003 through October 2015.
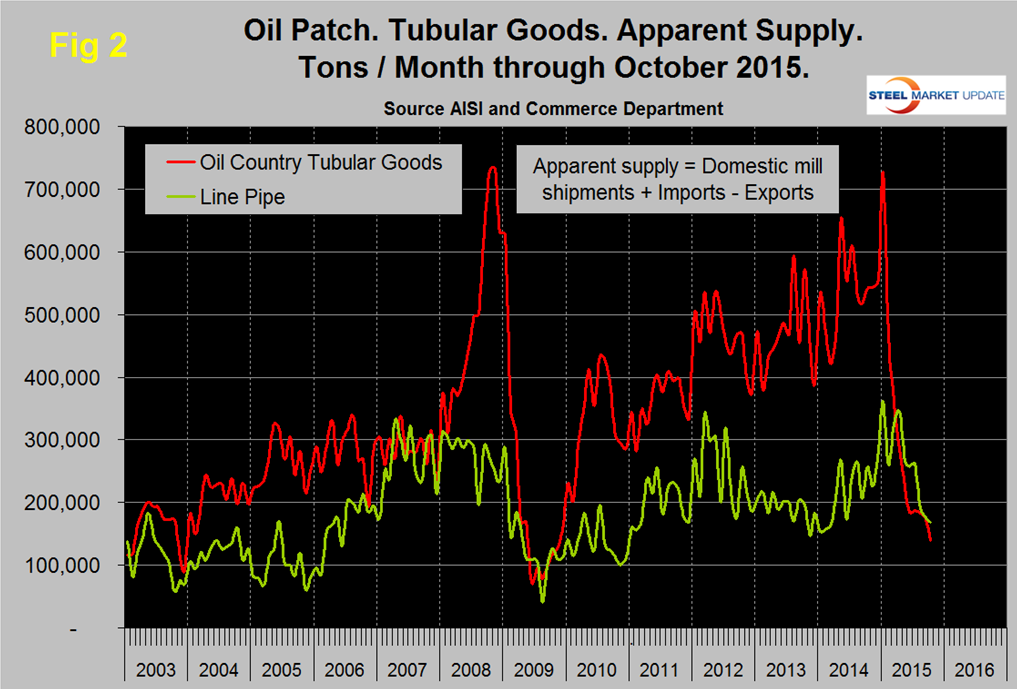
The demand for OCTD is now the lowest since November 2009, demand averaged about 600,000 tons per month from May 2014 through January this year but in three months through October has declined to an average of 166,000 tpm. Since January, line pipe has declined to a level not seen since Q2 last year.
Figure 3 shows the Baker Hughes US Rotary Rig Counts for oil and gas equipment through November 20th. (Explanation below).
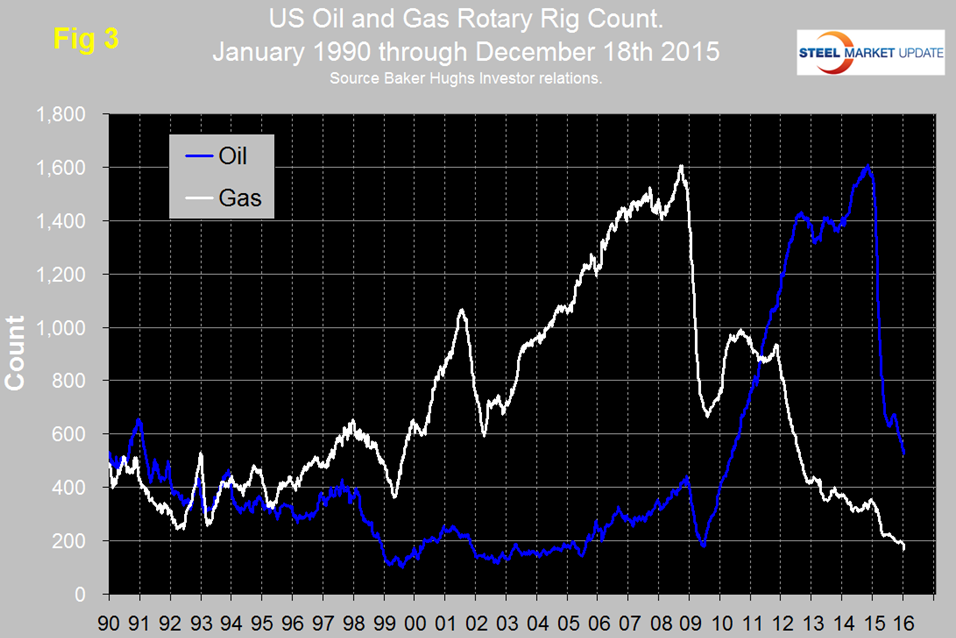
The total number of operating rigs in the US and Canada on December 18th was 871, down 52 in the last month and down from 2,018 on January 2nd. Year over year the total US and Canada rig count is down by 61.5 percent. The decline in the US oil rig count hesitated in July and August but since then has been continuous and was down by 23 in the last month. The decline in the oil rig count didn’t begin until October 10th last year, four months after the beginning of the oil price collapse. After a partial recovery in 2011 and 2012 the decline in the gas rig count has continued though the decline has been a bit slower in the last few months. On a regional basis in the US the big three states for operating rigs are Texas, Oklahoma and North Dakota. Texas at 317 on December 18th was down by 23 in the last month, Oklahoma at 86 was up by 5 and North Dakota at 58 was down by 5.
Steel Market Update’s view is that based on all we read, low oil prices will be with us for a while and neither the oil or gas rig counts have bottomed yet. Inventory adjustments must be playing a part in the demand decline of OCTGs. We have no information detailing the proportion of oil field tubulars that are handled by service centers but assume it is small. The MSCI data combines all tubular products therefore may not be a good indicator for the oil field sector. What we do see from the MSCI data is a very slow response to a deteriorating market. The tonnage of tubular inventories increased through August this year but have declined rapidly in the last three months. Shipments have been declining since the middle of last year (Figure 4).
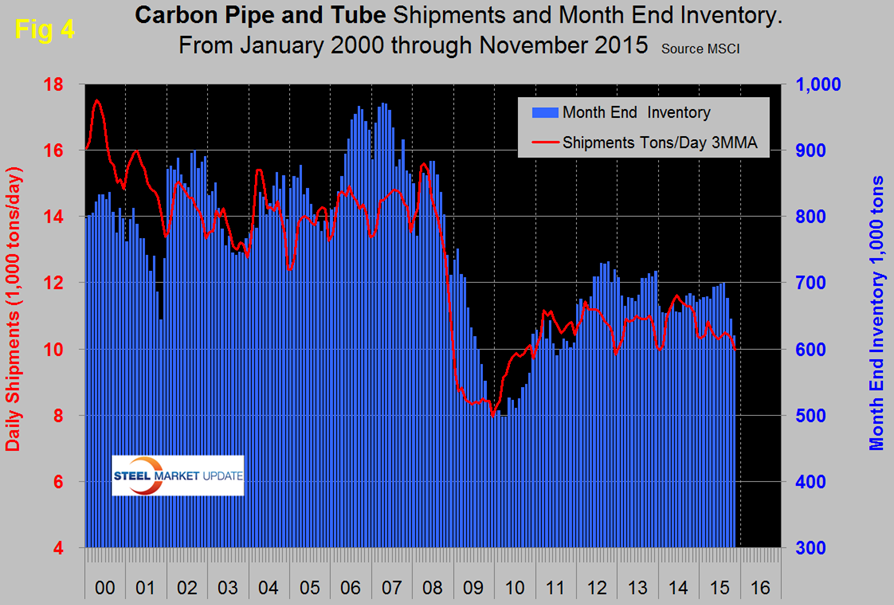
The discrepancy between the MSCI pipe and tube report and the state of the energy markets may be due to a strengthening of hollow structural shapes which would mitigate the decline in energy products.
Baker Hughes rotary rig count explanation: These are a weekly census of the number of drilling rigs actively exploring for or developing oil or natural gas in the United States. Rigs are considered active from the time they break ground until the time they reach their target depth and may be establishing a new well or sidetracking an existing one. The Baker Hughes Rotary Rig count includes only those rigs that are significant consumers of oilfield services and supplies.


