

Analysis

December 22, 2015
US Vehicle Sales & NAFTA Vehicle Production for November 2015
Written by Peter Wright
In November, vehicle sales in the US maintained their very high seasonally adjusted annual rate of 18.2 million units for the third consecutive month. All the growth this year has been in light trucks which includes crossovers. Sales in November were 6.2 percent higher than the same month a year ago. Year to date sales are at a record pace of 17.4 million units.
![]() Light trucks continue to dominate with 10.4 million units up from 10.2 million in October. Autos fell from 8.0 to 7.8 million annualized. It is probable that 2015 as a whole will have the best pace since 2001. Pent-up demand for vehicles is being quickly absorbed and the decline in gasoline prices is encouraging consumers to buy larger vehicles. Most automakers are benefiting with the exception of Volkswagen, whose sales fell 25 percent as the fallout from its emissions scandal continued. North American assembled vehicles had a market share of 78.5 percent, the same as in October but down from >80 percent in September.
Light trucks continue to dominate with 10.4 million units up from 10.2 million in October. Autos fell from 8.0 to 7.8 million annualized. It is probable that 2015 as a whole will have the best pace since 2001. Pent-up demand for vehicles is being quickly absorbed and the decline in gasoline prices is encouraging consumers to buy larger vehicles. Most automakers are benefiting with the exception of Volkswagen, whose sales fell 25 percent as the fallout from its emissions scandal continued. North American assembled vehicles had a market share of 78.5 percent, the same as in October but down from >80 percent in September.
Total light vehicle (LV) production in NAFTA in November was at an annual rate of 17.256 million units, down from 19.499 million in October. Production in the first eleven months of this year has averaged 17.6 million units. In cases where seasonality is more than a weather effect, we like to compare the monthly result with the monthly norm over a number of years. On average since 2004, November’s production has been 10.8 percent less than October which on average has the highest monthly production of the year. This year November was 11.5 percent less than October (Figure 1).
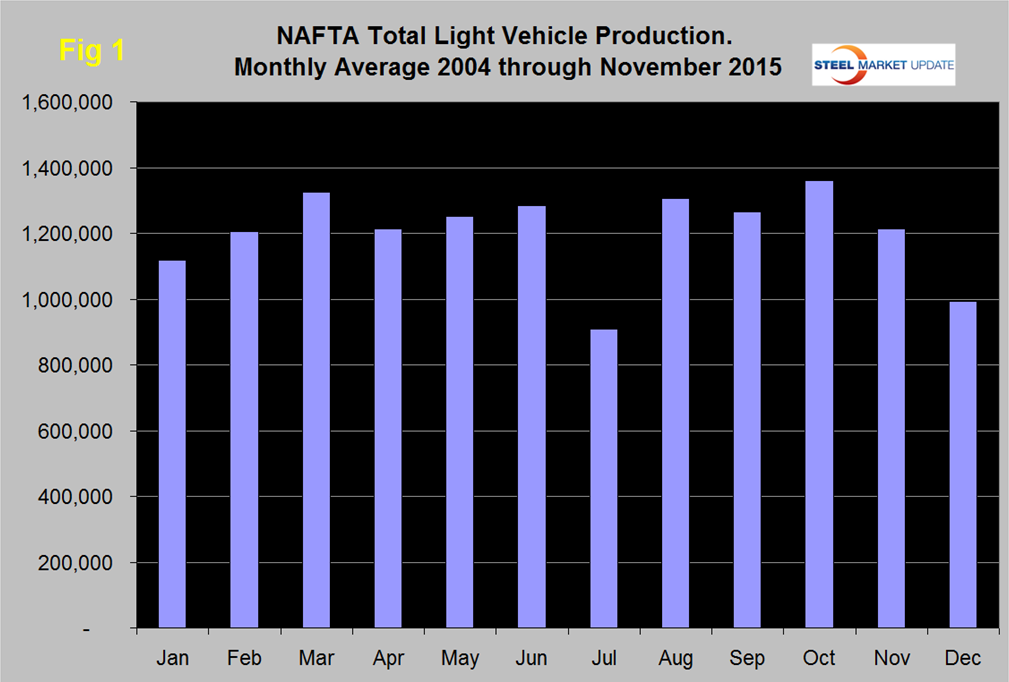
Note: these production numbers are not seasonally adjusted, the sales data reported above are seasonally adjusted. November production was the highest November since 1999. History tells us that assemblies will decline again in December then recover in January through March.
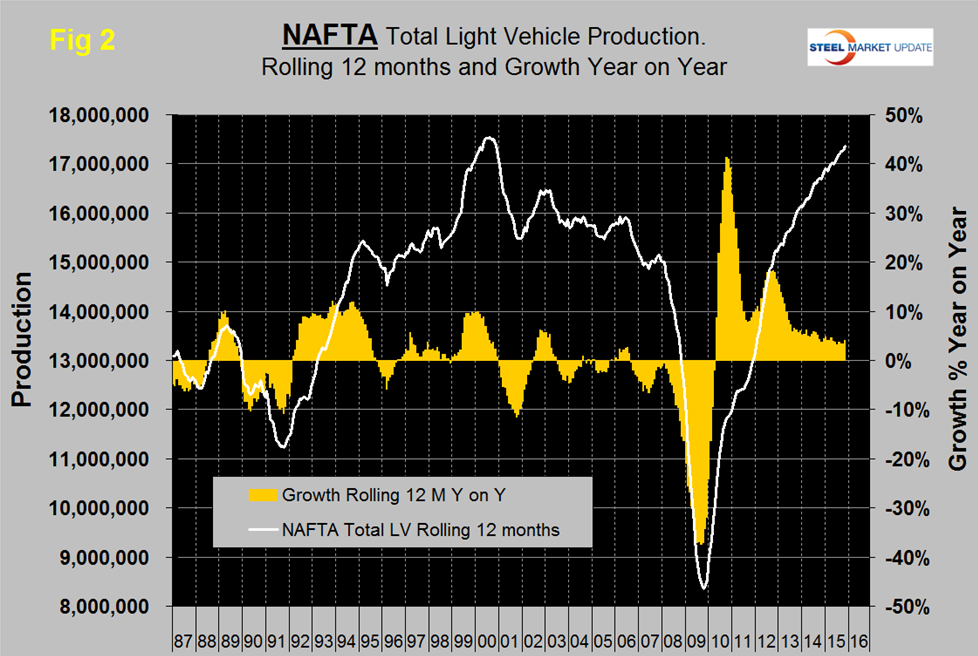
On a rolling 12 months basis y/y through November, LV production in NAFTA increased by 4.1 percent which was up from the 3.4 percent gain in 12 months through October. That increase was a slight blip in a growth rate that has been slowing since the fourth quarter of 2012. LV production in NAFTA is now well above the pre-recession peak of Q2 2006 and is heading for the all-time high of mid-2000 (Figure 2).
On a rolling 12 months basis y/y the US is up by 4.4 percent with positive momentum, Canada is down by 2.0 percent with negative momentum and Mexico is up by 7.0 percent with negative momentum (Table 1).
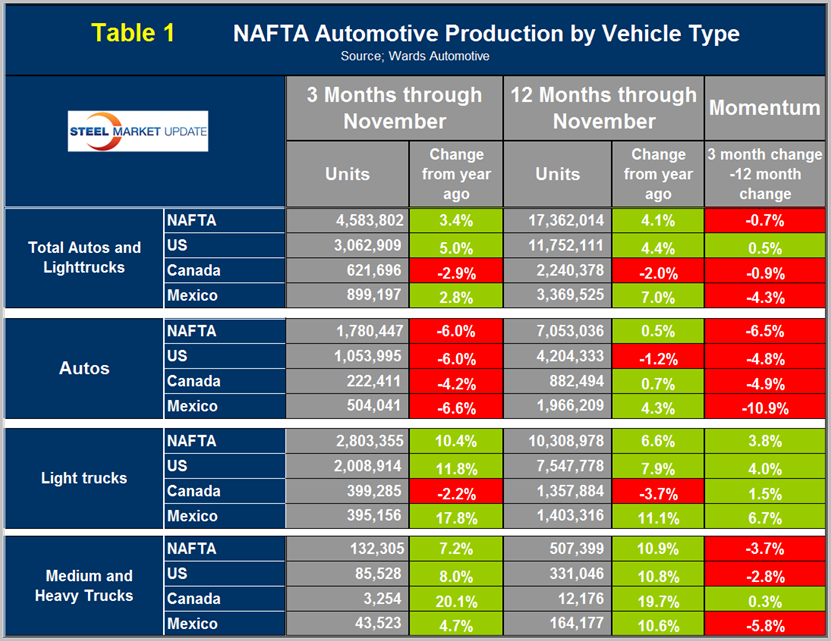
Mexico has had negative momentum for seven straight months and in eight of the last nine months. Having said that, when looking at the long term picture as we discuss below, it is evident that the rising tide is lifting both the US and Mexico but Canada is languishing. The US has gained production share in the most recent 3.5 years (Figure 3) at the expense of Canada.
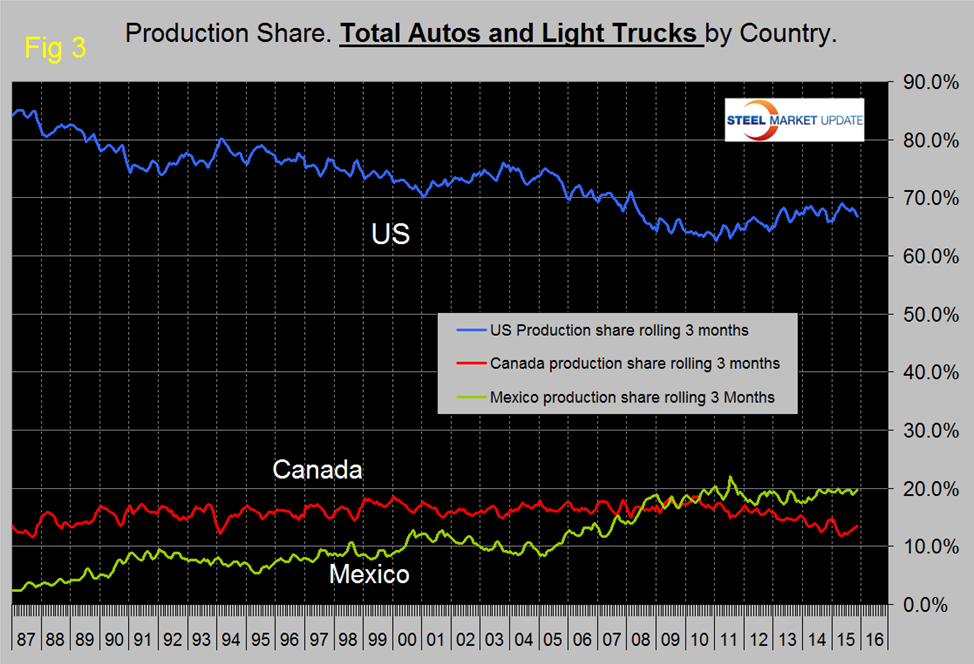
Mexico’s share has been fairly flat for five years. A close examination of Canadian and US share this year in Figure 3 shows that there is a mirror image effect suggesting that the auto companies routinely move production from one side of the border to the other. In November on a rolling three month basis, the US production share of total light vehicles was 66.8 percent, Canada’s was 13.6 percent and Mexico’s was 19.6 percent.
Figure 4, Figure 5 and Figure 6 show total LV production by country with y/y growth rates and on each the red line shows the change in production since Q2 2006.
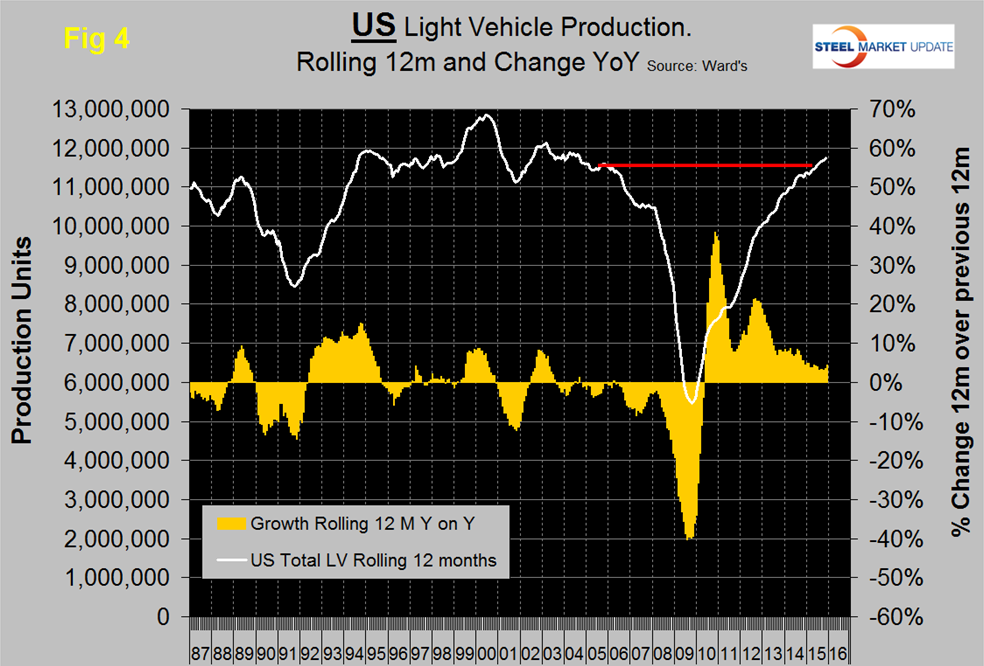
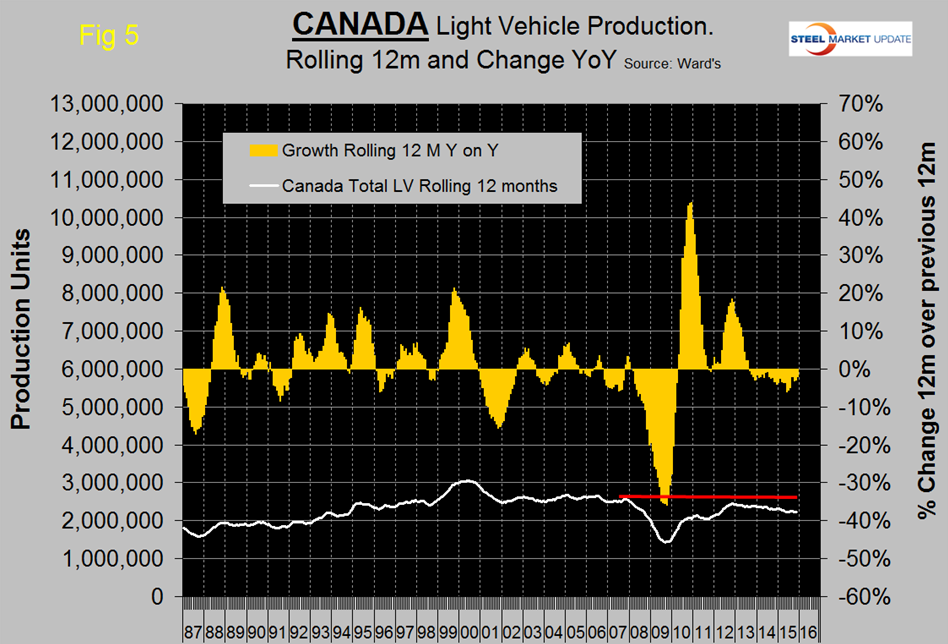
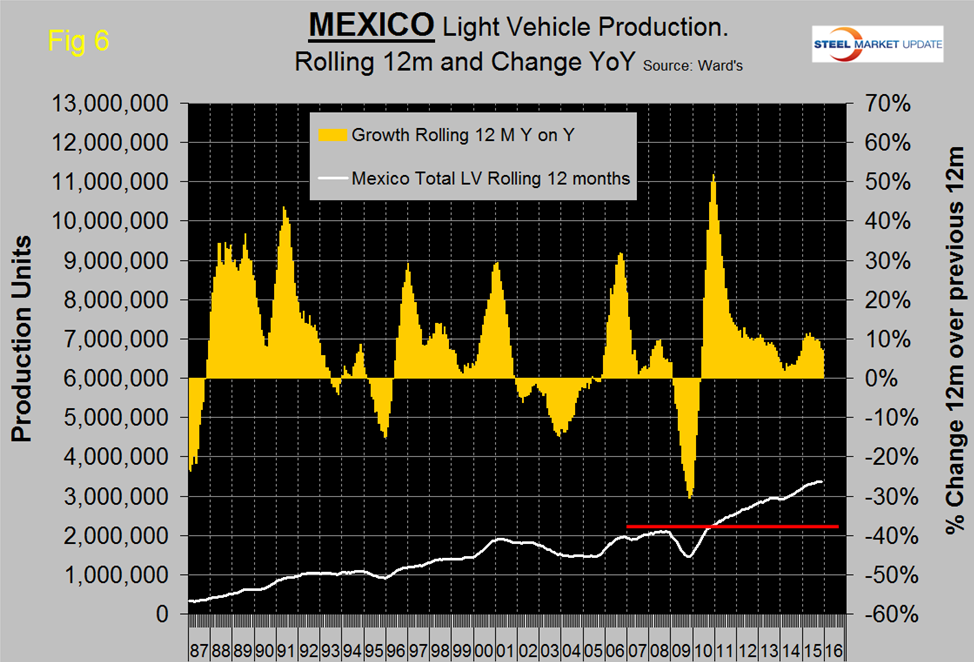
Note the scales are the same to give true comparability and that Mexican growth has slowed significantly this year but is still higher than in the US. Canada continues to contract. During the recession Mexico declined by less than the US and bounced back by more during the recovery. This caused Mexico’s production share to surge until Mid-2011 at the expense of the US.
The percentage of autos in the production mix of all three countries is down this year, meaning that light trucks are up. The mix of light vehicles is very different by country (Figure 7).
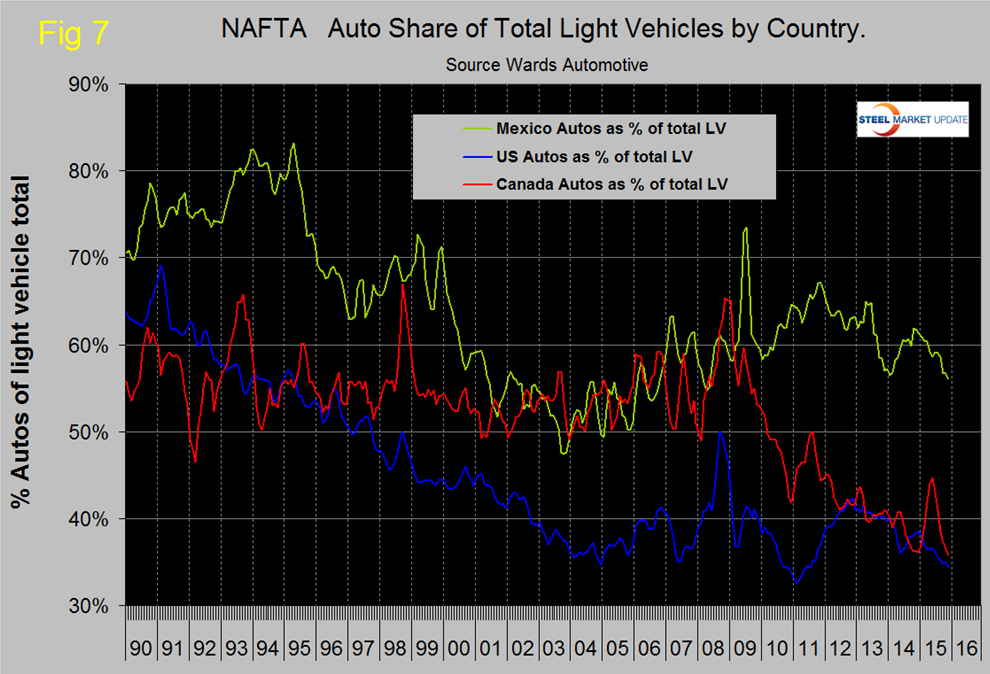
The percentage of autos in the Mexican mix in the last three months was 56.1 percent but only 34.4 in the US and 35.8 percent in Canada. This means that Mexico has staked out a higher relative capacity in autos which will serve it well when gas prices inevitably rebound. September, October and November had the lowest percent of autos in the US mix since July 2011.
Ward’s Automotive reported this week that total light vehicle inventories in the US decreased by 4 days of sales from 69 at the end of October to 65 at the end of November and down by 5 from November last year. Month over month FCA (Fiat Chrysler Automotive) was down by 3 to 86 days, Ford was up by 1 days to 82 and GM down by 6 to 69 days.
The SMU data file contains more detail than is shown here in this condensed report. Readers can obtain copies of additional time based performance results on request if they wish to dig deeper. Available are graphs of auto, light truck and medium and heavy truck production and growth rate and production share by country.


