

Market Data

January 10, 2016
Net Job Creation by Industry through December 2015
Written by Peter Wright
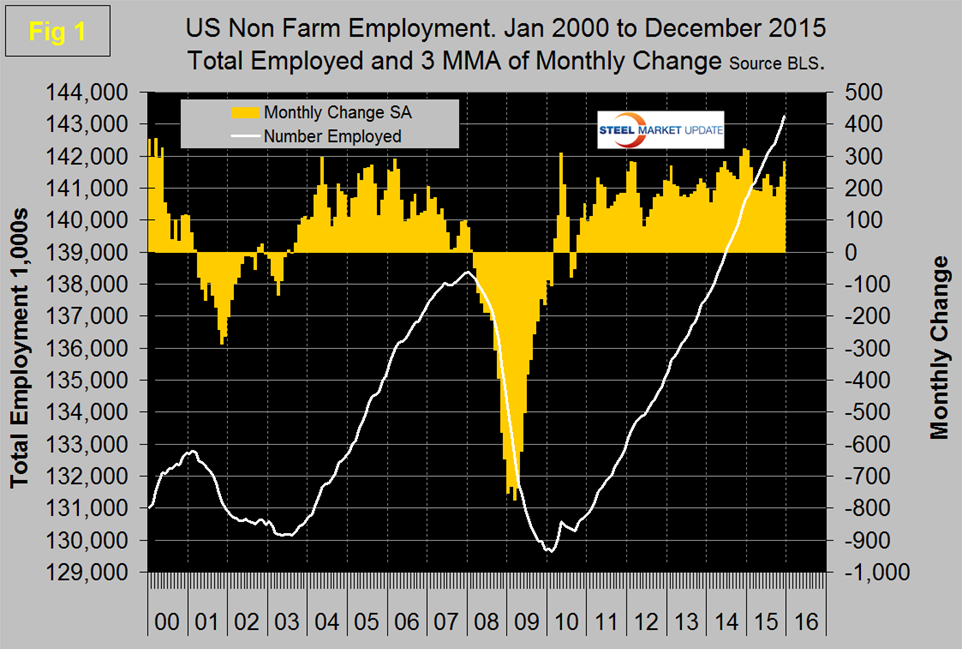
The Bureau of Labor Statistics (BLS) analysis of non-farm employment reported on Friday that 292,000 jobs were added in December, which was better than economist’s consensus expectations. October was revised up by 9,000 and November up by 41,000. The three month moving (3MMA) of gains through December was 284,000. The unemployment rate, U3, calculated from a different survey, remained constant at 5.0 percent. Monthly job gains have averaged 221,000 per month in the twelve months of 2015 (Figure 1).
These numbers are seasonally adjusted by the BLS so to examine if any seasonality is left in the data after adjustment we have developed Figure 2 which suggests that the adjustment is far from perfect.
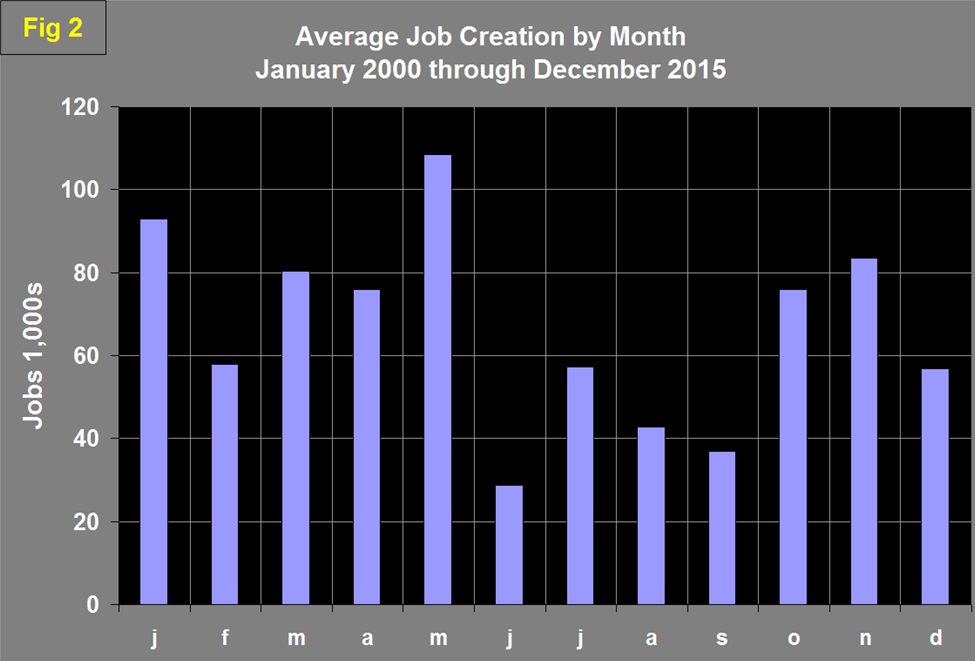
In 16 years the average gain from November to December has been negative 32 percent, this year the change was positive 16 percent. Last month the two discrepancies were the opposite so in a sense the unusual December result was playing catch up. Total nonfarm payrolls are now 4,877,000 more than they were at the pre-recession high of January 2008. In December, the average workweek of all employees on private nonfarm payrolls was unchanged at 34.5 hours. The manufacturing workweek edged down by 0.1 hour to 40.6 hours, and factory overtime edged up by 0.1 hour to 3.3 hours. The average workweek for production and non-supervisory employees on private nonfarm payrolls was unchanged at 33.7 hours. In December, average hourly earnings for all employees on private nonfarm payrolls, at $25.24, changed little (-1 cent), following an increase of 5 cents in November. Over the year, average hourly earnings have risen by 2.5 percent. In December, average hourly earnings of private-sector production and non-supervisory employees, at $21.22, changed little (+2 cents).
Table 1 slices total employment into service and goods producing industries and then into private and government employees.
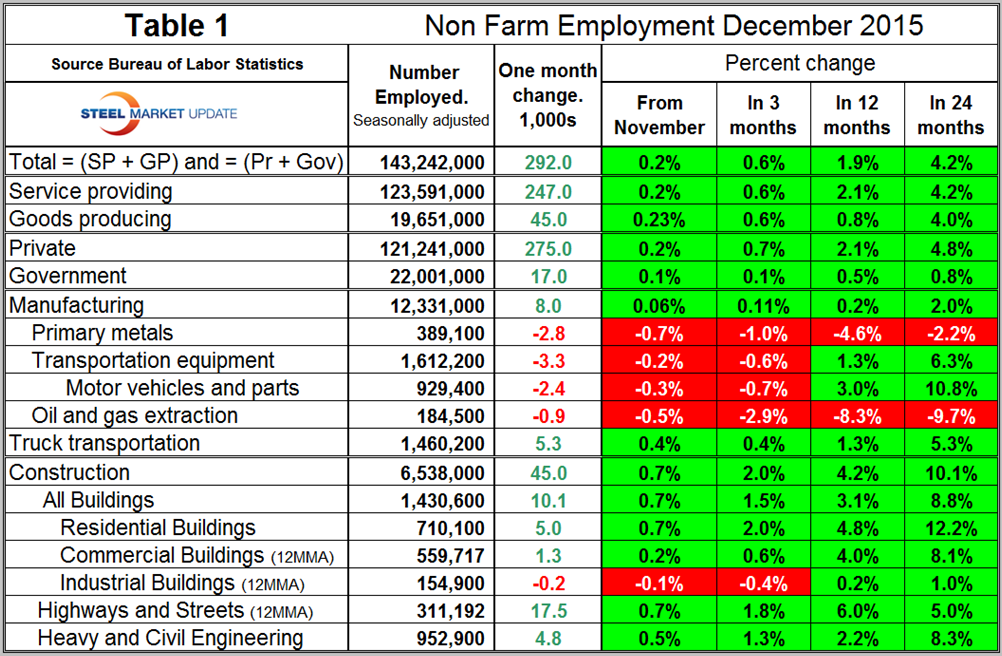
Total employment equals the sum of private and government employees. It also equals the sum of goods producing and service employees. Most of the goods producing employees work in manufacturing and construction and the major components of these two sectors are also shown in Table 1. In December, 275,000 jobs were created in the private sector and 17,000 in government. The growth of government jobs was split, 4,000 Federal, 6,000 State and 7,000 Local. Since February 2010, the employment low point, private employers have added 14,068,000 as government has shed 475,000. In December service industries expanded by 247,000 as goods producing industries added 45,000 people. Since February 2010, service industries have added 11,569,000 and goods producing 2,024,000 positions. Table 1 shows that manufacturing gained 8,000 jobs in December. In all of 2015, manufacturing has added 25,000 jobs. Last month we reported that the gain in manufacturing jobs in 2015 through November was zero. The big change was in the October revision. Note the subcomponents of both manufacturing and construction shown don’t add up to the total because we have only included those that have most relevance to the steel industry. Primary metals lost 2,800 jobs in December, is down by 4.6 percent in the last 12 months and has not had a single positive growth month in 2015. Motor vehicles and parts lost 2,400 jobs in December, oil and gas extraction has had negative job creation in all four time periods examined in Table 1. Truck transportation gained 5,300 jobs in December and is up by 1.3 percent in 12 months. Construction added 45,000 jobs in December for a total of 128,000 in the 4th Q and 263,000 for the year. Some of the major construction sub categories are routinely reported one month in arrears which distorts the data in Table 1. These include, industrial buildings, commercial buildings and highways and streets. Construction employment increased in 190 out of 358 metro areas, was unchanged in 64 and declined in 104 between November 2014 and November 2015, according to a new analysis of federal employment data released today by the Associated General Contractors of America. Association officials noted that the number of metro areas experiencing construction job growth continues to grow as firms appear to be having an easier time finding workers in spite of reports of worker shortages.
Construction continues to move ahead of manufacturing as a job creator but it must be recognized that productivity increases in manufacturing are much greater than they are in construction. Construction has added 1,038,000 jobs and manufacturing 878,000 since the recessionary employment low point in February 2010 (Figure 3).
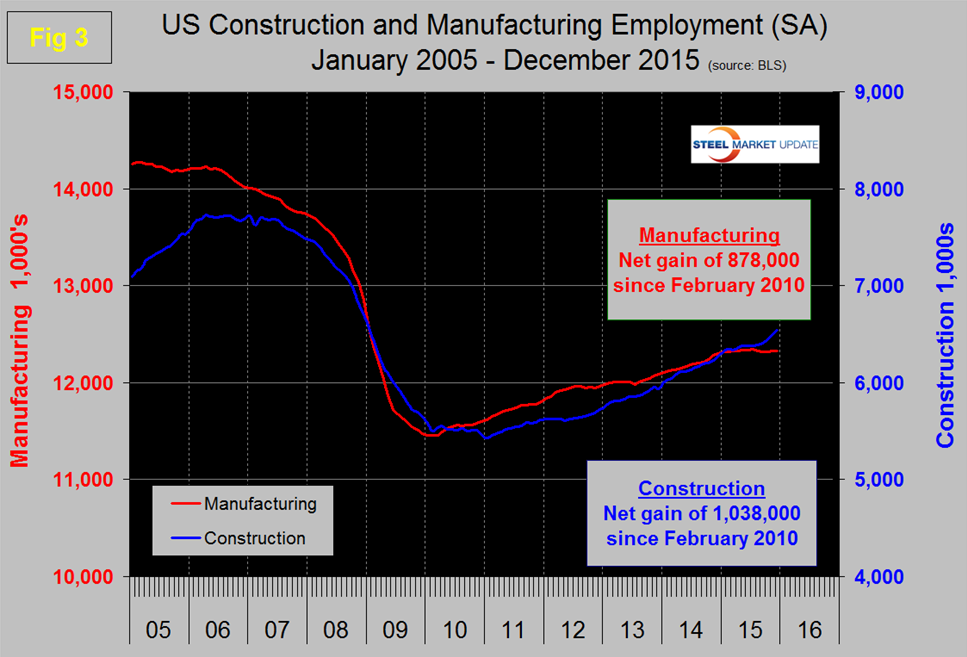
Based on the total construction analysis that we report in our CPIP update, we assume that construction jobs will continue to expand vigorously. Construction has been holding back steel demand but that should increasingly not be the case.
The official unemployment rate known as U3, has decreased from 5.5 percent in May to 5.0 percent in October where it remained through December. This number doesn’t take into consideration those who have stopped looking. The more comprehensive U6 unemployment rate decreased from 11.3 percent in January to 9.9 percent in December (Figure 4).
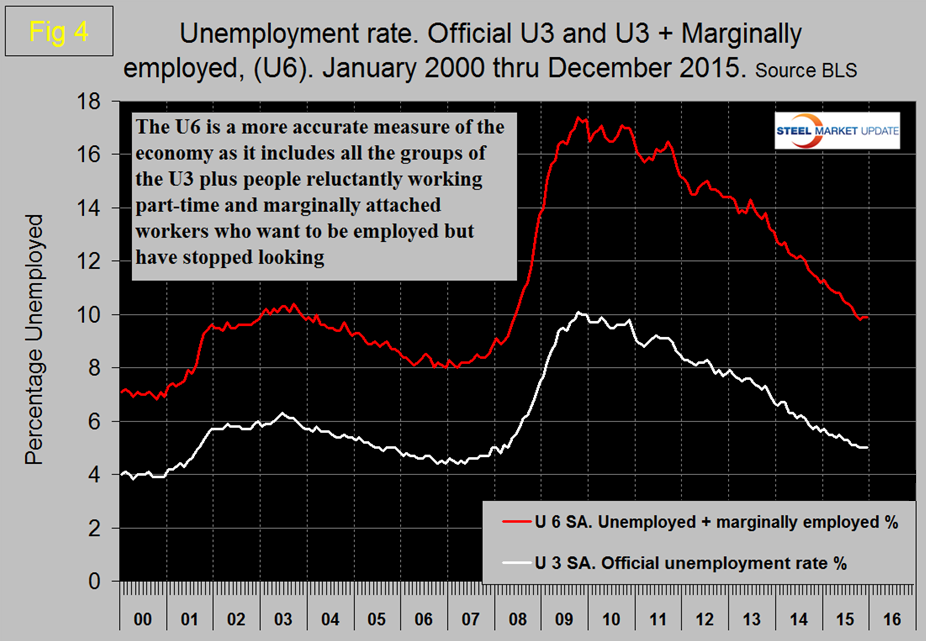
U6 includes workers working part time who desire full time work and people who want to work but are so discouraged that they have stopped looking. The differential between these rates was usually less than 4 percent before the recession but is still 4.9 percent. The good news is that the gap is slowly closing.
So far in 2015 there has been an increase of 2,669,000 full time jobs and a decrease of 147,000 part time jobs. Figure 5 shows the rolling 12 month total change in both part time and full time employment.
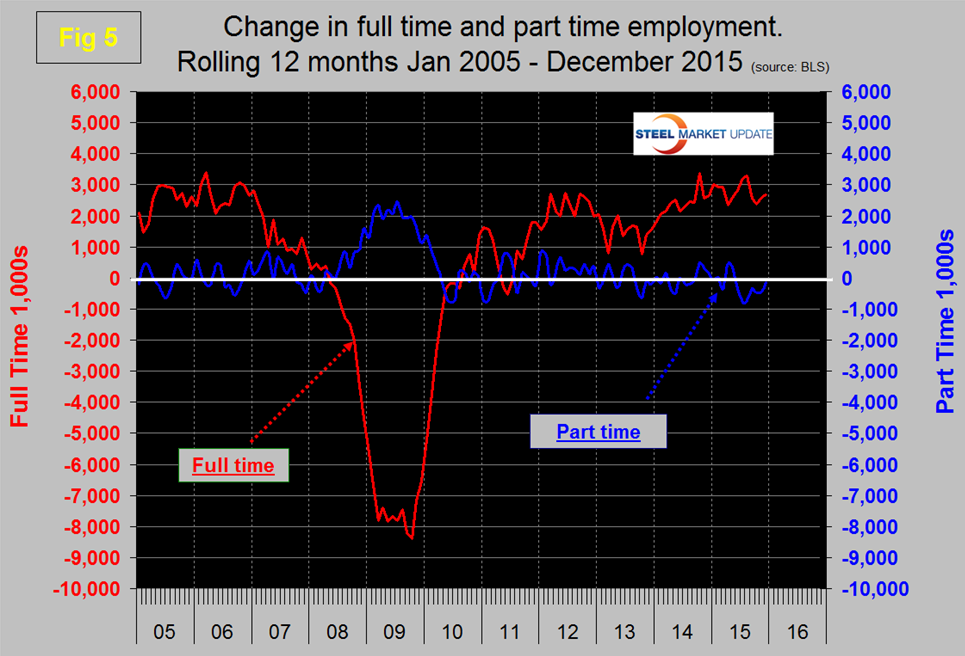
Frequently in the press we read that a large part of job creation is in part time employment. This is not the case but because the part-time numbers are extremely volatile we have to look at longer time periods than a month or even a quarter to get the picture.
The job openings report known as JOLTS is reported on about the 10th of the month by the Federal Reserve and is over a month in arrears. Figure 6 shows the history of unfilled job openings which have skyrocketed in the last two years to levels not seen since the data series was initiated in 2000.
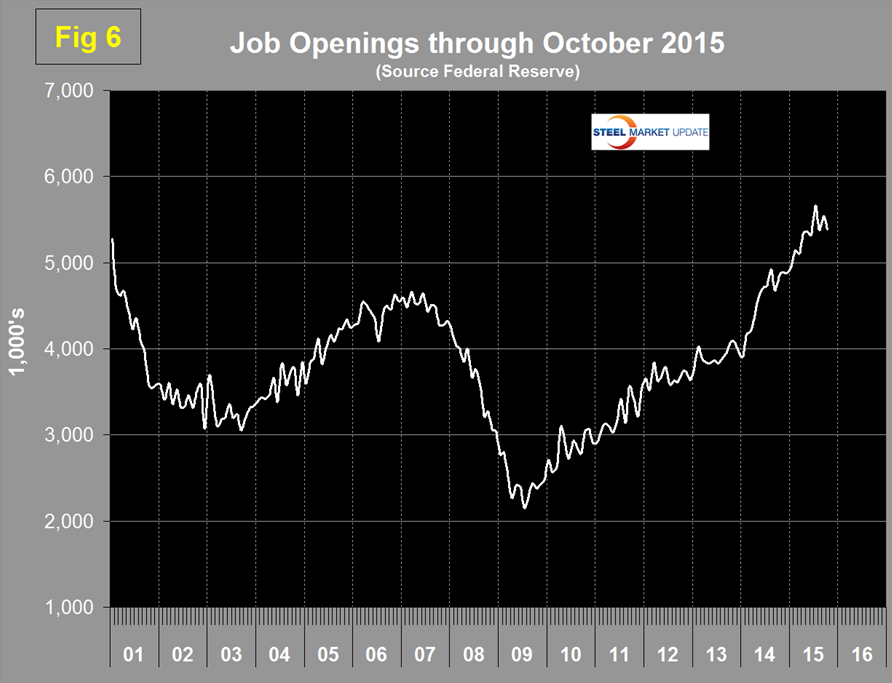
The previous high was 5.25 million at the end of 2000; in the last two years we have seen a surge from 3.906 million in January 2014 to 5.383 million in the latest report.
SMU Comment: It’s inescapable that the rate of growth of manufacturing has slowed and, according to the ISM survey report for November and December, entered a contraction phase. This is also supported by the Federal Reserve Industrial Production Index. Construction has been holding steel consumption back but this effect should rapidly disappear. Unfortunately, the AISI weekly steel production numbers are moving in the opposite direction with a capacity utilization of only 60.2 percent in week ending January 2nd and below 70 percent since October 17th. Even when the import volumes are discounted, steel production is not where it should be based on our benchmark indicators. We assume that inventory reduction throughout the supply chain is the cause.


