

Market Data
January 17, 2016
Oil and Gas Prices and Rotary Rig Count Analysis
Written by Peter Wright
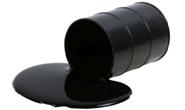
Figure 1 shows historical gas and oil prices since January 2000. The daily spot price of West Texas Intermediate (WTI) closed at $31.42 on January 11th, down from $36.31 on December 14th, according to the latest daily figure available from the Energy Information Administration (EIA).
There have been reports in the press that oil broke through $30 more recently than the latest EIA data. Brent closed at $30.14 on January 11th. Andrew Hecht of Technomentals wrote on December 28th, over the past forty years, WTI has typically traded at a premium of between $2-4 to Brent crude. However, in late 2010 and early 2011, the Arab Spring that brought sweeping political change to the Middle East increased the political premium for Brent crude. In 2011 and 2012, Brent crude rose to a $25 premium to WTI as fears related to supplies and logistical routes through waterways like the Straits of Hormuz and Persian Gulf caused worries about securing oil from the region.
Since the price of oil began to drop in the second half of 2014, the Brent premium over WTI has moved progressively lower. The deal with Iran put additional pressure on Brent crude oil prices as the nation has stated they intend to increase production by one million barrels per day in 2016. Additionally, in the latest U.S. budget deal, the government lifted the ban on U.S. oil exports meaning that inventories of WTI are likely to start to drop in the year ahead. This has provided some strength to WTI crude relative to Brent. Last week, the Brent premium over WTI crude turned into a discount for the first time in years as it headed towards historically normal levels. Brent moving to a discount to WTI is bearish for the price of the energy commodity for two reasons. First, it highlights the high levels of inventories and production from Middle Eastern nations and Russia. Secondly, it means that the political premium for crude oil has decreased dramatically. Therefore, the signal from this quality and location spread is bearish for the price of crude oil as we head into 2016.
WTI is down from a recent high of $59.53 on June 15th 2015. The current price of WTI is the lowest since January 2003. January 2009 at $36.00 was the low point of the recessionary commodity bust. On January 17th Mark Bern stated in the conclusion to a lengthy and seemingly well thought out article; “for the year, I expect the average price of oil to hover between $25 and $35 per barrel for most of 2016. Beyond 2016, I continue to expect that there will be a ceiling on the price of oil at which more production will be brought back online. I now believe that the ceiling is $60/bbl. and do not expect oil to spike above that level often or remain there very long any time over the next five years. A major supply disruption could cause a longer spike but there is enough excess capacity to overcome such a problem in a few months unless there is a massive destructive event that shuts down Saudi Arabia or Iraqi production.”
The price of natural gas, delivered the Henry Hub in Louisiana closed at $2.38 on January 8th, up from $1.96/MMBTUs on December 11th. January 8th was the latest data published by the EIA. The price has been trending down for almost two years with a small improvement in the last month as cold weather in the North drew down inventories. The United States is awash in natural gas in spite of the fact that U.S. power stations are now generating more power from natural gas than from coal. The reserves in the Marcellus and Utica shale regions amount to quadrillions of cubic feet of the commodity. The bottom line is that supply is far above demand and is driving the price direction on the New York Mercantile Exchange. The prospect for a substantial rally any time soon is bleak.
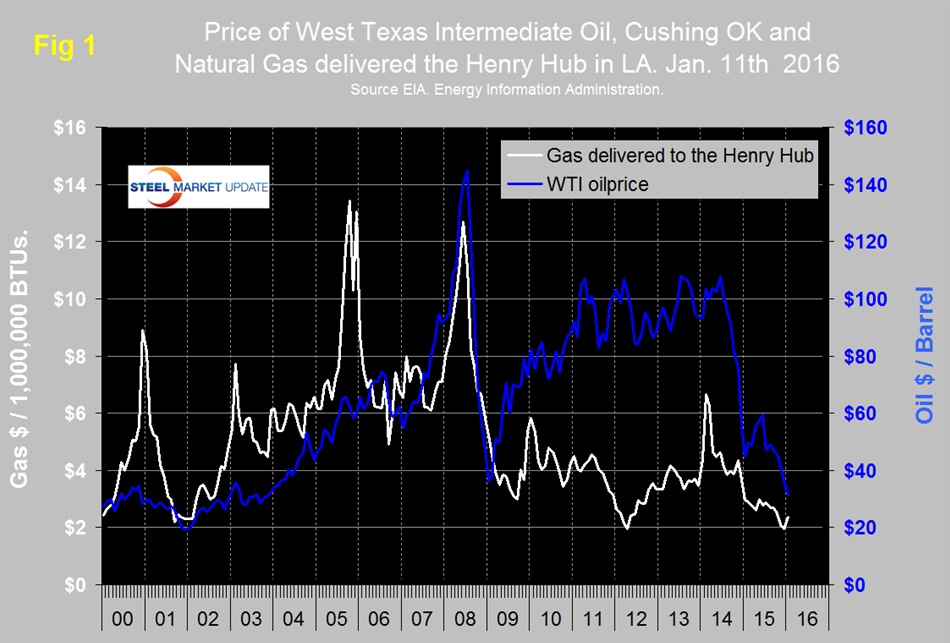
Figure 2 shows the apparent supply of the two main steel tubular products used in oil and gas production from January 2003 through November 2015. The demand for OCTD is now the lowest since November 2009, demand averaged about 600,000 tons per month from May 2014 through January this year but in three months through November has declined to an average of 152,000 tpm. Since January, line pipe has declined to a level not seen since Q1 2014.
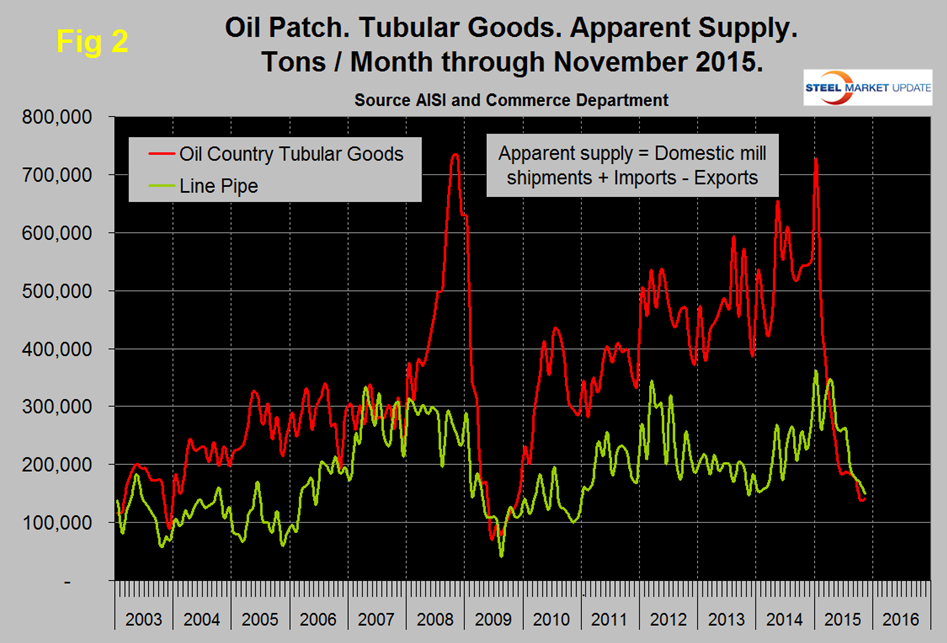
The total number of operating rigs in the US and Canada on January 15th was 877, up from 871 on December 18th but down from 2,018 on January 2nd 2015. Year over year the total US and Canada rig count is down by 58.6 percent. Figure 3 shows the Baker Hughes US Rotary Rig Counts for oil and gas equipment in the US through January 15th. (Explanation below). The decline in the US oil rig count hesitated in July and August but since then has been continuous and was down by 26 in the last month. The decline in the oil rig count didn’t begin until October 10th last year, four months after the beginning of the oil price collapse. After a slight recovery in late 2011 the decline in the gas rig count has continued with an acceleration in the latest data.
On a regional basis in the US the big three states for operating rigs are Texas, Oklahoma and North Dakota. Texas at 298 on January 15th was down from 317 on December 18th, Oklahoma at 87 was up by one and North Dakota at 47 was down by 11. On January 13th Dana Blackenhorn wrote: “The fracking boom has created enormous debt. Companies have raised equity, taken out high-yielding loans against that equity, and sought to pay back the loans with production in order to get rich on the equity. It’s a story as old as the oil cycle, which dates to the 1860s. But we also know how that cycle plays out, because booms have turned bust before, many times. Consolidation has happened. Standard Oil has happened. Production controls have happened. Efficiency has happened.”
SMU’s view is that based on all we read, low oil prices will be with us for a while and neither the price nor the oil and gas rig counts have bottomed yet. Inventory adjustments must be playing a part in the demand decline of OCTGs. We have no information detailing the proportion of oil field tubulars that are handled by service centers but assume it is small and there have been recent reports in the press that one major producer plans to intensify their go direct policy.
Baker Hughes Rotary Rig Count: These are a weekly census of the number of drilling rigs actively exploring for or developing oil or natural gas in the United States. Rigs are considered active from the time they break ground until the time they reach their target depth and may be establishing a new well or sidetracking an existing one. The Baker Hughes Rotary Rig count includes only those rigs that are significant consumers of oilfield services and supplies.


