

Analysis

January 26, 2016
Housing Starts, Permits and Builder Confidence
Written by Peter Wright
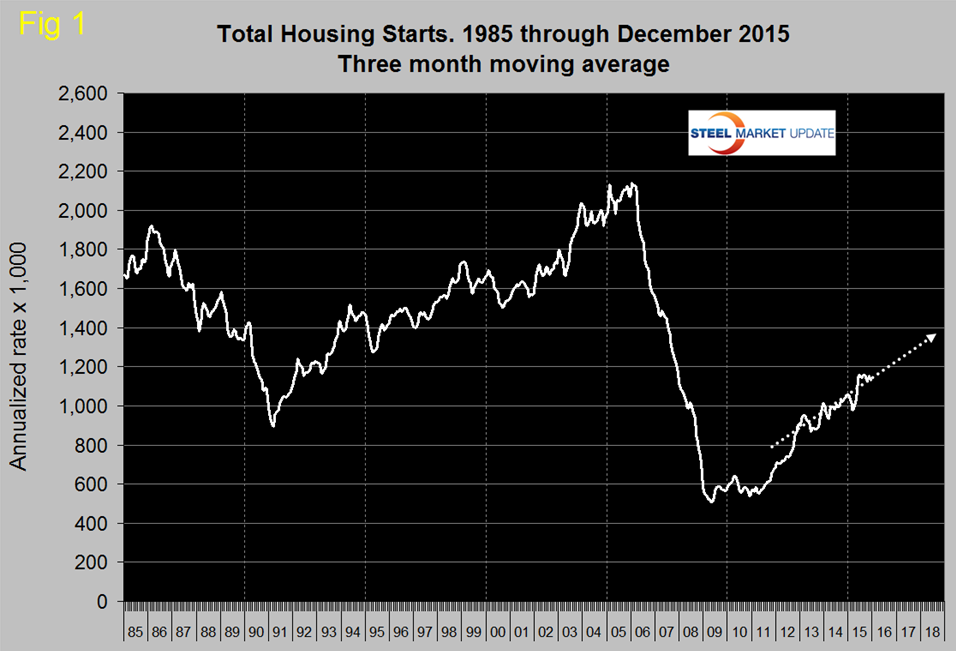
Total housing starts in December were at an annual rate of 1,149,000 which was down from 1,179,000 in November. Since April total monthly starts annualized have ranged from 1,062,000 to 1,211,000 with the high month being June.
In December the three month moving average (3MMA) was 1,133,000 which was down from 1,153,000 in November. August at 1,160,000 had the highest 3MMA since the recession. Total starts are still on track to reach 1.4 million units annualized by the end of 2018 (Figure 1).
Single family starts in December were at an annual rate of 768,000 with a 3MMA of 759,000. The 3MMA was up by 8.5 percent year over year but is still 57.9 percent below the peak of late 2005. Multifamily (apartments and condominiums) starts in December were at an annual rate of 381,000 with a 3MMA of 374,000, up 5.2 percent y/y (Figure 2).
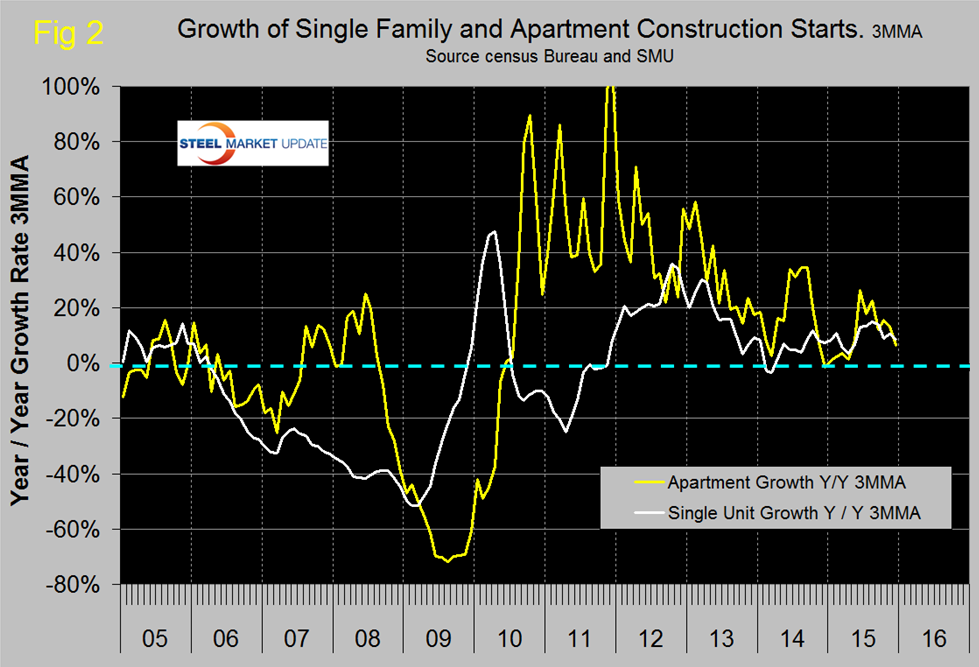
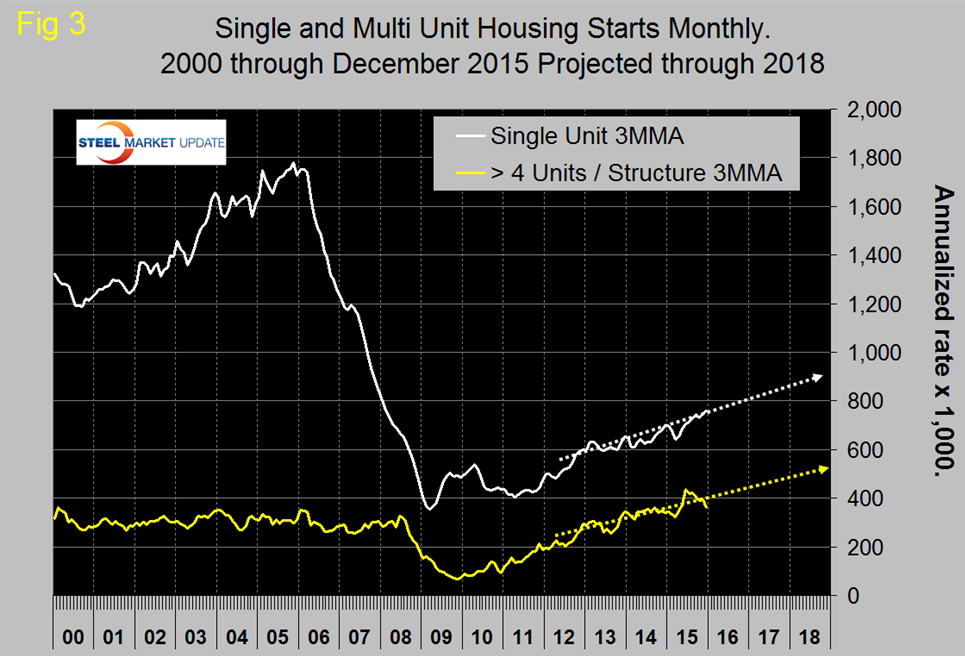
The Census Department results are seasonally adjusted and the monthly numbers are annualized. Multifamily starts had lack-luster growth for seven months prior to June and after a three month surge are now back to what is probably a more sustainable level. The trajectory of single family and apartments > 4 units are tracking to reach 900,000 and 500,000 by the end of 2018 respectively (Figure 3).
Permit data is considered to be a leading indicator for starts. If permits exceed starts then there should be an acceleration in construction and vice versa. Total permits in December were at an annual rate of 1,232,000 with a 3MMA of 1,225,000. For the second time in 2015, permits were well ahead of starts (Figure 4), however it looks as though permits don’t always lead to ground breaking and sometimes, as in 2013 there can be quite a wide divergence.
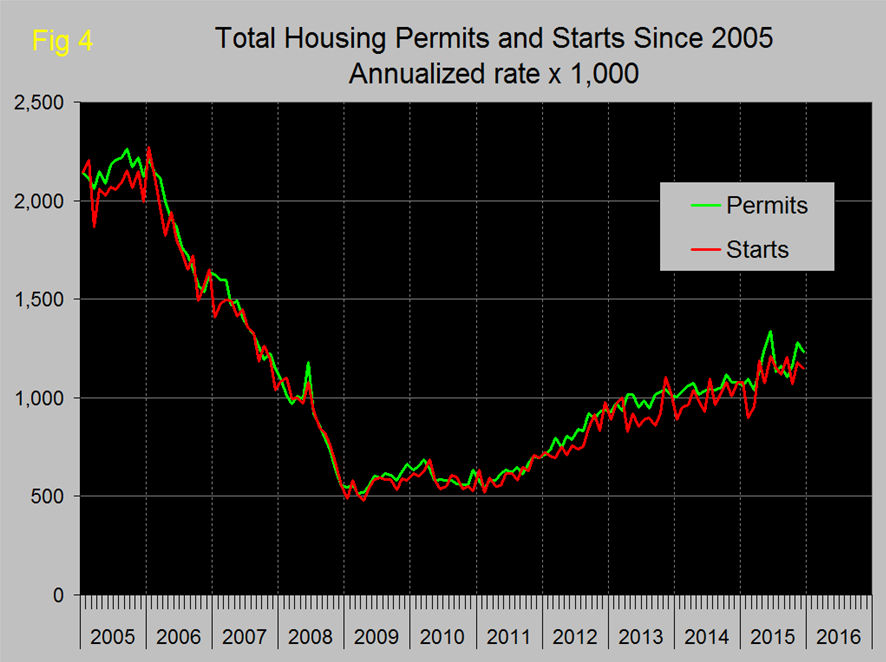
It also looks from Figure 4 that permits don’t really lead starts suggesting that the two are very close together from a timing point of view. On a 3MMA basis total permits were up by 12.2 percent y/y. Single family were up by 9.1 percent and multifamily by 17.0 percent. Multifamily permit growth peaked at 41.4 percent y/y in July last year as buyers moved to take advantage of a tax subsidy in New York State that ended in the 3rd quarter.
Table 1 shows total permits and starts nationally and regionally.
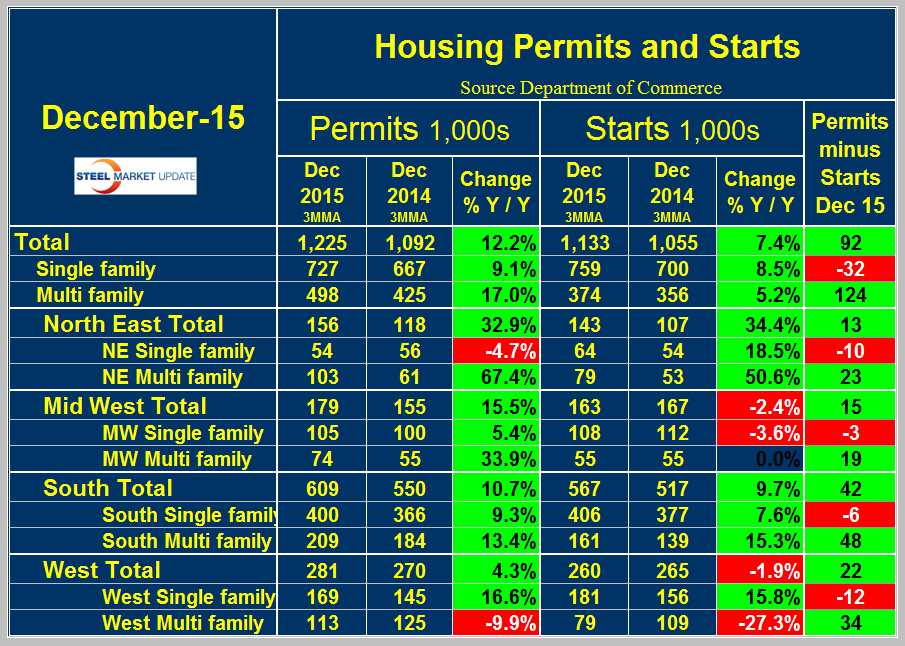
At the national level the differential between permits and starts for single and multi-family units is suggesting that the shift in consumer’s preference towards apartments is ongoing. In December on a 3MMA basis, permits of multi-family exceeded starts by 124,000 in contrast to the negative 32,000 for single family. In total permits were 92,000 more than starts. In the recent past the differential between permits and starts for multi and single family units has been the same across all regions and this is still the case. Multifamily permits exceeded starts in all regions and single family permits fell below starts in all regions. The implication is that the shift in preference for apartments is by no means over and that single family construction will slow slightly. The ratio of the two sectors is shown in Figure 5 and demonstrates that single family homes continue to be less desirable than at any time since 1985.
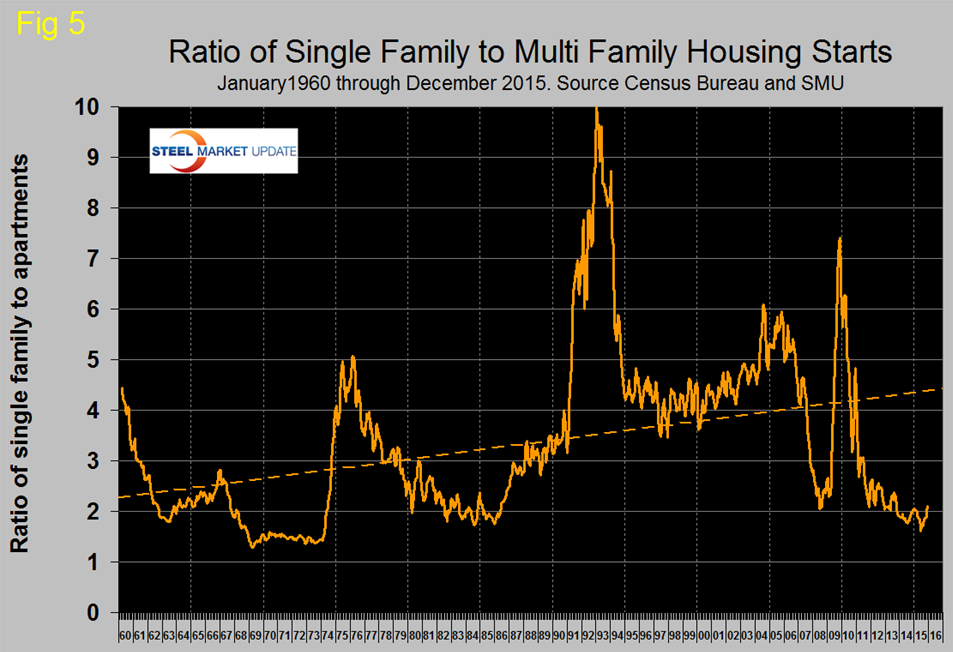
Figure 6 shows the regional situation for the 3MMA of total residential starts since February 2000.
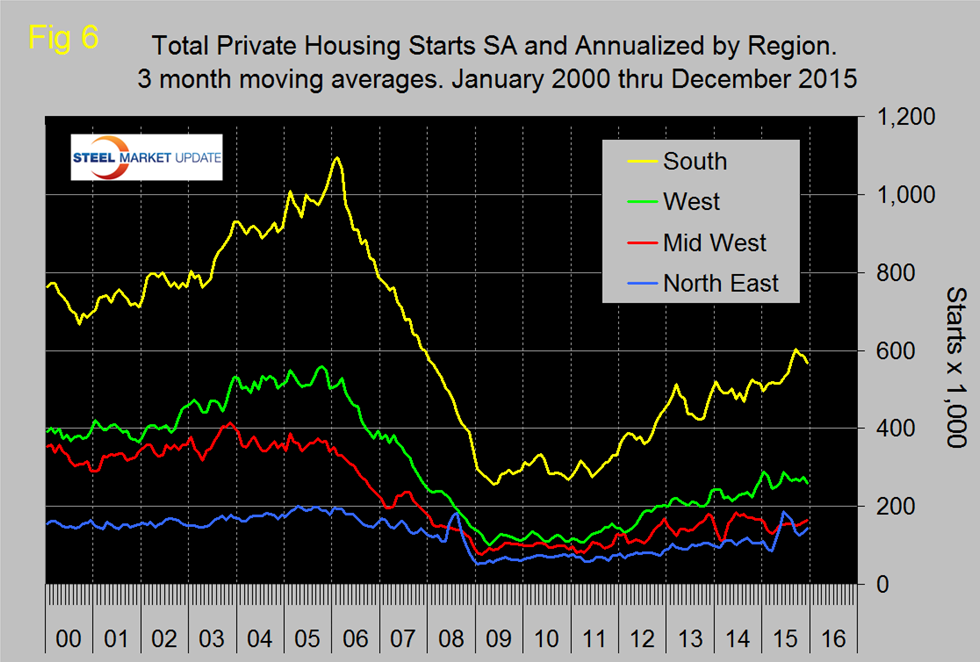
In the first half of 2015 the North East had the highest growth rate driven as mentioned above by apartment construction in New York state but now that has cooled. The South had the most consistent growth in 2015.
The National Association of Home Builders (NAHB) confidence report was released on Tuesday. Any value above 50 indicates an overall positive business confidence. The national average dropped two points in December then held at 60 in January and is now five points lower than October which had the highest confidence level since our data stream began in January 2009. On a 3MMA basis, the index fell from 62.3 in December to 60.7 in January (Figure 7).
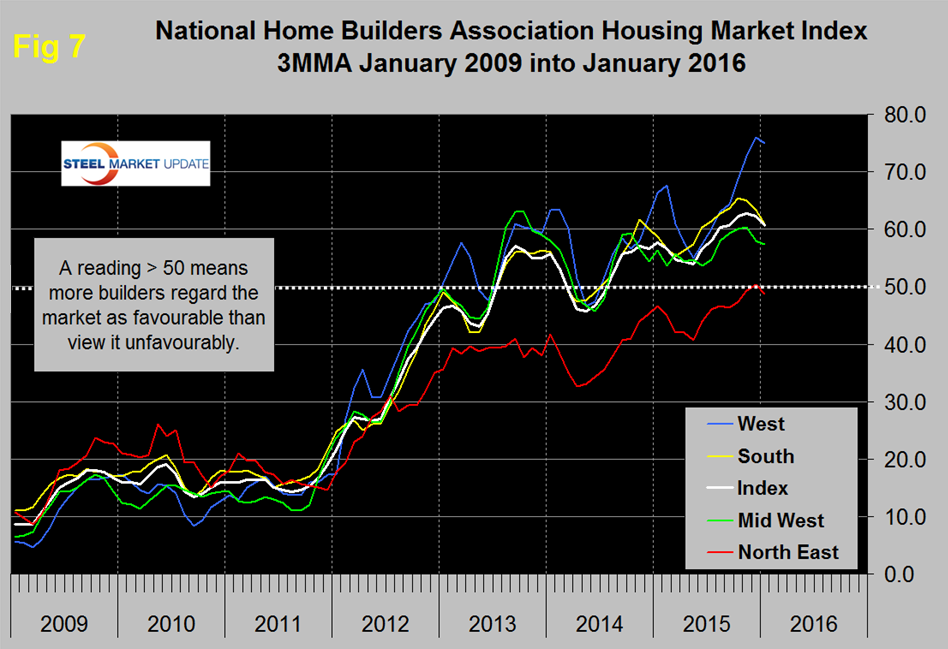
These are still good results for the South and Mid-West, exceptional for the West and just OK for the North East which has dipped below 50 again.
Normally we reproduce the official release from the NAHB in this report but that section of their site is down so we will proceed without it this month.
There is much speculation in the national press these days about an imminent recession, no doubt driven by the recent stock market performance. At SMU we have a couple of data streams that suggest this is not the case. The first that we will show here is housing starts with the last three recessions superimposed (Figure 8).
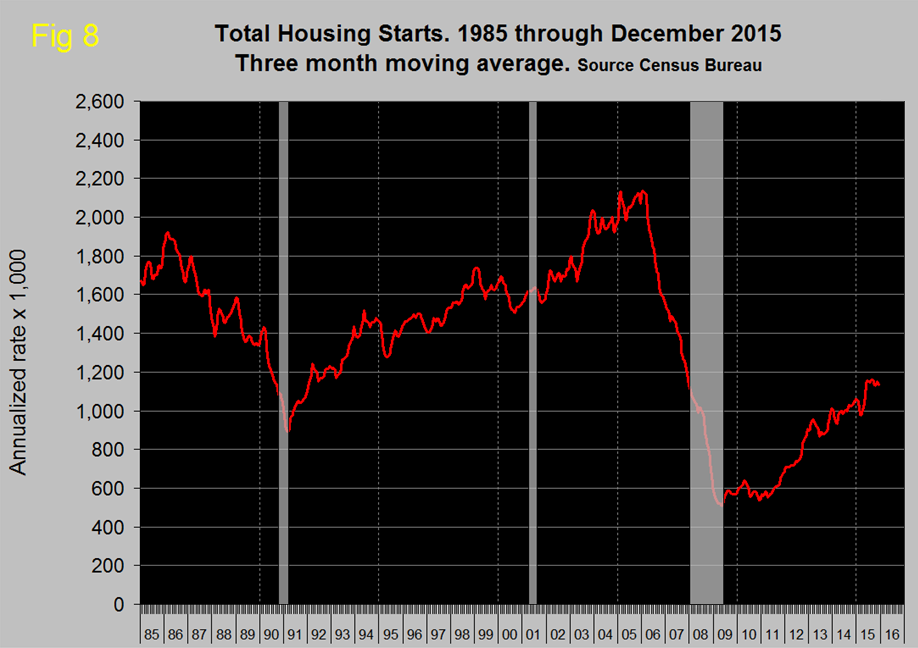
The other is the production rate of heavy trucks which we will describe in our next article on automotive production. Figure 8 shows how housing starts were a leading indicator with several years warning of all three recessions since 1985. Housing is driven by the consumer who accounts for about 68 percent of GDP therefore at this time the starts data is not flashing red as far as the general economy is concerned.


