

Analysis

January 26, 2016
US Vehicle Sales & NAFTA Vehicle Production for December 2015
Written by Peter Wright
In December, vehicle sales in the US eased from the blistering pace of the previous 3 months. Sales fell from 18.2 million in each of the months September, October and November to 17.3 million in December. All numbers quoted here are seasonally adjusted annual rates. For the full year of 2015, sales were 17.3 million units, the best since 2006.
In 2015 the mix of autos and trucks was 7.7 million and 9.7 million. Light trucks includes crossovers. Sales in December were 2.5 percent higher than the same month a year ago. There is still some pent up demand resulting from the destruction of household wealth in the recession but the pace of sales is expected to slow in 2016. Ford’s F series sales have not been adversely affected by the use of more aluminum in the F150. The F series racked up 85,211 sales units in December, the first time in over 10 years to exceed 85,000 units. In each of the last 6 months of 2015, F series sales achieved year over year gains.
Total light vehicle (LV) production in NAFTA in December was at an annual rate of 14.719 million units, down from 19.499 million in October and 17.256 in November. Total production in 2015 was 17.361 million units. In cases where seasonality is more than a weather effect we like to compare the monthly result with the monthly norm over a number of years. On average since 2004, December’s production has been 16.6 percent less than November. This year December was 14.7 percent less than November (Figure 1).
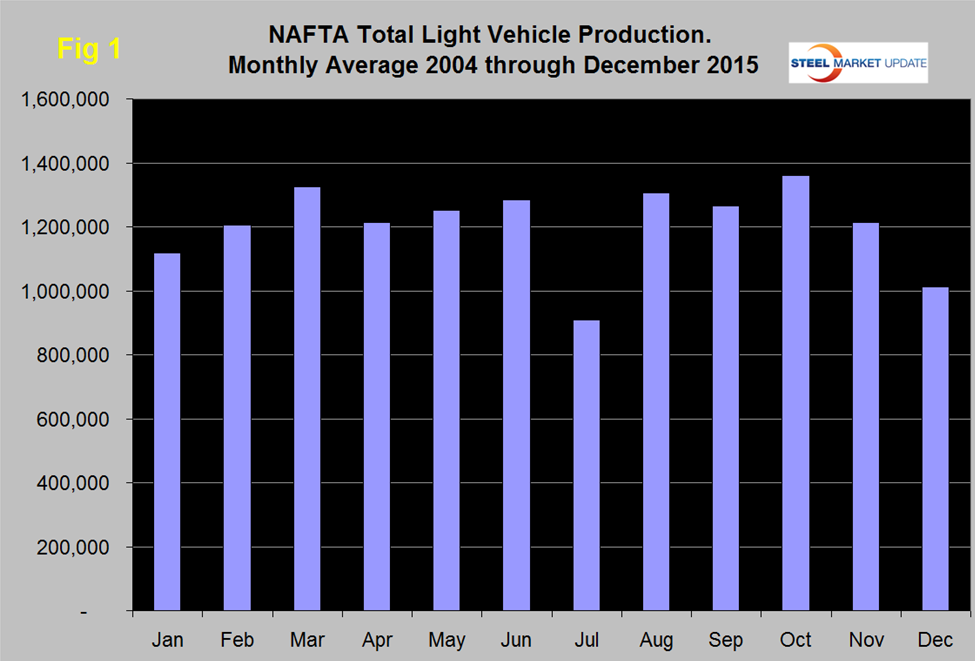
Note that these production numbers are not seasonally adjusted, the sales data reported above are seasonally adjusted. December production was slightly less than December 2014 and both exceeded any other December since our data begins in 1986. History tells us that assemblies will recover in January through March.
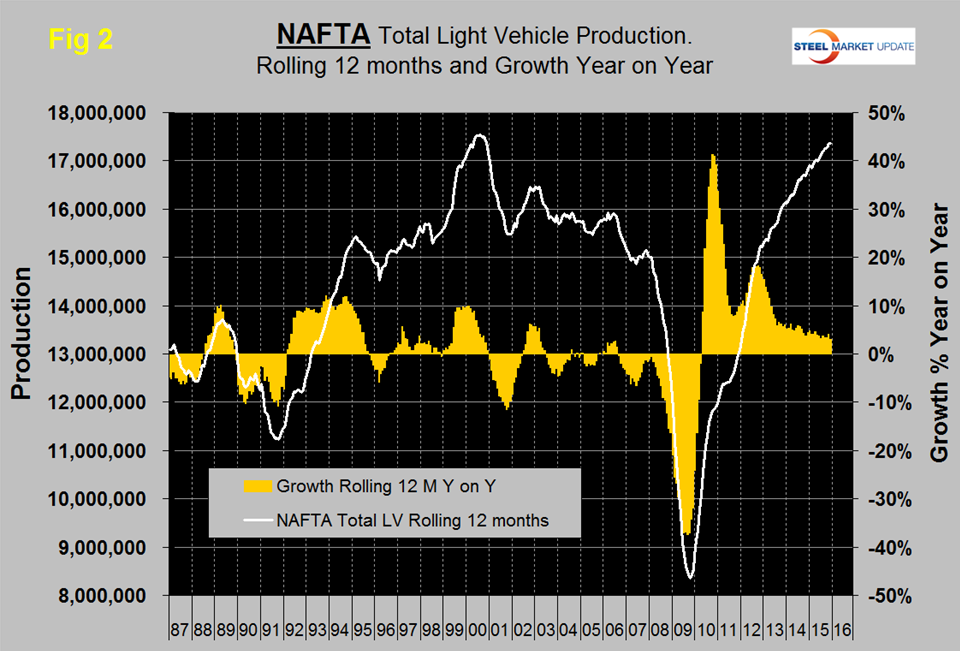
On a rolling 12 months basis y/y through December, LV production in NAFTA increased by 2.9 percent which was down from 4.1 percent in 12 months through November. LV production in NAFTA is now well above the pre-recession peak of Q2 2006 and is heading for the all-time high of mid-2000 (Figure 2).
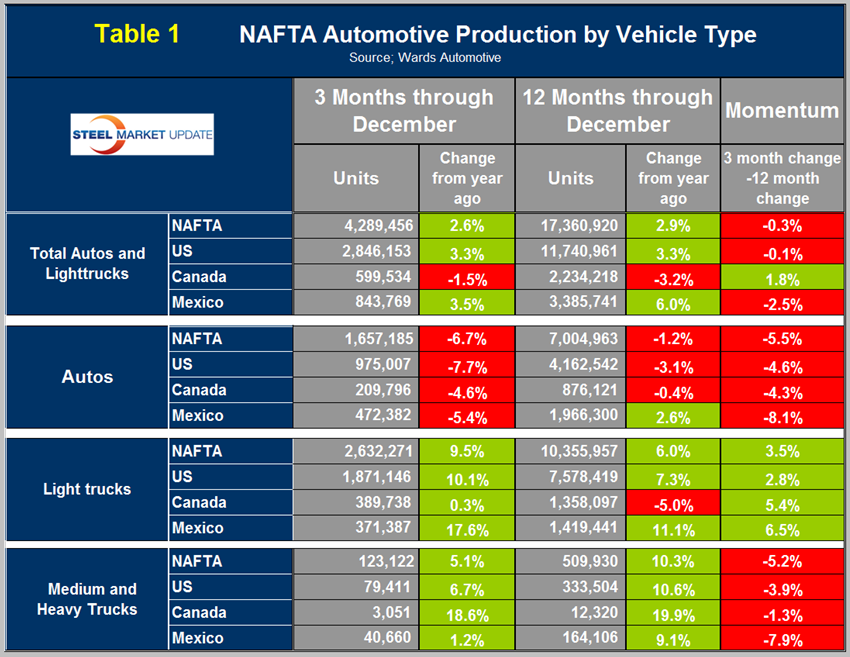
On a rolling 12 months basis y/y the US is up by 3.3 percent with slightly negative momentum, Canada is down by 3.2 percent with positive momentum and Mexico is up by 6.0 percent with negative momentum (Table 1).
Mexico has had negative momentum for eight straight months and in nine of the last ten months. The US has gained production share in the most recent 3.5 years (Figure 3) at the expense of Canada.
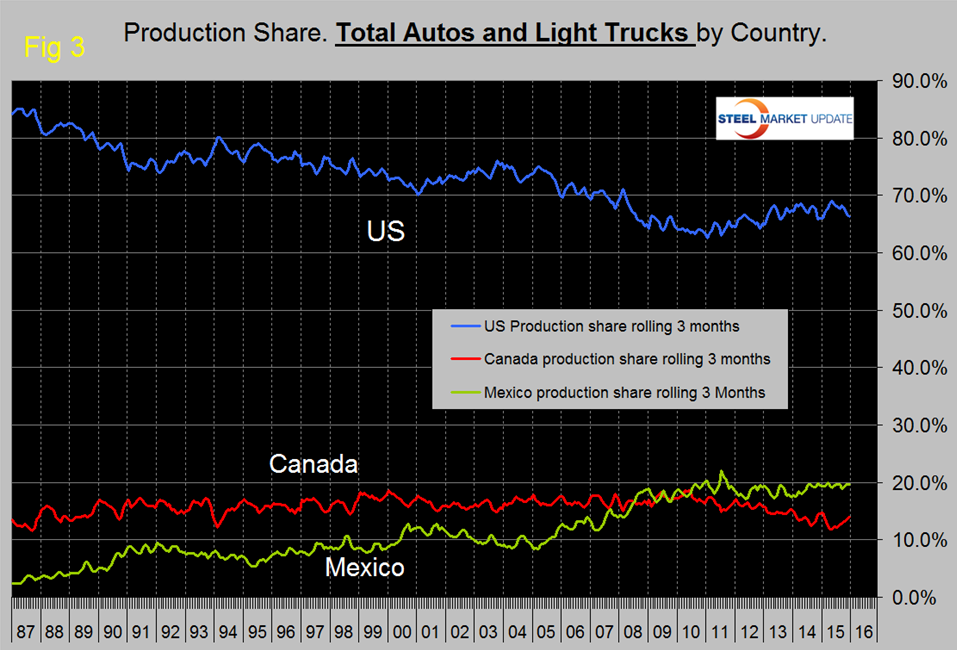
Mexico’s share has been fairly flat for five years. In December on a rolling three month basis, the US production share of total light vehicles was 66.4 percent, Canada’s was 14.0 percent and Mexico’s was 19.7 percent.
Figure 4, Figure 5 and Figure 6 show total LV production by country with y/y growth rates and on each the red line shows the change in production since Q2 2006.
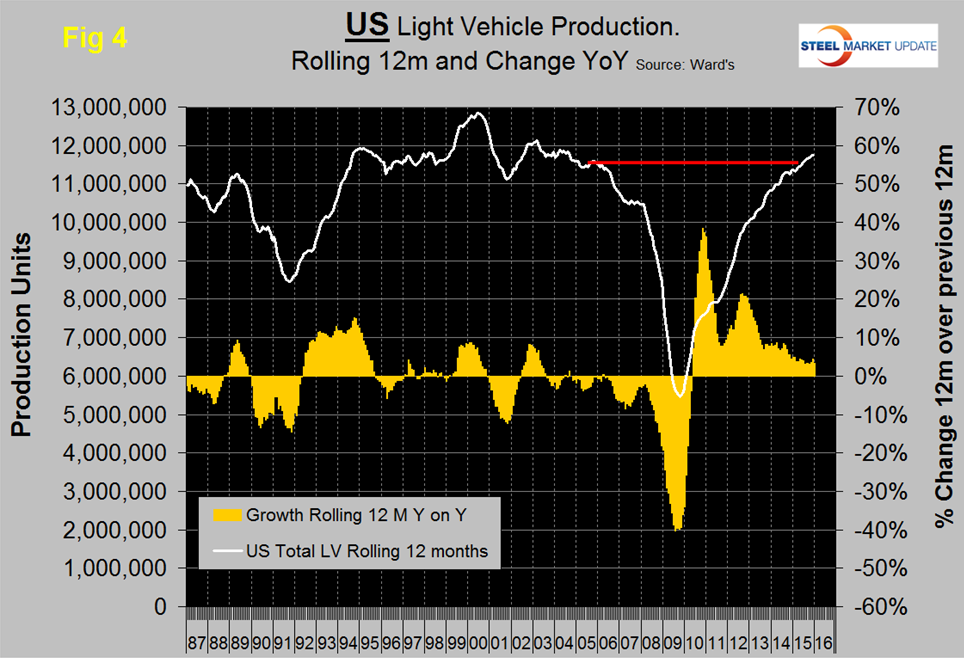
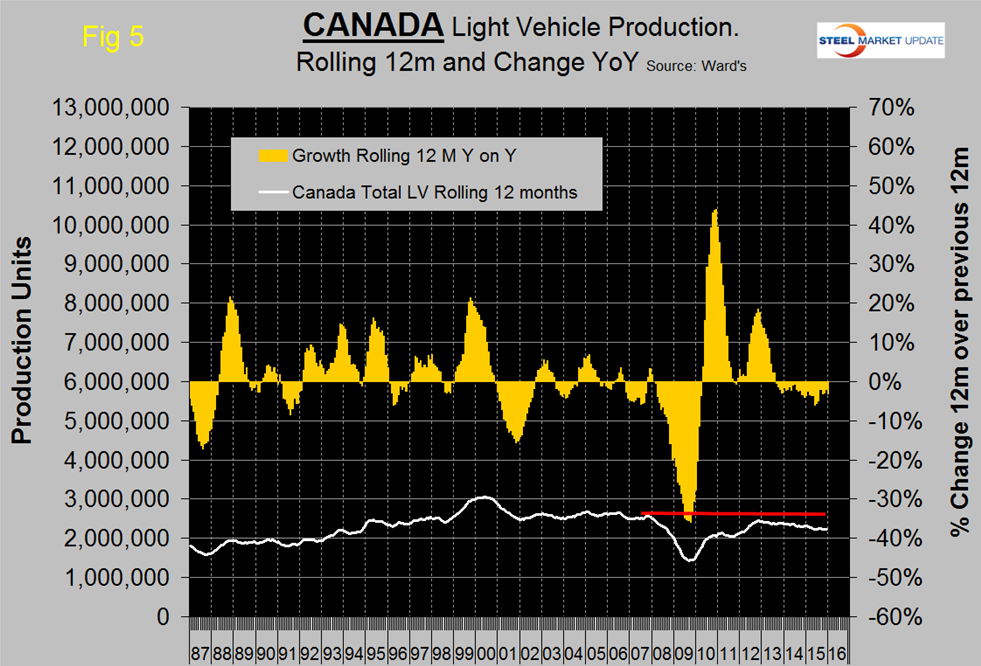
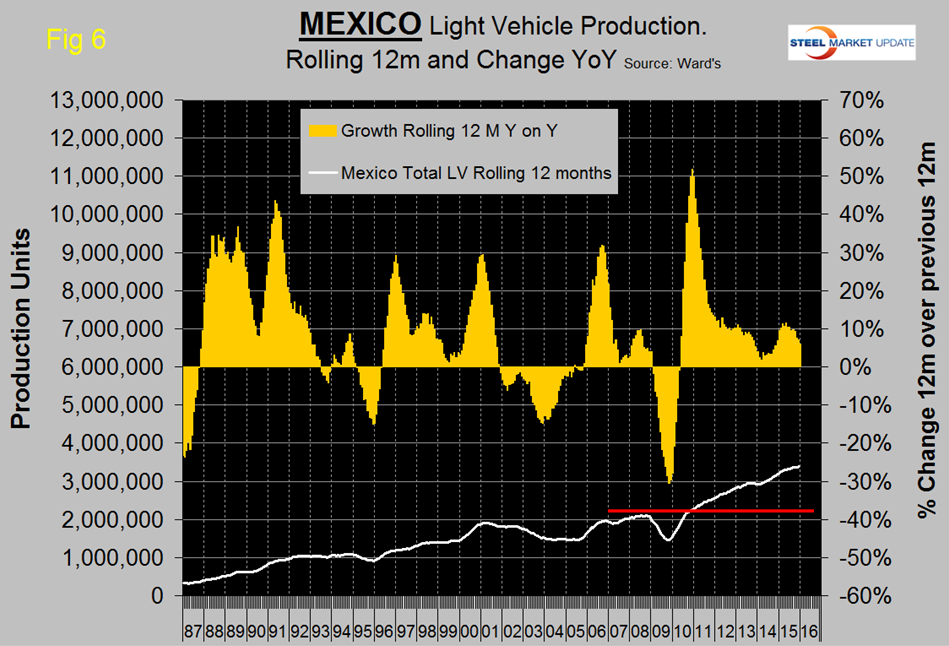
Note that the scales are the same to give true comparability and that Mexican growth has slowed significantly this year but is still higher than in the US. Canada continues to contract. During the recession Mexico declined by less than the US and bounced back by more during the recovery. This caused Mexico’s production share to surge until Mid-2011 at the expense of the US.
The percentage of Autos in the production mix of all three countries is down this year, meaning that light trucks are up. The change for NAFTA as a whole is very significant and is being driven by lower gas prices. In three months through December year over year, autos were down by 6.7 percent and light trucks were up by 9.5 percent. This tends to favor the US and Canada over Mexico because the mix of light vehicles is very different by country (Figure 7).
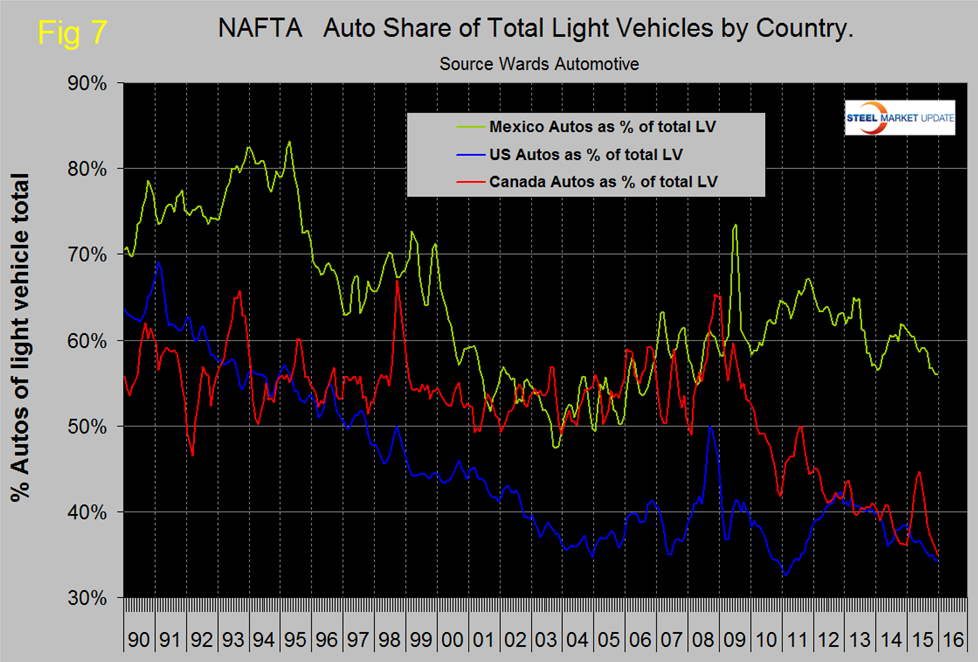
The percentage of autos in the Mexican mix in the last three months was 56.0 percent but only 34.3 in the US and 35.0 percent in Canada. This means that Mexico has staked out a higher relative capacity in autos which will serve it well when gas prices eventually rebound. The light truck component of the US light vehicle mix has been increasing for over three years.
Ward’s Automotive reported this week that total light vehicle inventories in the US decreased by 4 days of sales from 65 at the end of November to 61 at the end of December which was the sane as December 2014. Month over month FCA (Fiat Chrysler Automotive) was down by 4 to 82 days, Ford was down by 2 to 80 and GM down by 8 to 61 days.
SMU Comment: In our last housing report we discussed the possibility of an imminent recession. We have two data streams that have been predictive of past recessions. These are housing starts and truck assemblies. Neither are flashing red at this time. Figure 8 shows medium and heavy truck assemblies in NAFTA on a rolling 12 month basis with recessions superimposed on the time axis.
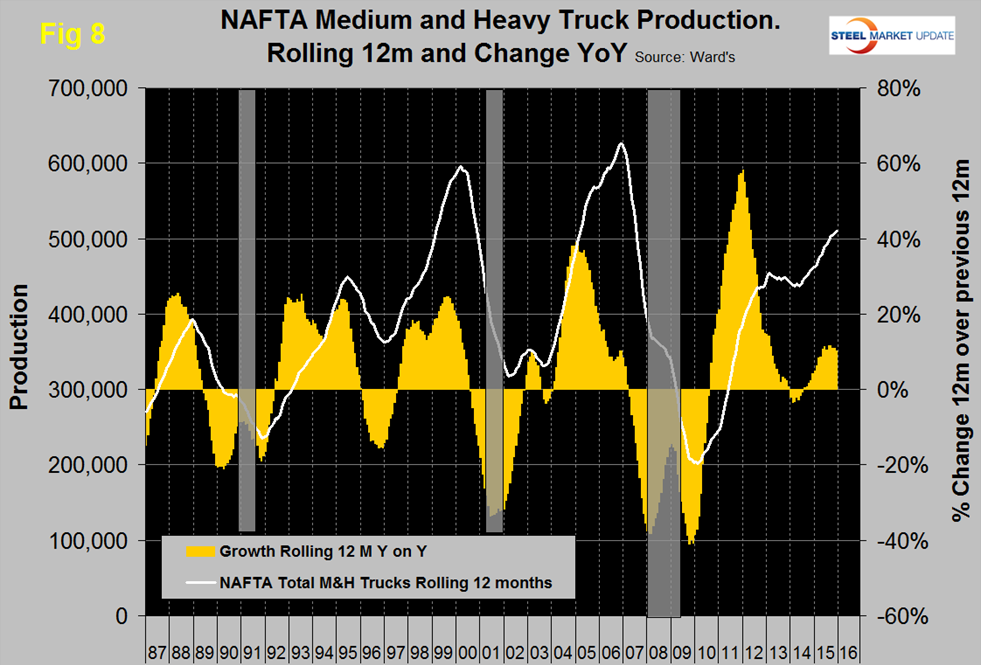
In the last three recessions of 1991, 2001 and 2008, M&HT production began to slow about 18 months before the recession began. There was one false alarm in 1996 when there was a strong consensus that a recession was imminent. At the present time there is no contraction in truck assemblies.
The SMU data file contains more detail than be shown here in this condensed report. Readers can obtain copies of additional time based performance results on request if they wish to dig deeper. Available are graphs of auto, light truck and medium and heavy truck production and growth rate and production share by country.


