Market Data

February 3, 2016
Regional Job Creation in Q4 2015
Written by Peter Wright
The states compile their employment numbers independently of the Feds then both are reported by the Bureau of Labor Statistics. The results are close. In the last eight quarters since Q1 2014, the Feds reported total job creation of 5,766,000 and the states reported 5,415,400. Figure 1 and Figure 2 show the history of Federal and State totals since 1992. SMU has graphs in the same format for 10 geographic regions and can produce for individual states if a reader so requests.
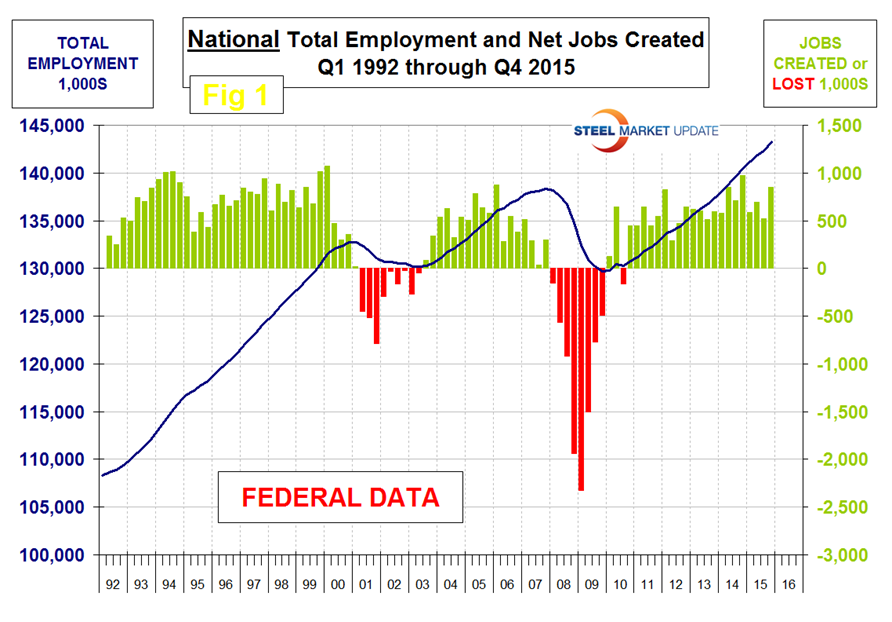
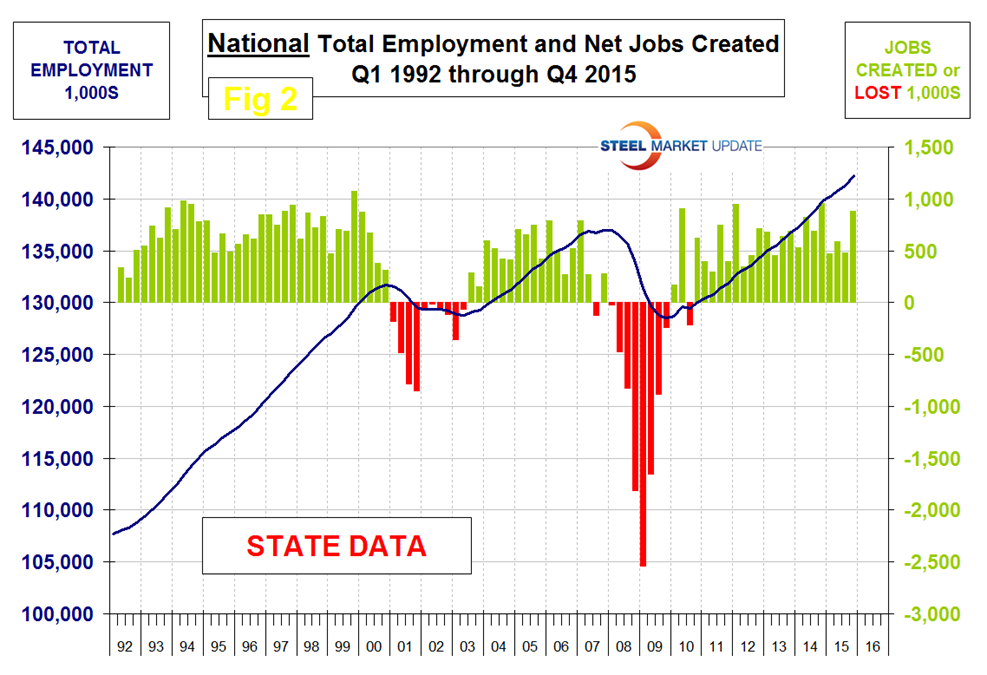
Table 1 shows the history of quarterly job creation by region for the last 5 years.
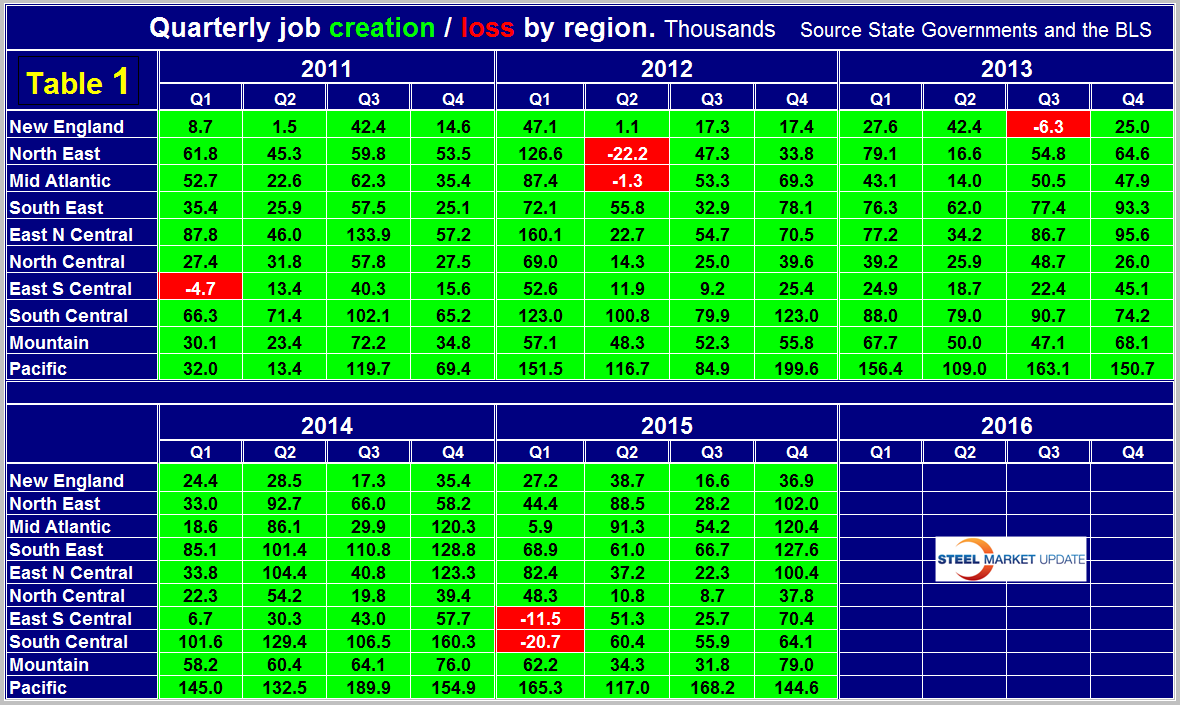
All regions had positive job creation in the 4th quarter. In our last analysis we reported that all regions except the North Central (IA, KS, MN, MO, NE, ND and SD) had positive growth in the 3rd Q. Revisions have resulted in that no longer being the case and all regions had positive growth in each of the last three quarters of 2015. Problems in the oil and gas industries are evident in these regional employment reports. The South Central region (TX, OK, LA and AR) went off a cliff in Q1 2015 after having the highest job creation of any region in the previous quarter. This region rebounded in Q2 through Q4 2015 but is nowhere near where it was before the oil price collapse. In the four quarters since Q4 2014, North Dakota has lost 18,800 jobs, Oklahoma has lost 8,900 jobs but Texas has gained 166,900 jobs. In every quarter of 2015, the Pacific region (CA, OR and WA) has created the most jobs.
The Associated General Contractors of America pull out the construction component of the regional jobs report and had this to say about the latest regional employment report. Forty-four states and the District of Columbia added construction jobs in 2015 while construction employment increased in 39 states and D.C. Association officials said that many of the states experiencing construction declines appear to be energy producing states. “Construction employment expanded in most parts of the country last year as demand for new projects rebounded,” said Stephen E. Sandherr, chief executive officer for the association. “The question now is whether declining energy prices will impact construction employment in a larger part of the country this year.” California added the most (59,300 jobs, 8.6 percent) construction jobs between December 2014 and December 2015. Other states adding a high number of new construction jobs for the past 12 months include Florida (28,500 jobs, 7.0 percent), New York (26,500 jobs, 7.6 percent) and Colorado (11,700 jobs, 7.9 percent). Six states shed construction jobs during the past 12 months. North Dakota (-8.1 percent, -3,000 jobs) lost the highest percent and total number of construction jobs. Other states that lost jobs for the year include West Virginia (-7.1 percent, -2,300 jobs), New Mexico (-3.5 percent, -1,500 jobs), Wyoming (-1.7 percent, -400 jobs), Rhode Island (-0.6 percent, -100 jobs) and Pennsylvania (-0.2 percent, -500 jobs).
The regions have fared very differently since the pre-recession high of 1st Q 2008 and since the low point of 4th Q 2009. There are now 5,238,000 more people employed than there were immediately before the recession but of that number half occurred in the South Central (TX, LA, AR and OK) and Pacific (CA, OR and WA) regions. The 3rd Q of 2015 was the first time that every region had more people employed than it did at the pre-recession peak. This continued through Q4 (Table 2).
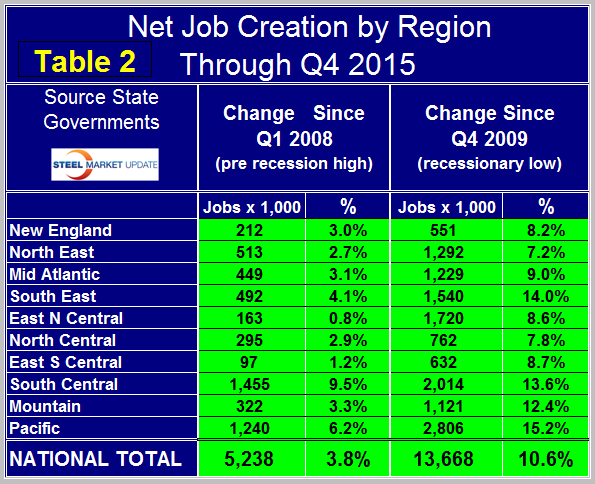
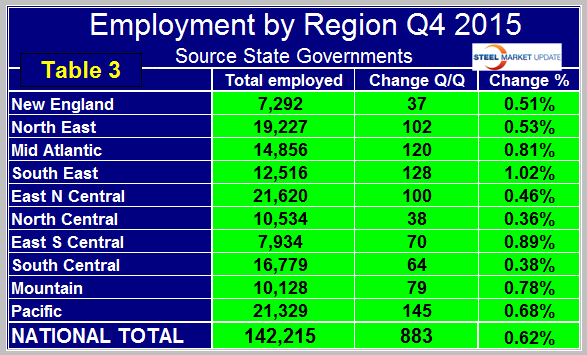
Employment is now 13,668,000 positions higher than it was at the low point of the recession. The Pacific has had the largest number of jobs created during the recovery with an increase of 2,806,000 positions which amounts to 15.2 percent of total employment. The South Central is in 2nd place with 2,014,000 jobs created which is 13.6 percent of total employment. The East North Central (IL, IN, MI, OH and WI) currently has the highest number of employed people with 21,620,000, closely followed by the Pacific with 21,329,500 (Table 3).
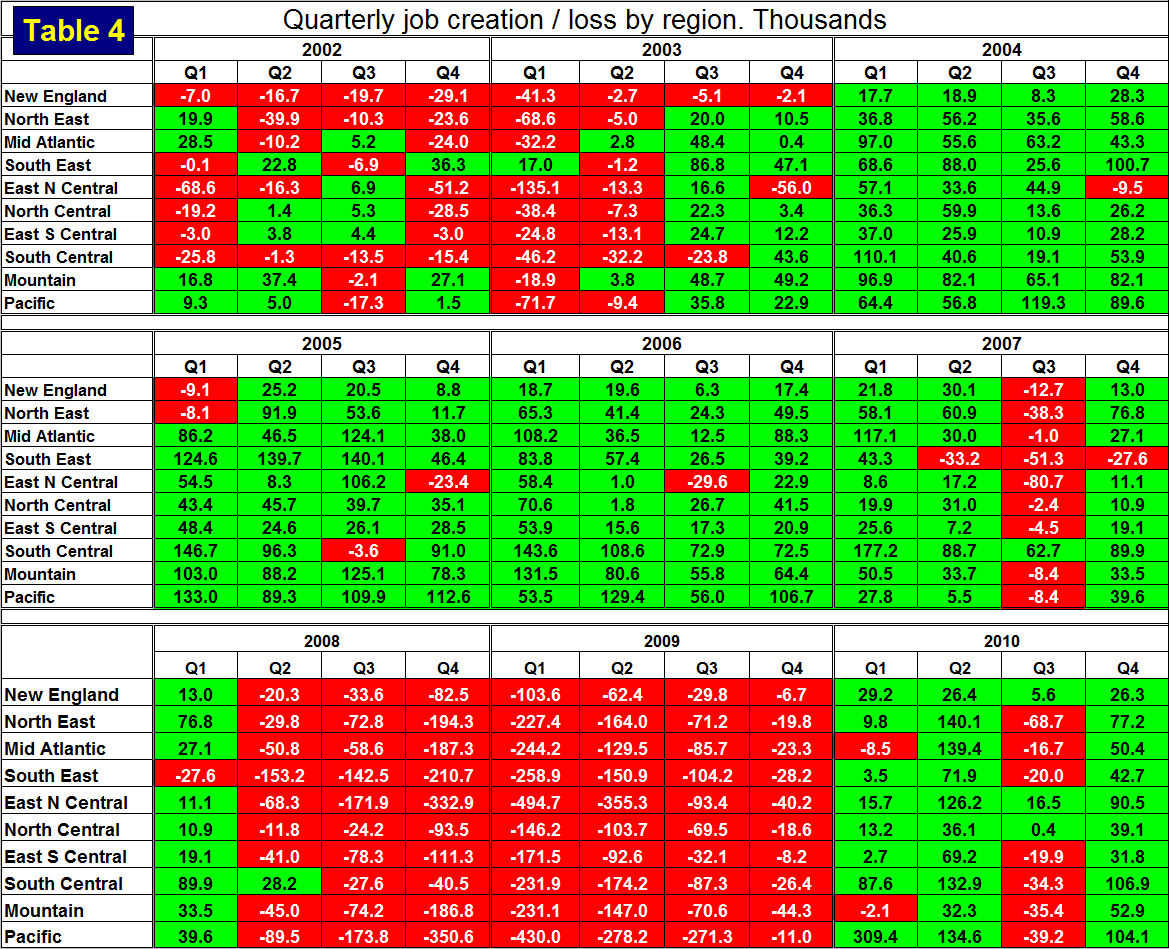
SMU Comment: We thought we would remind readers what recessions look like and have included Table 4 here which is the same as Table 1 but for the years 2002 through 2010. This makes the recent job creation performance look excellent and as we have stated in our housing and auto production reports in the last few days, “we think the reports of an impending recession that are now cropping up in the press are greatly exaggerated.”