

Market Data

February 5, 2016
Net Job Creation by Industry through January 2016
Written by Peter Wright
The Bureau of Labor Statistics (BLS) reported on Friday in their analysis of non-farm employment that 151,000 jobs were added in January, down from 262,000 in December. According to the Wall Street Breakfast, “consensus had called for 190,000 jobs to be added, with the unemployment rate holding steady at 5 percent. Traders in interest rate markets have essentially priced out the chance of a rate hike in 2016 and the 10-year Treasury yield has fallen all the way to 1.85 percent, so a strong jobs number could make things interesting in fixed-income.” This didn’t happen.
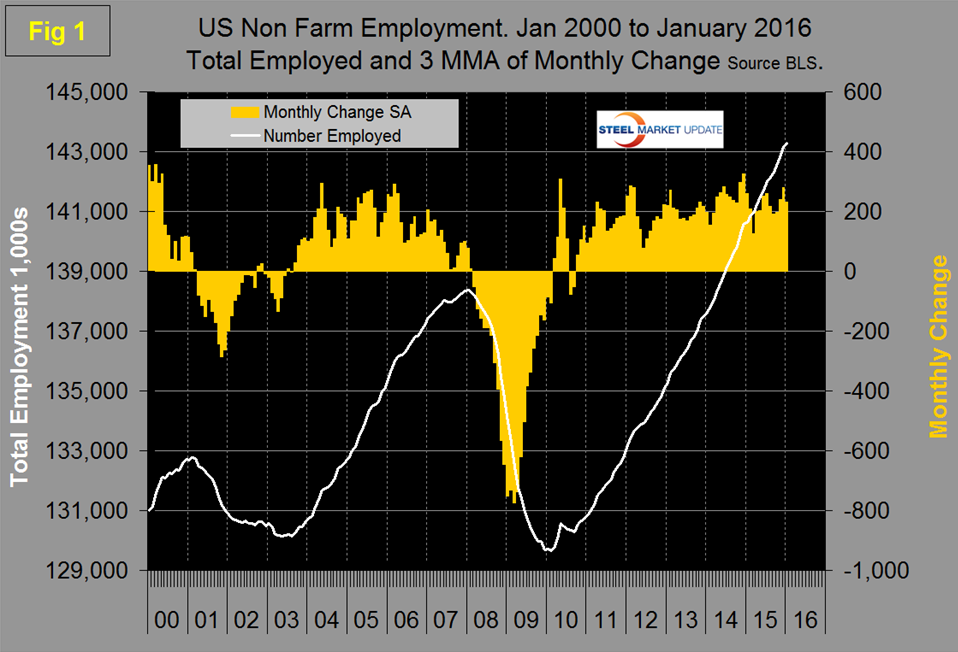
![]() December was revised down by 30,000 and November up by 28,000. Employment growth was revised way back this month. We took our numbers back to January 2008 and revisions still continued further back in time. We figured that for our purposes our 2008 revision was sufficient. For 2015 as a whole total nonfarm employment was revised up by 85,000. The three month moving (3MMA) of gains through January was 231,000. The unemployment rate, U3, calculated from a different survey, declined to 4.9 percent from 5.0 percent in December. Monthly job gains have averaged 207,000 per month in the thirteen months since and including January 2015 (Figure 1).
December was revised down by 30,000 and November up by 28,000. Employment growth was revised way back this month. We took our numbers back to January 2008 and revisions still continued further back in time. We figured that for our purposes our 2008 revision was sufficient. For 2015 as a whole total nonfarm employment was revised up by 85,000. The three month moving (3MMA) of gains through January was 231,000. The unemployment rate, U3, calculated from a different survey, declined to 4.9 percent from 5.0 percent in December. Monthly job gains have averaged 207,000 per month in the thirteen months since and including January 2015 (Figure 1).
These numbers are seasonally adjusted by the BLS so to examine if any seasonality is left in the data after adjustment we have developed Figure 2 which suggests that the adjustment is far from perfect.
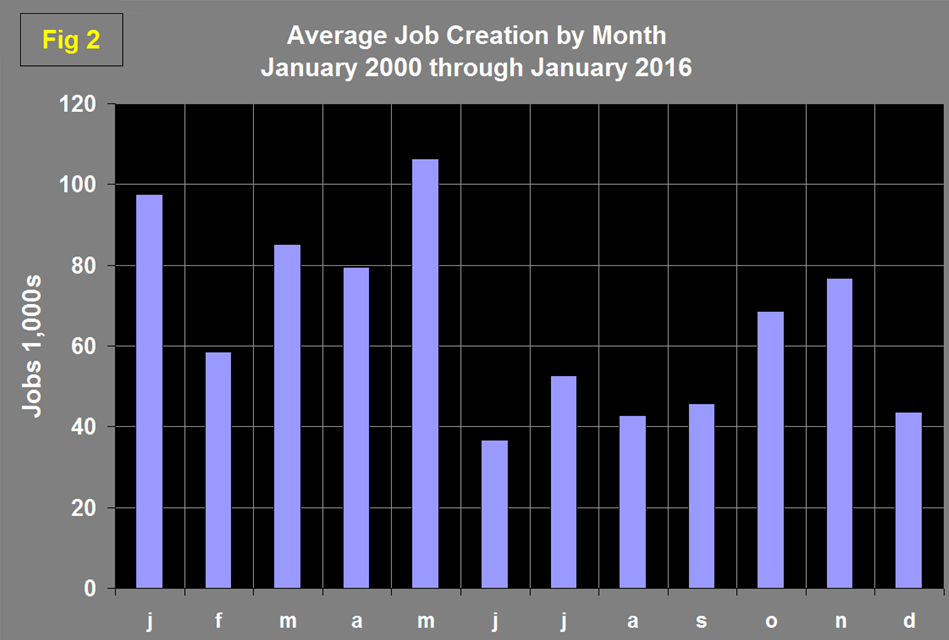
In 16 years the average gain from November to December was negative 32 percent, last year the change was positive 16 percent. This rolled over into January where the 17 year average job gain was positive but this year job gains were down by 42 percent. Moody’s Analytics believes that this was due to very mild December weather in the northern US. Moody’s went on to comment that, “the much watched average hourly earnings were expected to strengthen in January following the weakness, caused by technical reasons, in December. This was borne out. Average hourly earnings for all workers rose by 2.5 percent year over year and by 0.47 percent month over month. In addition to technical reasons, earnings have been accelerating slowly over the past year and reflect a labor market approaching full employment.” Total nonfarm payrolls are now 4,923,000 more than they were at the pre-recession high of January 2008.
Table 1 slices total employment into service and goods producing industries and then into private and government employees.
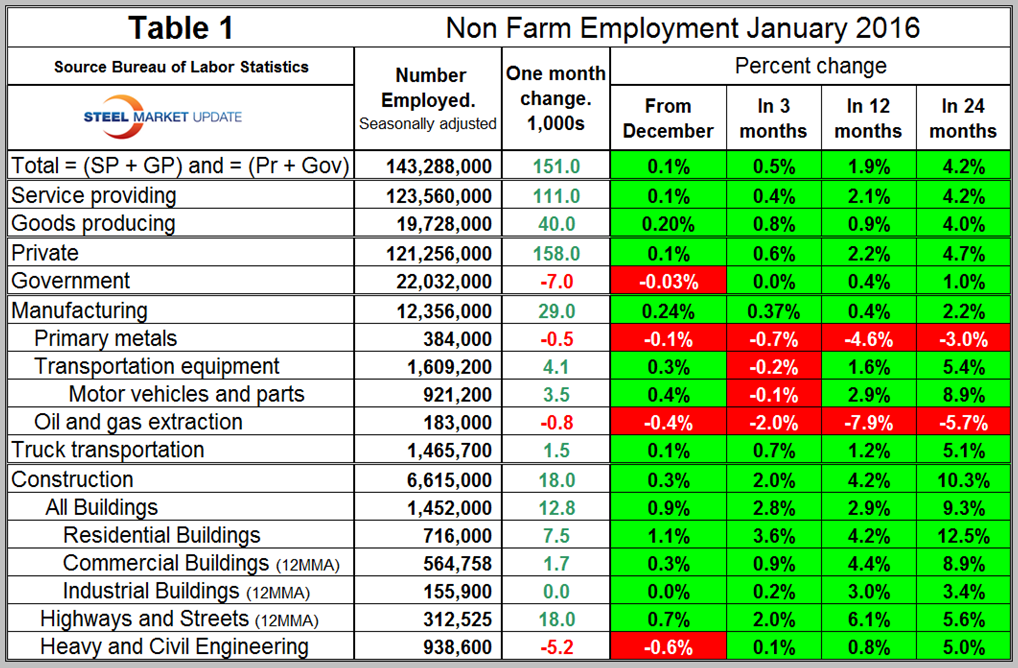
Total employment equals the sum of private and government employees. It also equals the sum of goods producing and service employees. Most of the goods producing employees work in manufacturing and construction and the major components of these two sectors are also shown in Table 1. In January, 158,000 jobs were created in the private sector and 7,000 lost in government. The Federal government and state governments lost 8,000 and 10,000 respectively as local governments added 11,000. Since February 2010, the employment low point, private employers have added 13,999,000 jobs as government has shed 444,000. In January service industries expanded by 111,000 as goods producing industries added 40,000 people. Since February 2010, service industries have added 11,454,000 and goods producing 2,101,000 positions. The big surprise in January was that manufacturing gained 29,000 jobs, the best performance since August 2013. In all of 2015, manufacturing added only 46,000 jobs which puts the January result into perspective. Note the subcomponents of both manufacturing and construction shown in Table 1 don’t add up to the total because we have only included those that have most relevance to the steel industry. Primary metals lost 500 jobs in January which was an improvement in the rate of job losses that have occurred in the last two years, there was only one month of job gains in 2015 and that was just 400 in June. The sector lost 23,000 jobs in 2015. Motor vehicles and parts gained 3,500 jobs in January, oil and gas extraction has had negative job creation in all four time periods examined in Table 1. Truck transportation gained 1,500 jobs in January and is up by 1.2 percent in 12 months. Construction added 18,000 jobs in January for a total of 314,000 in the 13 months since and including January 2015. Some of the major construction sub categories are routinely reported one month in arrears which distorts the data in Table 1. These include, industrial buildings, commercial buildings and highways and streets. Construction has moved ahead of manufacturing as a job creator but it must be recognized that productivity increases in manufacturing are very much greater than they are in construction. Construction has added 1,115,000 jobs and manufacturing 903,000 since the recessionary employment low point in February 2010 (Figure 3).
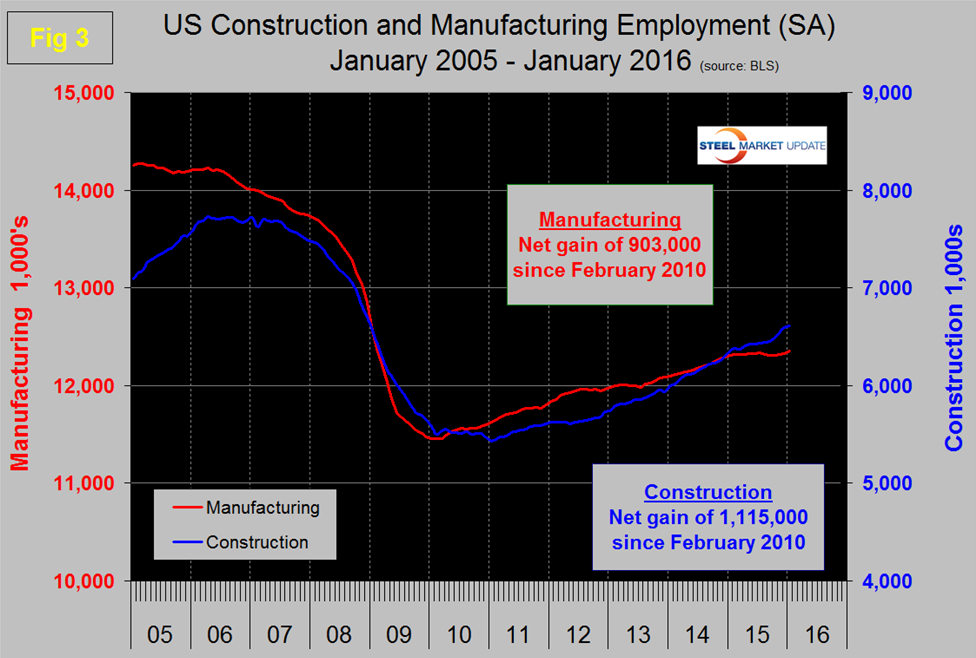
Based on the total construction analysis that we report in our CPIP update, we assume that construction jobs will continue to expand vigorously.
The Associated General Contractors of America had this to say about the January result; “Construction employment totaled 6,615,000 in January, the most since December 2008, and is up by 264,000 jobs compared to a year ago, a 4.2 percent increase. Residential construction increased by 20,100 in January and by 149,500, or 6.2 percent, compared to a year ago. Nonresidential construction employment declined by 2,300 jobs for the month but was up 115,000 jobs compared to last January, a 2.9 percent increase. Association officials said they were encouraged by the fact the industry continues to expand at a brisk annual clip. They noted that the 4.2 percent increase in construction employment in the past 12 months was more than double the 1.9 percent growth in total nonfarm payroll employment. But they added that the drop in nonresidential construction employment for the month was cause for concern. After several months of robust construction employment growth, they cautioned that January’s market sell-offs and broader economic uncertainty may sap demand for construction.”
The official unemployment rate known as U3, has decreased from 5.5 percent in May to 5.0 percent in October and to 4.9 percent in January. This number doesn’t take into consideration those who have stopped looking. The more comprehensive U6 unemployment rate decreased from 11.3 percent in January 2015 to 9.9 percent in January 2016 (Figure 4).
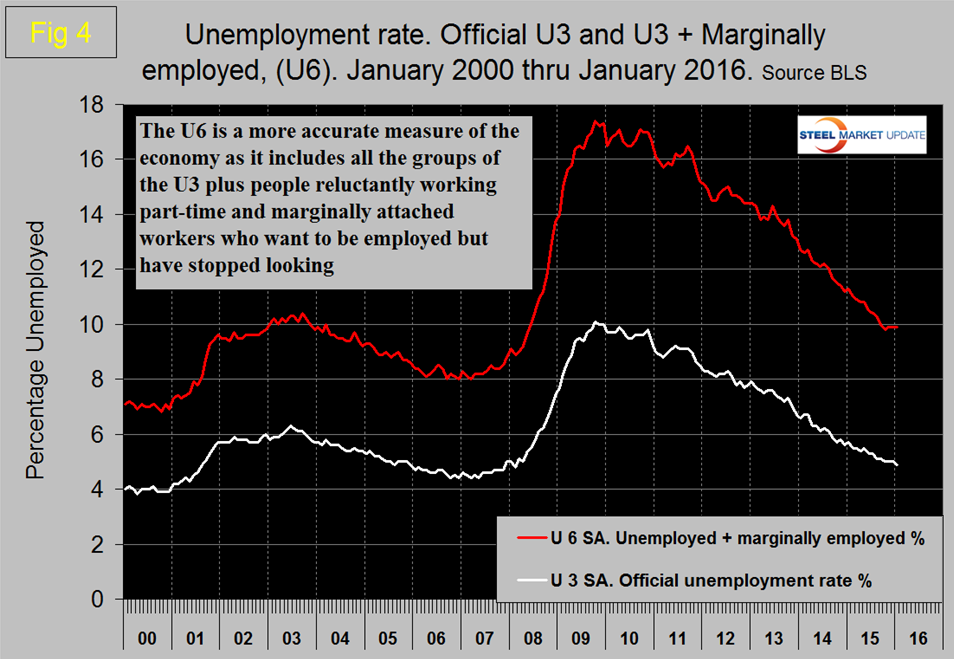
U6 includes workers working part time who desire full time work and people who want to work but are so discouraged that they have stopped looking. The differential between these rates was usually less than 4 percent before the recession but is still 5.0 percent. The good news is that the gap is slowly closing.
Since and including January 2015 there has been an increase of 3,207,000 full time and a decrease of 142,000 part time jobs. Figure 5 shows the rolling 12 month total change in both part time and full time employment.
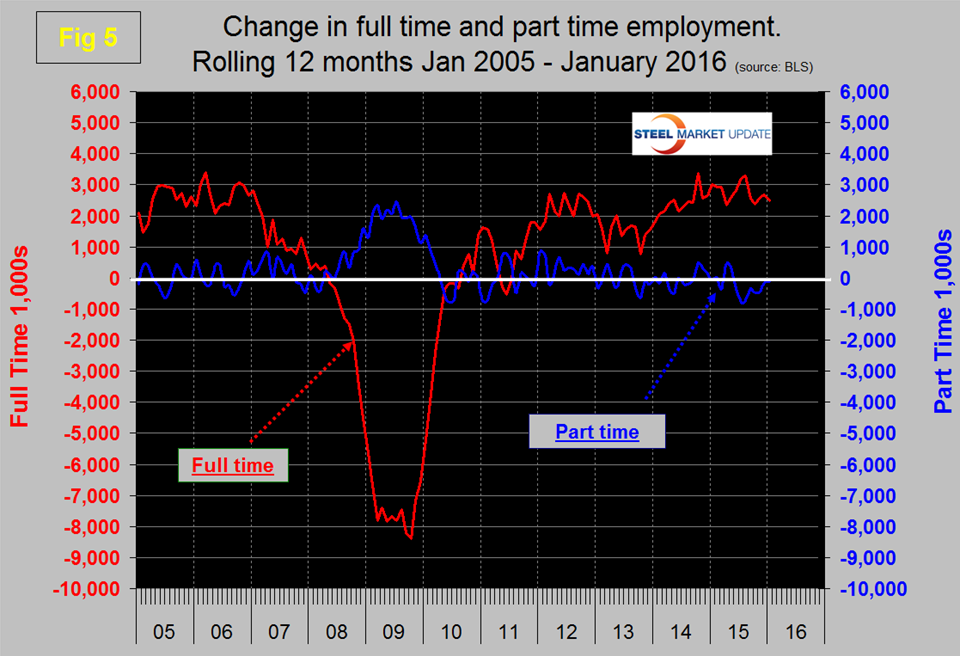
Frequently in the press we read that a large part of job creation is in part time employment. This is not the case but because the part-time numbers are extremely volatile we have to look at longer time periods than a month or even a quarter to get the picture.
The job openings report known as JOLTS is reported on about the 10th of the month by the Federal Reserve and is over a month in arrears. Figure 6 shows the history of unfilled job openings which have skyrocketed in the last two years to levels not seen since the data series was initiated in 2000.
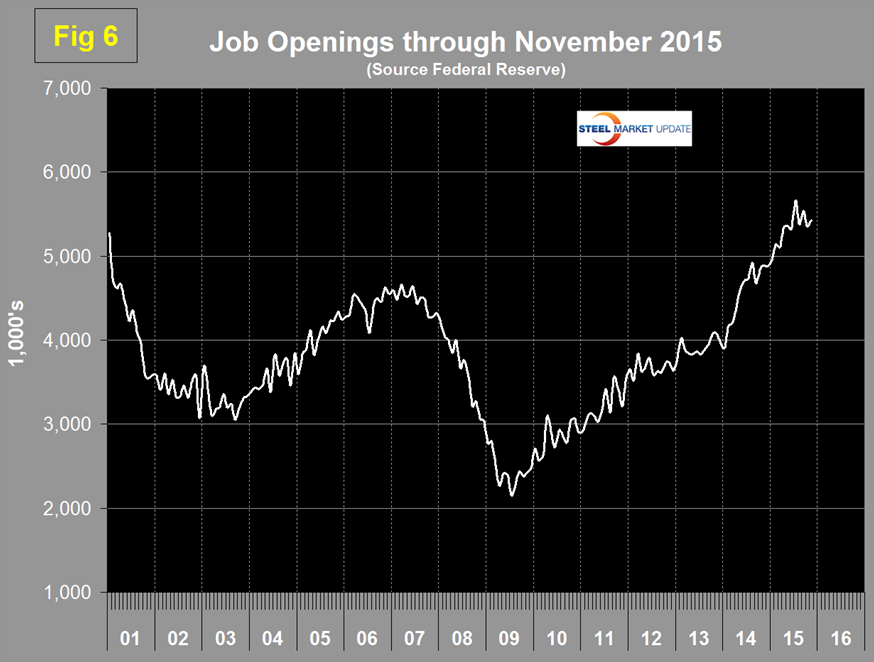
The previous high was 5.25 million at the end of 2000; in the last two years we have seen a surge from 3.906 million in January 2014 to 5.431 million in the latest report for November 2015.
SMU Comment: By all accounts manufacturing is slowing therefore this jobs report is both surprising and encouraging. Stay tuned! Construction has been holding steel consumption back but both the employment numbers and Construction Put in Place data from the Commerce Department suggest that this drag should rapidly disappear. Unfortunately the AISI weekly steel production numbers are moving in the opposite direction with a capacity utilization below 70 percent every week from October 24th through January 23rd. Steel production is not where it should be based on our benchmark indicators. We assume that inventory reduction throughout the supply chain is the cause and the inventory data embedded in the latest GDP result for Q4 2015 supports this view.


