

Market Data

February 14, 2016
China’s Economic Statistics Q4 2015
Written by Peter Wright
Figure 1 shows published data for the growth of Chinese GDP, industrial production and consumer prices through the fourth quarter of 2015.
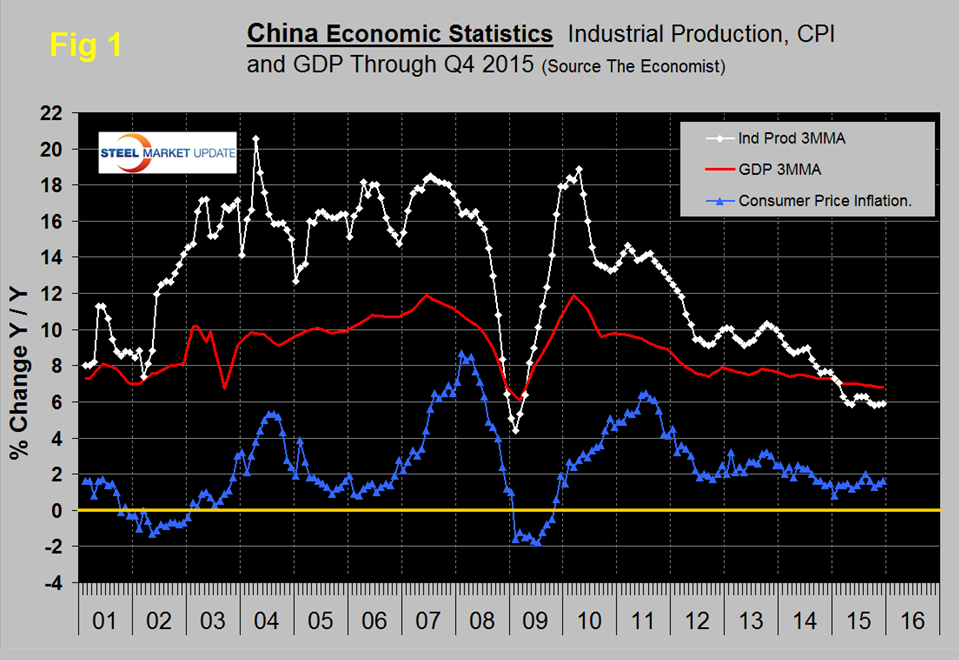
The GDP and industrial production portions of this graph are three month moving averages. The growth of GDP was 6.8 percent in the 4th quarter, and decelerating to its slowest pace since the global financial crisis. The growth rate of GDP has declined steadily since it peaked at 11.9 percent in Q1 2010.
The IMF had this to say in London last week:
Capital Markets Outlook
Opening Keynote Address by José Viñals. Financial Counsellor and Director of the Monetary and Capital Markets Department, IMF. London, February 10, 2016
A third shift is taking place in China. As the second largest economy in the world, China plays an important role in driving global growth and increasingly in global financial markets. Growth in China is holding up even as the economy undergoes an important rebalancing: growth last year was 6.9 percent and is projected at 6.3 percent in 2016. We do not believe that China is facing a hard landing, and recent data continue to bear this view out. But the country is facing major policy challenges as it transitions to a growth model driven increasingly by consumption and services, rather than public investment and exports. Financial and corporate sector vulnerabilities have been rising—total credit to nonfinancial corporates rose from 124 percent of GDP in 2011 to 163 percent of GDP in mid-2015. These will need to be addressed as the economy is transitioning toward a more market-based financial system that discourages the buildup of new imbalances. The internationalization of the renminbi and greater financial integration with global markets represents an important step forward not only for China but for the international monetary system. This transition may become bumpy at times, but a strong commitment to reform and effective implementation with clear communication are essential.
The growth of industrial production in December was 5.9 percent and the 3MMA was also 5.9 percent as shown in Figure 1. The growth rate of IP has been declining erratically since the second quarter of 2010. Overcapacity in heavy industry sectors such as steel and coal continued to be excessive. The government’s ongoing program to re-balance the economy in favor of domestic consumption is continuing and this will slow the absorption of the excess steel capacity that has been put in place during the last decade.
Consumer price inflation has been oscillating between 1.4 percent and 2.0 percent since January and in December came in at 1.6 percent, down from 2.0 percent in August. Food prices dropped sharply. Nonfood inflation remains low, because of falling energy costs and demand expanding either below or close to supply across most product categories.
Figure 2 shows the growth of fixed asset investment y/y.
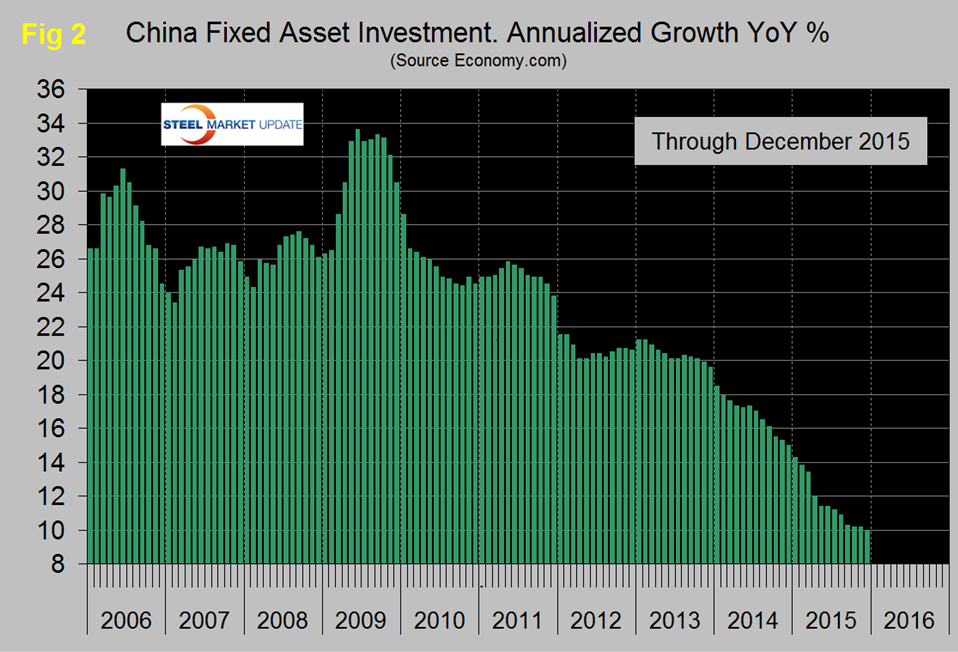
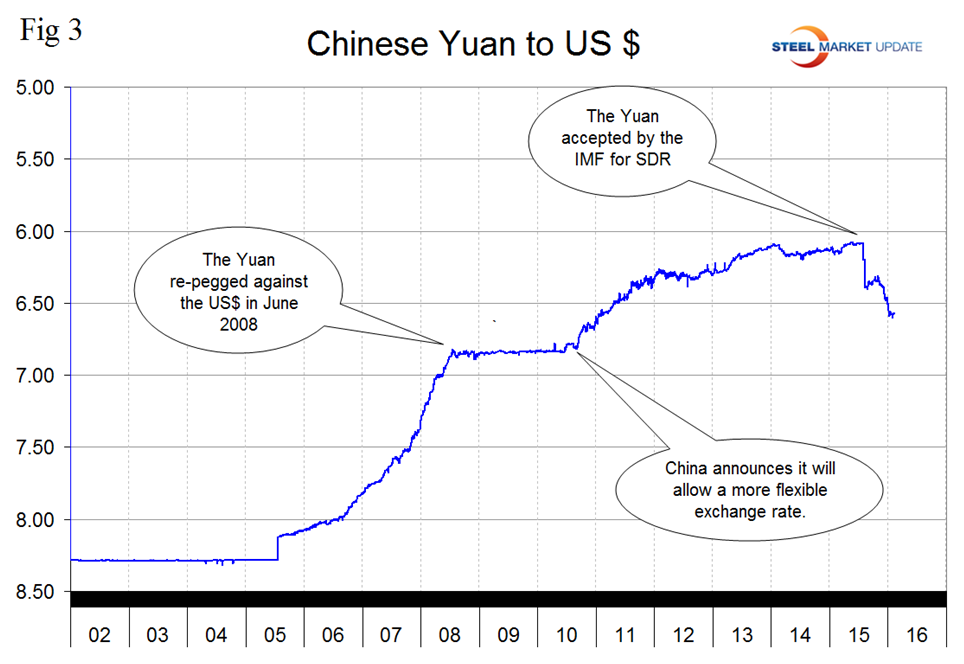
The decline experienced in 2013 accelerated through all of 2014 and through August of 2015. At 10.0 percent in December the growth rate was the lowest since our data begins in 2001. We understand that this data includes real-estate purchases so is not a direct reflection of constructional steel demand. We are assuming that the steel on the ground portion of this data follows the overall trend and that the contraction in FAI is in accordance with the stated objective to rebalance the economy in favor of consumer consumption. Weaker investment in fixed assets is contributing to slower demand across a number of industries including steel and is pressuring corporate profits. Policymakers have tried to soften the landing through interest rate cuts and depreciation of the Yuan but there’s little evidence that this is having the desired effect. Further rate cuts could be on the way later this year. In addition, the slowdown in the global economy will hurt investment in manufacturing. Figure 3 shows the number of Yuan that it took to buy one US $ through February 13th. The Yuan das depreciated by 6.7 percent since its peak on June 22nd last year.
SMU Comment: It strikes us at SMU that all the talk about China re-balancing their economy in favor of consumption is very misleading by suggesting that this change is imminent. More likely this will take a generation to accomplish and in the meantime the world is saddled with massive overcapacity in steel production. We estimate that global steel overcapacity is now about 460 million tonnes per year and of that a high proportion is in China. In the 12 months of 2015, China produced 800.5 million tonnes, down by 2.4 percent from 819.9 million in 2014. China is now pushing more than the total of US steel production onto the world market.


