Market Data

February 19, 2016
Industrial Production and Manufacturing Capacity Utilization
Written by Peter Wright
Both these data points are reported in the Federal Reserve G17 data base. The index had an all-time high of 107.9108 in December 2014 but on a month over month basis has declined for nine of the last thirteen months. January was a welcome respite with an increase of 0.92 percent, which is huge, and the largest increase since May 2010. Unfortunately, when we look at the three month moving average (3MMA) and consider year over year changes a completely different picture emerges. The 3MMA has declined for four consecutive months and on a year over year basis the 3MMA became negative in December and January for the first time since February 2010. The January year over year decline was 1.24 percent (Figure 1).
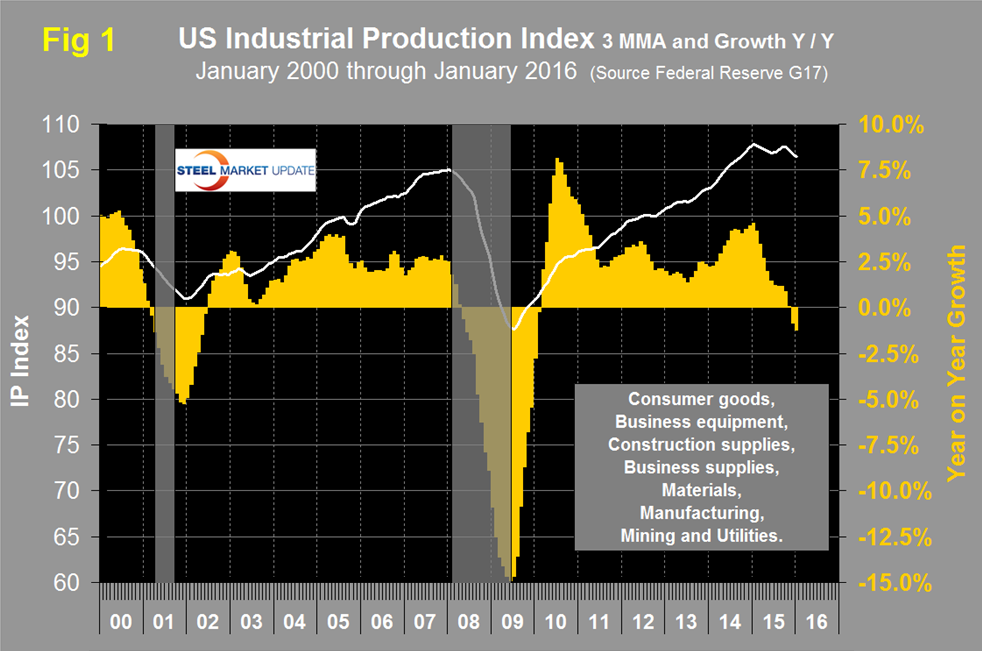
Data is seasonally adjusted and the index is based on the May 2012 level being defined as 100. This month we superimposed the last two recessions on Figure 1 to see if IP is a leading indicator of economic contraction. The 2001 recession occurred in Q2 and Q3 of that year and a y/y decline in IP did lead that recession. However it did not lead the great recession which lasted from Q1 2008 through Q2 2009.
The Federal Reserve summary for the January data reads as follows: “Industrial production increased 0.9 percent in January after decreasing 0.7 percent in December. A storm late in the month likely held down production in January by a small amount. The index for utilities jumped 5.4 percent; demand for heating moved up markedly after having been suppressed by unseasonably warm weather in December. Manufacturing output increased 0.5 percent in January and was 1.2 percent above its year-earlier level. Mining production was unchanged following four months with declines that averaged about 1 1/2 percent per month. At 106.8 percent of its 2012 average, total industrial production in January was 0.7 percent below its year-earlier level.”
Manufacturing Alliance for Productivity and Innovation (MAPI) had this to say in their February 17th blog entry (note they differentiate between industrial production and manufacturing production which is a bit confusing): “The Federal Reserve reports that industrial production rose 0.9 percent in January following a 0.7 percent decline in December. While this sounds erratic, the industrial makeup is important. Manufacturing production posted 0.5 percent growth in January after declining 0.2 percent in each of the previous two months. Weather drives utility production—utility production increased 5.4 percent in January because of exceptionally cold temperatures but there were severe declines of 2.9 percent and 3.7 percent in December and November, respectively, when the weather was mild. Mining production was flat in January. The January report shows that the manufacturing sector is able to grow amid the turmoil in emerging economies and the energy market collapse. January manufacturing production was up in 9 of the 20 major manufacturing industries. The strongest growth occurred in large industries such as chemicals, motor vehicles and parts, and food. The major driver of manufacturing growth is consumer spending for basics and durable goods. Consumers are expanding their purchases of motor vehicles, which benefits the automotive supply chain and the population is forming new households at a faster rate, which propels the robust housing market. The improvement in residential construction drives community development in the form of commercial construction. Infrastructure needs have led to a modest pace of public works construction expansion. The steep decline in metal and agricultural commodity prices and plunging oil prices are a major depressing force that affects machinery and metals, as well as many other industries to a lesser extent. The reversal of the previous energy boom is particularly painful for the many manufacturing industries that targeted energy as a growth business. A strong and appreciating dollar is another major headwind in the manufacturing sector. The fear and risk aversion from the growth slowdown in emerging markets is pushing up the value of the dollar, to the detriment of trade in U.S. manufactured goods. We expect to see many ups and downs in manufacturing production this year. Manufacturing production is expected to grow only a modest 1.1 percent in 2016, which is slower than the 2.2 percent growth expected in the economy as a whole.”
Manufacturing capacity utilization was 76.07 percent in January with a 3MMA of 75.95 percent (Figure 2).
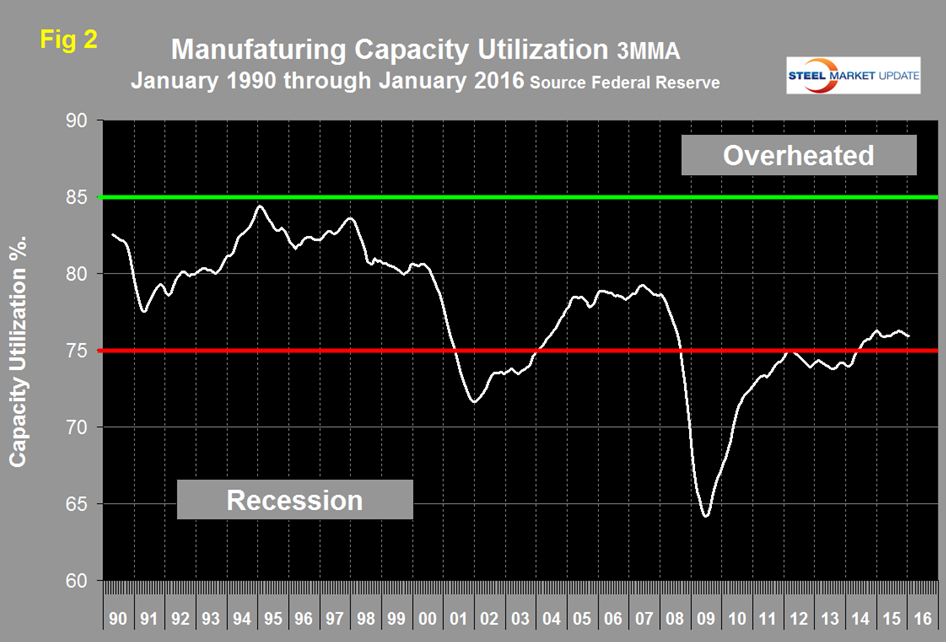
There was a recent peak of 76.26 percent in the 3MMA in September followed through January by four consecutive months of decline.
Regarding the January result the Fed had this to say: “Capacity utilization for the industrial sector increased 0.7 percentage point in January to 77.1 percent, a rate that is 2.9 percentage points below its long-run (1972–2015) average.”
SMU Comment: This IP report is another example of how a completely different picture emerges depending on how we look at the data. At first glance month over month January was great but when we look at a 3MMA and compare it year over year it was anything but. It could be that the January surge is a harbinger of things to come but it is too soon to jump to that conclusion and certainly the year over year result suggests otherwise. The IP data is similar to the ISM Manufacturing Index which contracted in each of the three months November through January. Figure 3 shows the ISM manufacturing index since January 1997.
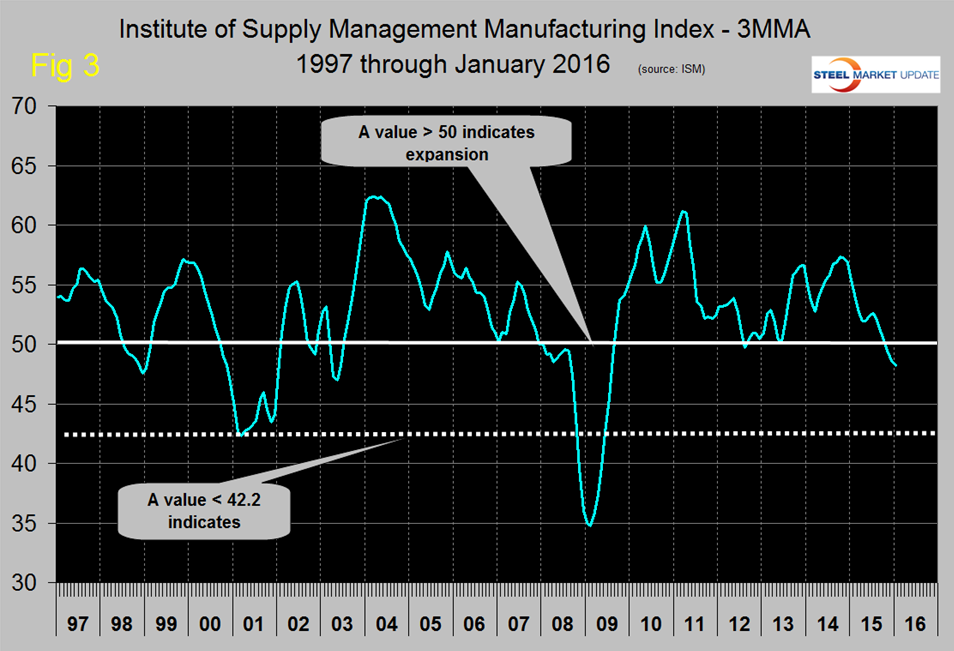
Any value >50 indicates expansion. At SMU we try to examine two or three measures of the same activity as a reality check and on this basis we have to say that the manufacturing employment numbers that we have previously published tell a different story. The number of people employed in manufacturing increased in both December and January. Therefore, in this case the bad news is limited to two out of three indicators which, fortunately, is not a signal to batten down the hatches.