

Prices

February 21, 2016
Global steel production and capacity utilization, January 2016
Written by Peter Wright
Source World Steel Association with Analysis by SMU.
Global steel production in the 12 months of 2015 totaled 1.595 billion tonnes with a capacity of 2.33 billion tonnes. The WSA has made no downward revision to capacity as production fell in the course of 2015 making capacity utilization look increasingly dismal. Production in the month of January was 127,840,000 tonnes, up from 126,404,000 in December. On a tons per day basis production was 4.124 million tonnes and down from 2015’s high point of 4.518 in April. If we look at the three month moving average and plot it over time we see that there has been a significant decline in the second half of the year since and including 2010 which usually extends into February of the next year, after which production kicks up rapidly (Figure 1).
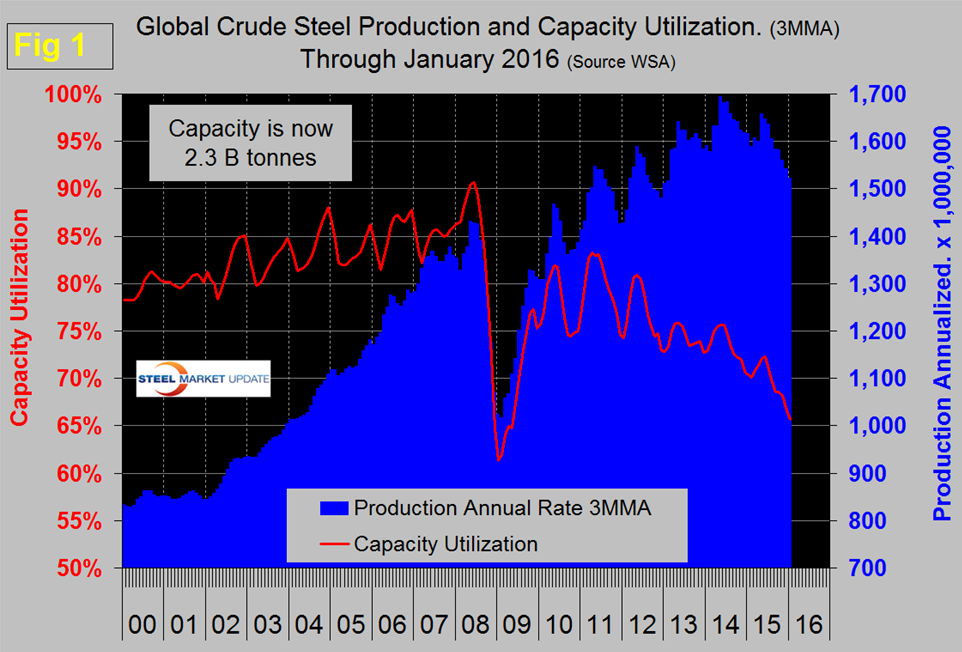
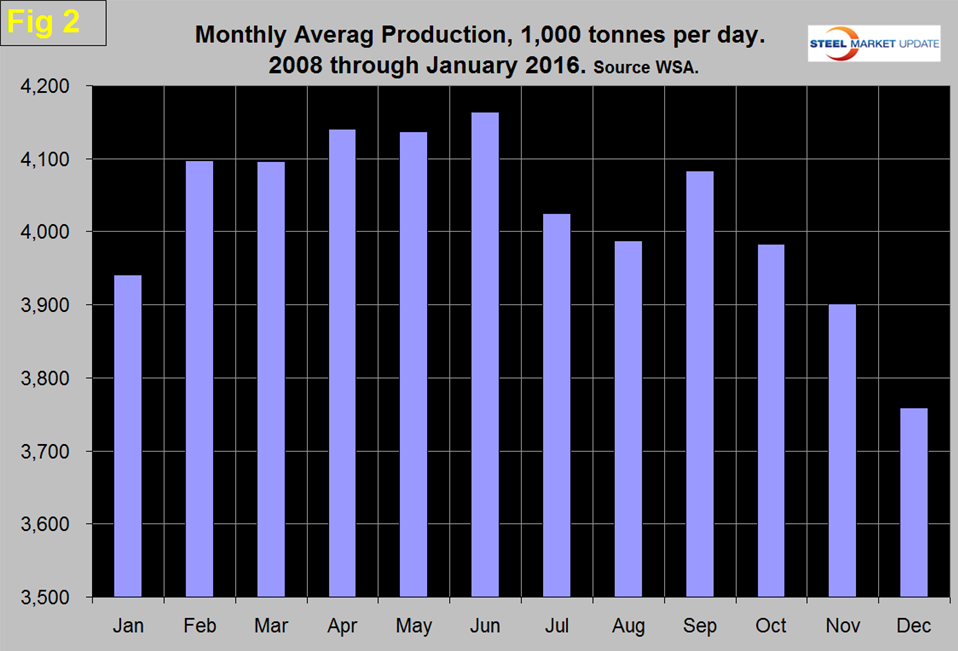
In 2015 the uptick was delayed until April and the high point of 2014 was not reached in 2015. Figure 2 shows the average monthly production by month in the 8 years since 2008. On average, January has been up by 4.8 percent from December; this year the number was 1.1 percent which is another measure of the slowdown.
On a 3MMA basis, production through January was the lowest since February 2013. As production has increased each year since the recession, capacity utilization has decreased, the gap is widening. Capacity utilization in three months through January was 65.7 percent, down from 72.3 percent in three months through June.
China accounted for 49.4 percent of global production in January, down from 50.8 percent in December. Asia as a whole, including India, accounted for 68.3 percent in January. China continues to state that redundant capacity will be closed and that the central government will provide support in the form of funding for re-assigned workers and for asset write-offs. If the WSA is keeping up with the situation then no actual capacity has been shuttered or, if it has new capacity has replaced it.
Table 1 shows global production broken down into regions and also the production of the top ten nations in the single month of January and their share of the global total. It also shows the latest three months and twelve months production through January with year over year growth rates for each.
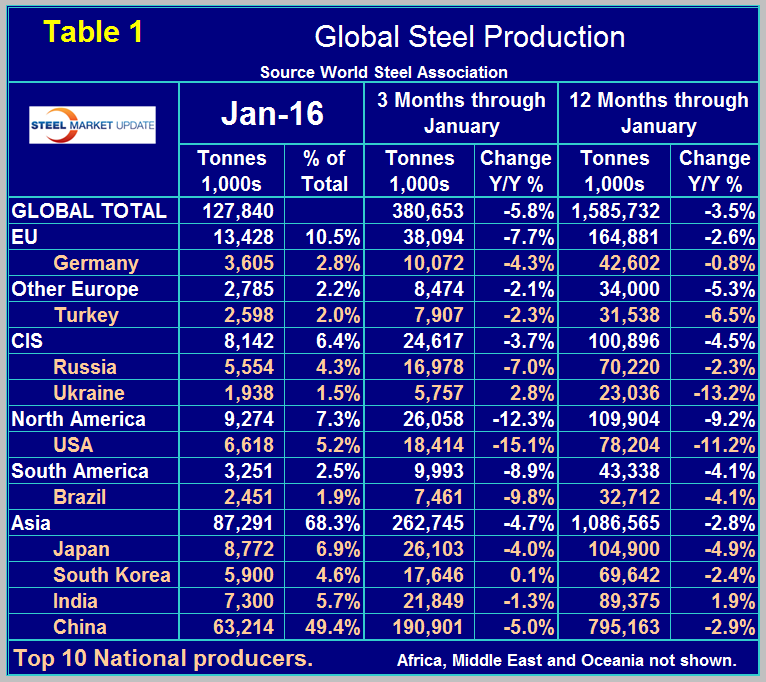
Regions are shown in white font and individual nations in beige. If the three month growth rate exceeds the twelve month we interpret this to be a sign of positive momentum and accelerating growth. The situation currently is the reverse with negative momentum.
Momentum has been negative every month since February 2014. The world as a whole currently has a negative growth of 5.8 percent in 3 months and negative 3.5 percent in 12 months. All regions had negative growth in the latest data.
On a single country basis, of the top ten producers only Ukraine and South Korea had positive year over year growth in the 3 months through January. In the January data China was down by 5.0 percent in three months year over year, North America was down by 12.3 percent in total with the US down by 15.1 percent, Canada down by 1.4 percent and Mexico down by 8.1 percent. The European Union was down by 7.7 percent and other Europe was down by 2.1 percent led by Turkey down by 2.3 percent.
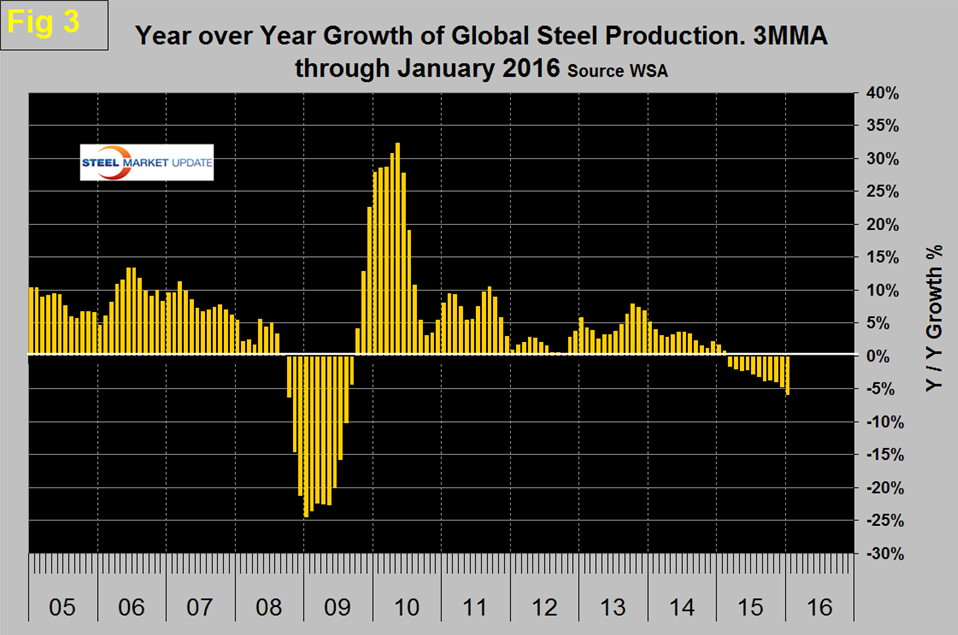
Figure 3 really says it all on a macro level and shows the 3MMA of the monthly year over year growth of global steel production. This became negative in March for the first time since September 2009 and is getting worse.
In October the World Steel Association published their latest Short Range Outlook, (SRO) for apparent steel consumption in 2015 and 2016. We will leave these in our monthly updates until the April 2016 revision is released even though this forecast looks increasingly wrong. (Note this forecast is steel consumption, not crude steel production which is the main thrust of what you are reading now.) The first table of the SRO is by region and the second for the top 10 consuming nations. At the global level consumption must equal production in the long term with inventory adjustments interfering with that relationship in the short term. WSA forecast a 1.7 percent contraction in demand in 2015 followed by a 0.7 percent expansion this year. Based on this analysis by the WSA, NAFTA will decline by 2.7 percent this year and grow by 2.1 percent next year with the US contracting by 3.0 percent and growing by 1.3 percent on the same basis.
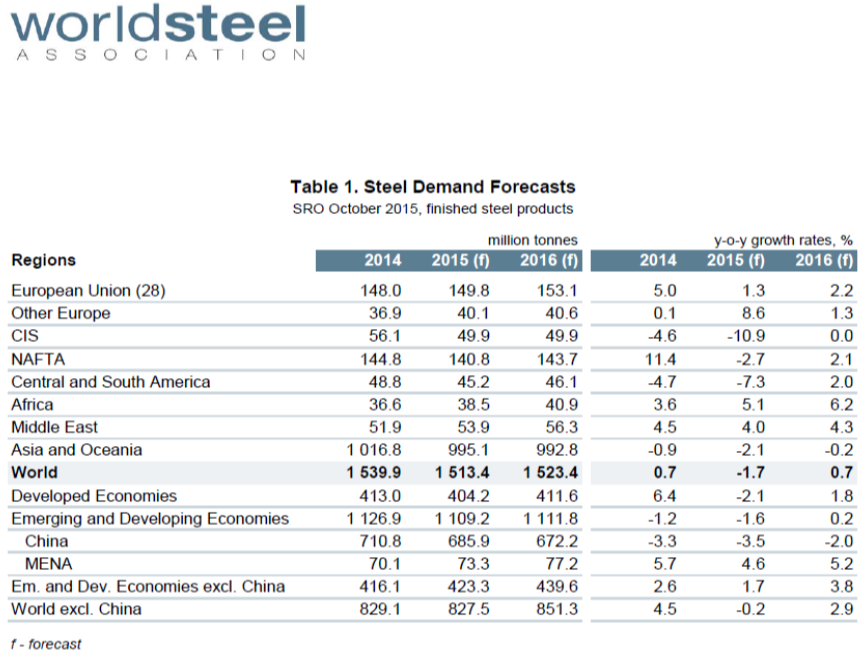
SMU Comment: The WSA forecast for 2015 was very wrong even though it was published late in the year. They had demand declining at the global level by 1.7 percent when it was actually down by 3.0 percent. They have 2016 increasing by 0.7 percent. By our reckoning the decline is accelerating, therefore, we don’t believe 2016 will enjoy positive growth. The WSA forecast will be updated in April. China is exporting far more than the US produces, a situation that is not likely to change in the short term as they play the game of shipping to destinations of least resistance. The relatively low price of ore compared to scrap is helping the competitive position of the Chinese integrated producers who are flooding the world with semi-finished billets. These exports are being disguised by classification as square bar which makes it difficult to comprehend the true condition of the global scrap and semis market.


