Market Data

April 18, 2016
Industrial Production & Capacity Utilization for March 2016
Written by John Packard
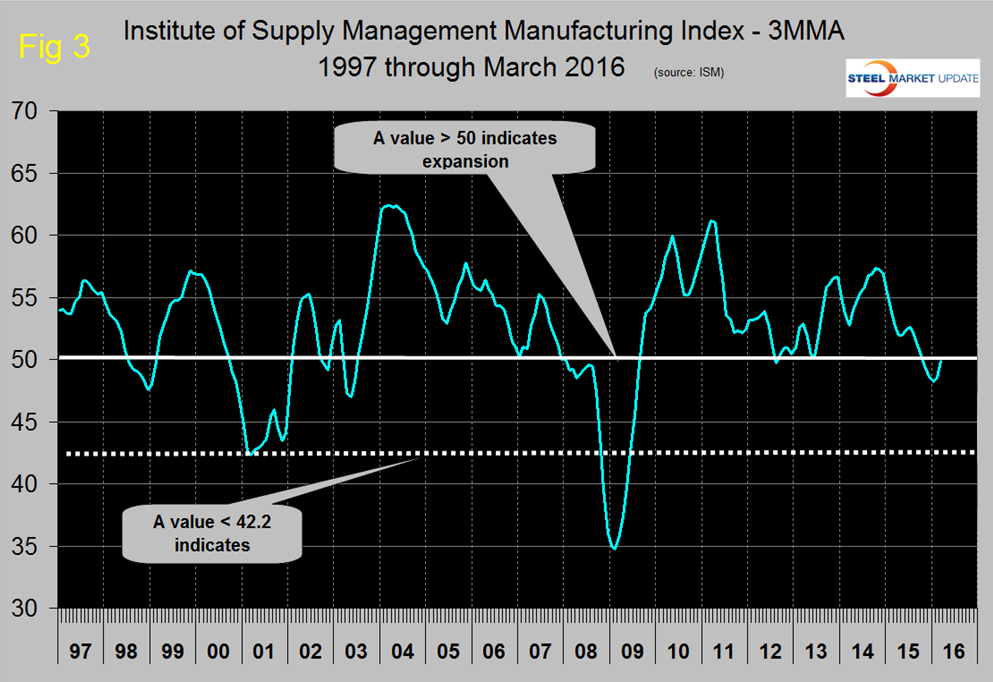
Both these data points are reported in the Federal Reserve G17 data base. This month the historical data has been revised and we have updated our files back to January 2000. The index had an all-time high of 106.40 in January 2015 but on a month over month basis has declined for 13 of the last 16 months.
On a three month moving average (3MMA) basis, growth year over year has been negative for the last six months. October last year was the first negative growth month since February 2010. The March y/y decline was 1.70% (Figure 1). Data is seasonally adjusted and the index is based on the May 2012 level being defined as 100. Recessions are highlighted. The effect of the revisions has been to reduce the growth rate since the beginning of 2014. Before that the revisions didn’t make much difference.
The official report read as follows; Industrial production decreased 0.6 percent in March for a second month in a row. For the first quarter as a whole, industrial production fell at an annual rate of 2.2 percent. A substantial portion of the overall decrease in March resulted from declines in the indexes for mining and utilities, which fell 2.9 percent and 1.2 percent, respectively; in addition, manufacturing output fell 0.3 percent. The sizable decrease in mining production continued the industry’s recent downward trajectory; the index has fallen in each of the past seven months, at an average pace of 1.6 percent per month. At 103.4 percent of its 2012 average, total industrial production in March was 2.0 percent below its year-earlier level.
The Federal Reserve Beige Book had this to say on April 13th which seems to be at odds with the Industrial Production Index.
Manufacturing
Manufacturing activity increased in most Districts in late February and March. Contacts described the overall pace of growth as moderate in Richmond and Chicago, while growth was more modest in Philadelphia, St. Louis, and San Francisco. Only Cleveland and Kansas City reported declines in activity. By industry, district reports indicated that the strongest performers were autos (Cleveland, Richmond, Chicago, and Dallas), aerospace (Philadelphia, Cleveland, and Chicago), and computers and electronics (Boston and Dallas). There also were solid gains in construction materials (Philadelphia, Cleveland, and Chicago), food processing (Richmond and Dallas), defense (Chicago), and pharmaceuticals (San Francisco). Results were mixed for producers of paper products, metals, and chemicals. Demand was weak according to plastics manufacturers in Richmond and Kansas City.
Demand for steel changed little according to contacts in Cleveland and Chicago, but declined in Kansas City. Several Districts reported weak overall demand for heavy machinery, with Chicago and Minneapolis noting softer demand for agricultural and mining machinery than for construction machinery. Suppliers for the oil and gas industry consistently reported weak demand and some contacts in Chicago and Dallas indicated they were trying to adjust their product offerings toward other industries. Expectations for future manufacturing growth were mixed. In general, contacts’ outlooks were optimistic in Boston, Philadelphia, Cleveland, and Richmond, but pessimistic in Atlanta, Minneapolis, and Dallas.
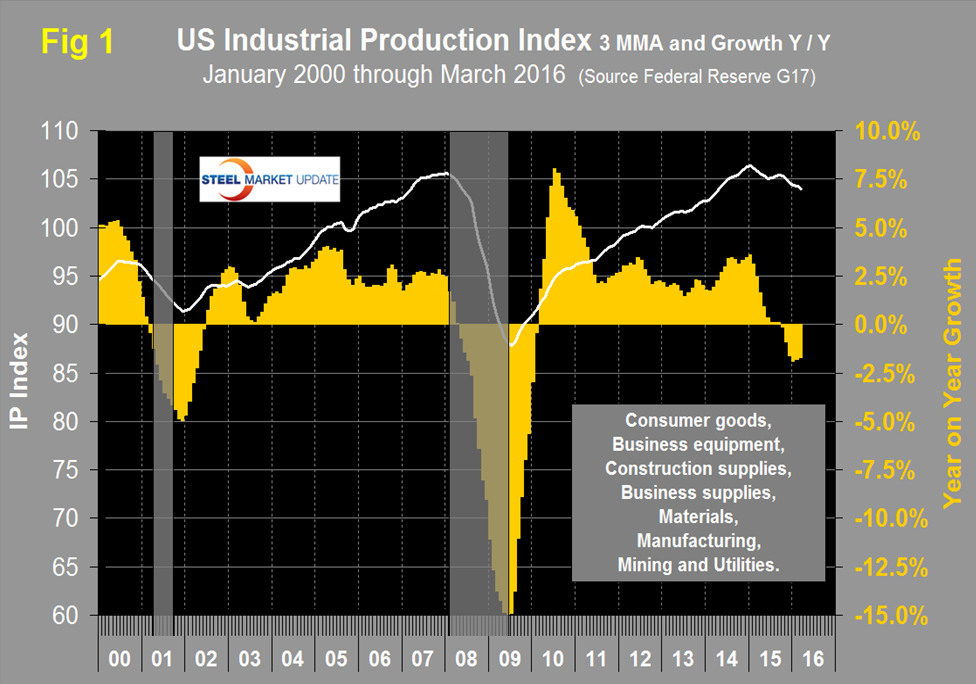
Manufacturing capacity utilization was 75.15% in March with a 3MMA of 75.36% (Figure 2). The effect of the data revisions since 2000 has been to flatten the recent curve shown in Figure 2. Utilization in 2013 and 2014 was revised up but the revisions reduced the values in 2015. In January last year, utilization exceeded 76% for the first time since the recession.
Regarding the March result the Fed had this to say; “Capacity utilization for the industrial sector decreased 0.5 percentage point in March to 74.8 percent, a rate that is 5.2 percentage points below its long-run (1972–2015) average.”
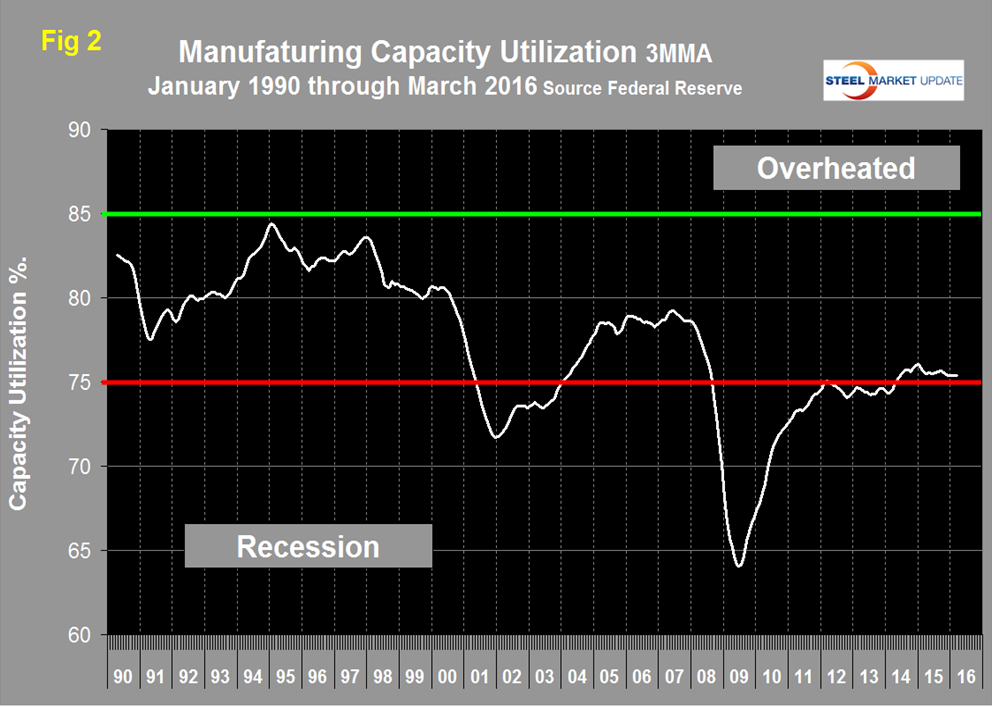
SMU Comment: We are getting mixed signals about the state of the manufacturing sector. Employment growth is dismal and this IP report says the sector is in contraction mode. The ISM manufacturing index surged in March to 51.8, its highest level since July last year. Figure 3 shows the 3MMA of the ISM manufacturing index since March 1997. Any value >50 indicates expansion. At SMU we try to examine two or three measures of the same activity as a reality check and on this basis we have to say that the jury is out when it comes to the direction of manufacturing. In March employment was down, the IP index was also down but the ISM index improved. Stay tuned!