

Market Segment

May 17, 2016
Service Center Intake, Shipments and Inventory through April 2016
Written by Peter Wright
The article below was published to our Premium members yesterday afternoon, but we felt it would be nice to share with our Executive members too. If you would like more information about a Premium membership or would like to upgrade, contact us at info@SteelMarketUpdate.com.
Based on Steel Market Update (SMU) analysis of the recently released MSCI service center inventory and shipment data, total service center carbon steel shipments decreased by 84,700 tons in April to 3.091 million tons. This decrease was driven by the number of shipping days, down by 2 to 21. On a t/d basis shipments increased from 138,000 tons in March to 147,200 tons in April. In the eight years since and including 2009, April shipments on average on a t/d basis have been down by 0.9 percent from March. This year shipments were up by 6.6 percent.
Therefore on a long term basis (8 years) the April performance was encouraging and more than made up for the disappointing March result. This observation is only intended to give a long term perspective because MSCI data is quite seasonal and we need to get past that before commenting in detail on current results. Figure 1 demonstrates this seasonality and why comparing a month’s performance with the previous month is usually misleading.
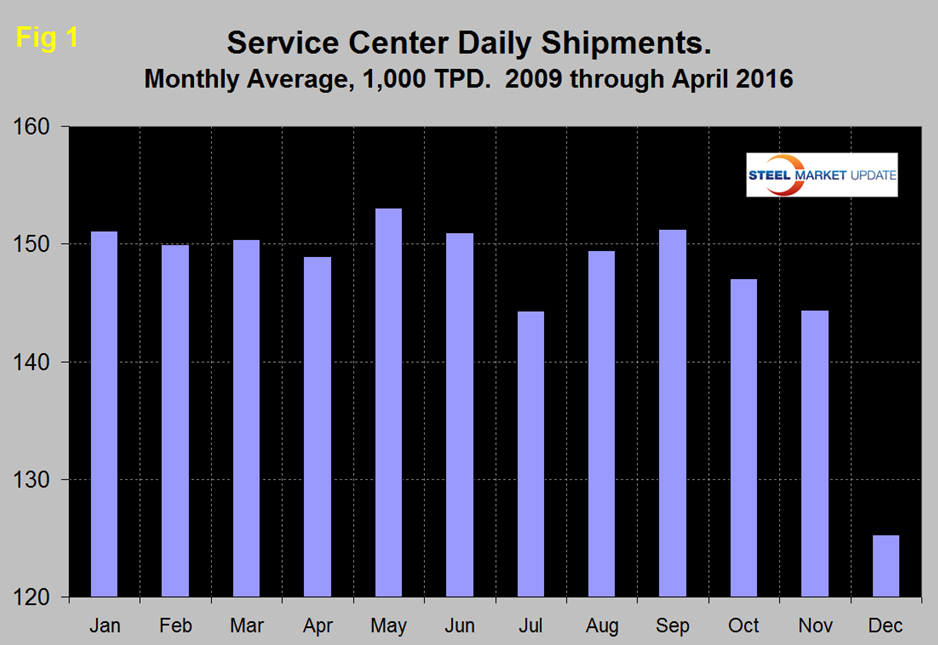
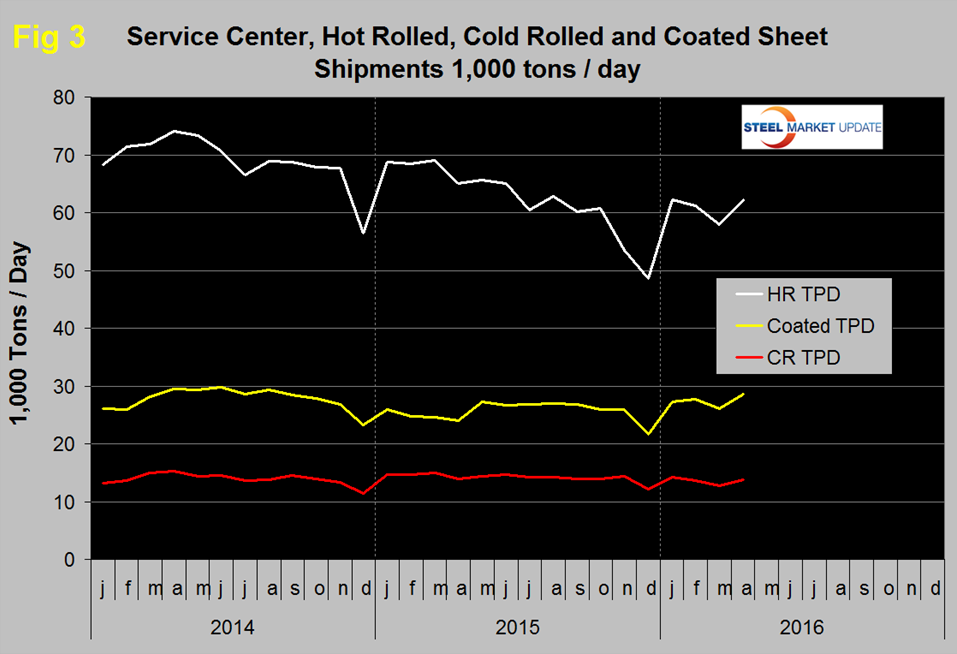
We can expect a surge in t/d shipments in May. In the SMU analysis we always consider year over year changes to eliminate this seasonality. Table 1 shows the performance by product in April compared to the same month last year and also with the average t/d shipments for April in the last three years.
We then calculate the percent change between April 2016 and April 2015 and with the 3 year April average. Our intention is to provide an undistorted view of market direction. In April, intake at 145,400 t/d was 1,800 tons less than shipments. This was the seventh month of deficit after three months of surplus. Total sheet products had a deficit of 4,000 tons but intake was up by 0.3 percent y/y.
In December 2015 the MSCI expanded their data to include sub sets of the major product groups and provided two years of data for 2014 and 2015. Table 1 shows the breakdown of sheet products into hot rolled, cold rolled and coated products. The intake deficit was evident for all sheet products lead by hot rolled. Long products and plate had an intake surplus. Compared to April 2015, intake was down by 0.8 percent for all carbon steel products but the intake of coated sheet products was up by over 30 percent for the third consecutive month. Intake of hot rolled was down by 10.6 percent and of bar sized shapes by 10.9 percent y/y.
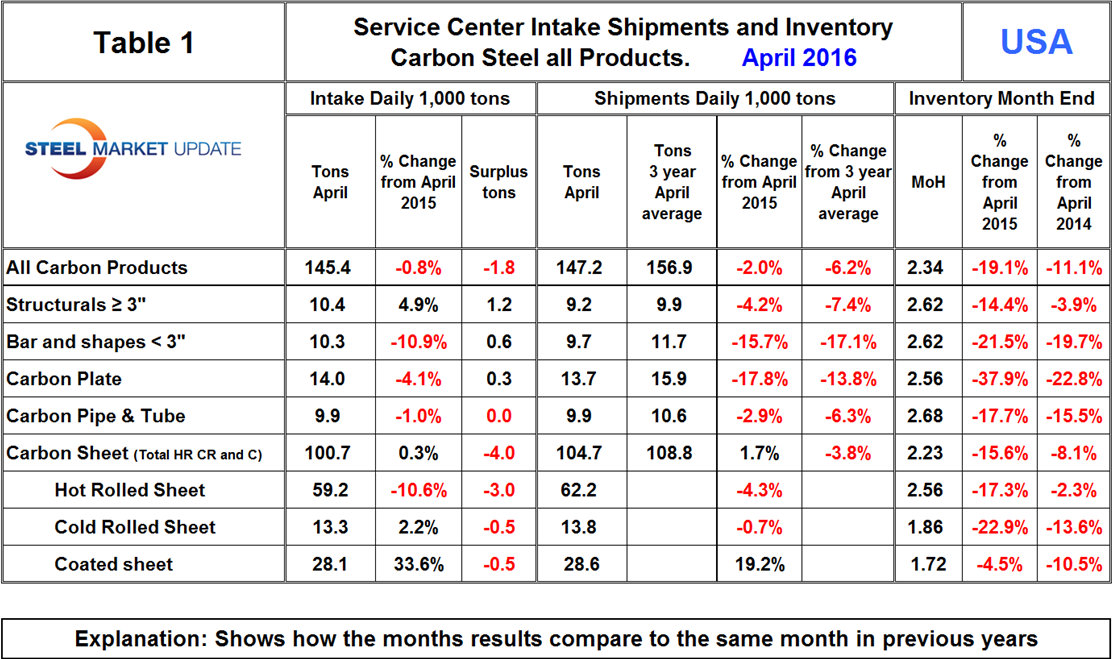
Shipments of all carbon steel products in April on a t/d basis were down by 2.0 percent y/y and were 6.2 percent less than the average April shipments for 2016, 2015 and 2014. The fact that the single month y/y growth comparison is better than the three year comparison is an indication that momentum is positive which was a turnaround from March. Figure 2 shows the long term trends of daily carbon steel shipments since 2000 as three month moving averages. (In our opinion the quickest way to size up the market is the brown bars in Figures 2, 5, 6 and 8 which show the y/y change in shipments. All four of these graphs show contraction.)
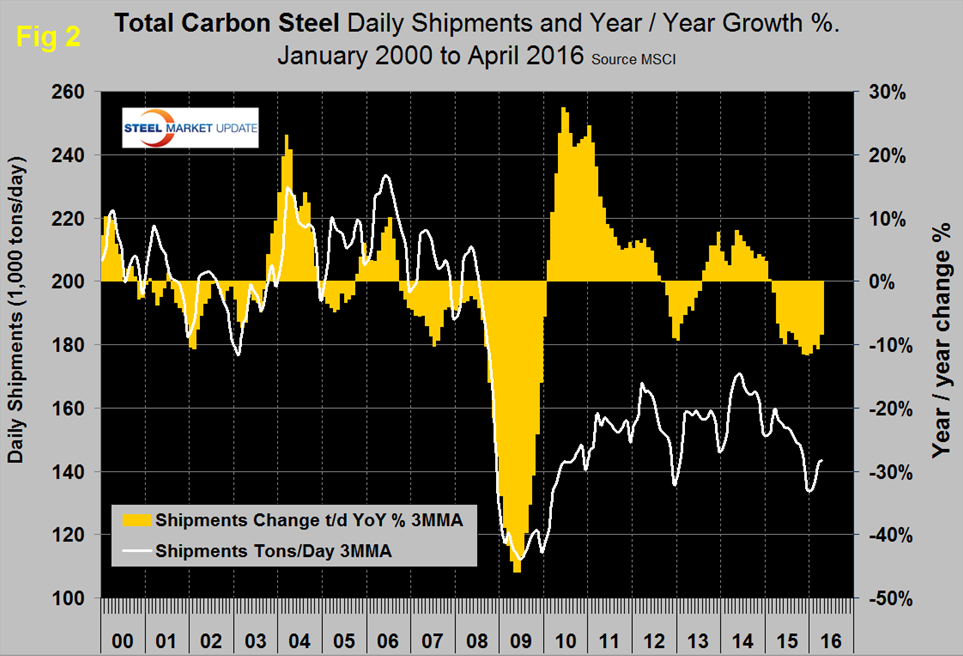
Total daily shipments had a post recessionary high of 173,300 in April 2014 and as shown by the brown bars in Figure 2 have had 14 consecutive months of negative y/y growth. In April shipments of all long products, plate and tubulars were down year over year. Sheet products in total were up by 1.7 percent lifted into positive territory by coated products that were up by 19.2 percent. Figure 3 shows the historical shipping rate of the three major sheet products since January 2014.
Coated products enjoyed the highest shipments since mid-2014, cold rolled is going nowhere and hot rolled in April erased the March decline.
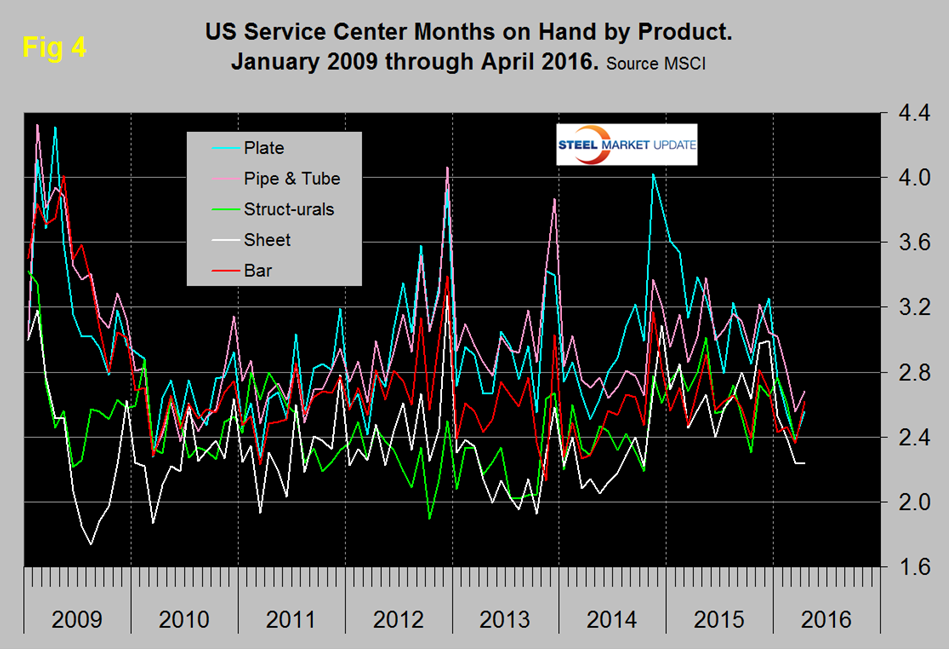
April closed with months on hand (MoH) of 2.34, up from 2.29 at the end of March. All products except coated sheet had a double digit y/y decrease in MoH and plate was down by 37.9 percent. Figure 4 shows the MoH by product monthly since January 2009. Pipe and tube currently has the highest months on hand.
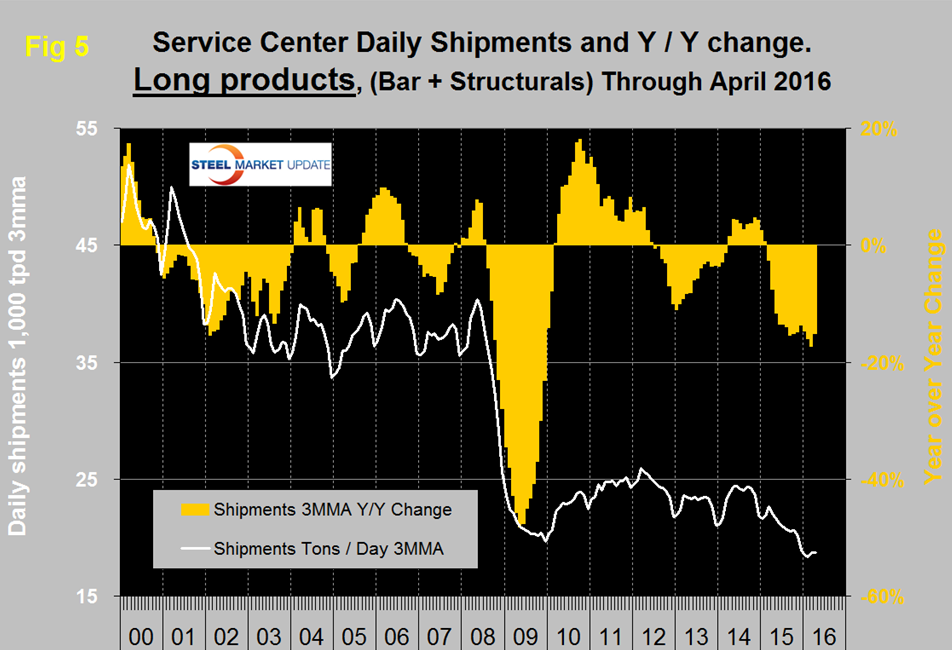
There continues to be a wide difference between the performances of flat rolled (sheet + plate) and long products (structurals + bar) at the service center level. Long product shipments from service centers are now lower than they were at the depths of the recession which as we have reported previously makes no sense to us unless there has been a mass migration of buyers direct to the mills. Alternatively the numbers are just wrong because of gaps in company participation (Figure 5).
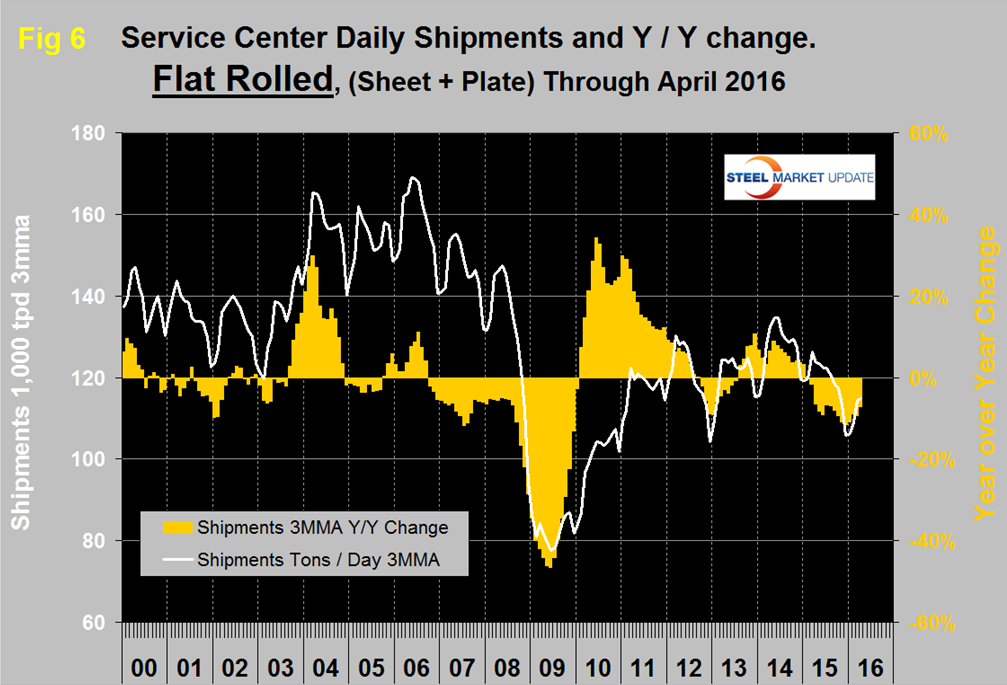
Considering the improving construction statistics, we have no explanation for this dismal long product performance. Flat rolled has had a much better recovery since mid-2009 and had positive y/y growth for 18 straight months through January 2015. In February 2015 growth slowed to zero and has been negative ever since (Figure 6).
In 2006 and 2007, the mills and service centers were operating at maximum capacity. Figure 7 takes the shipments by product since that time frame and indexes them to the average for 2006 and 2007 in order to measure the extent to which service center shipments of each product have recovered.
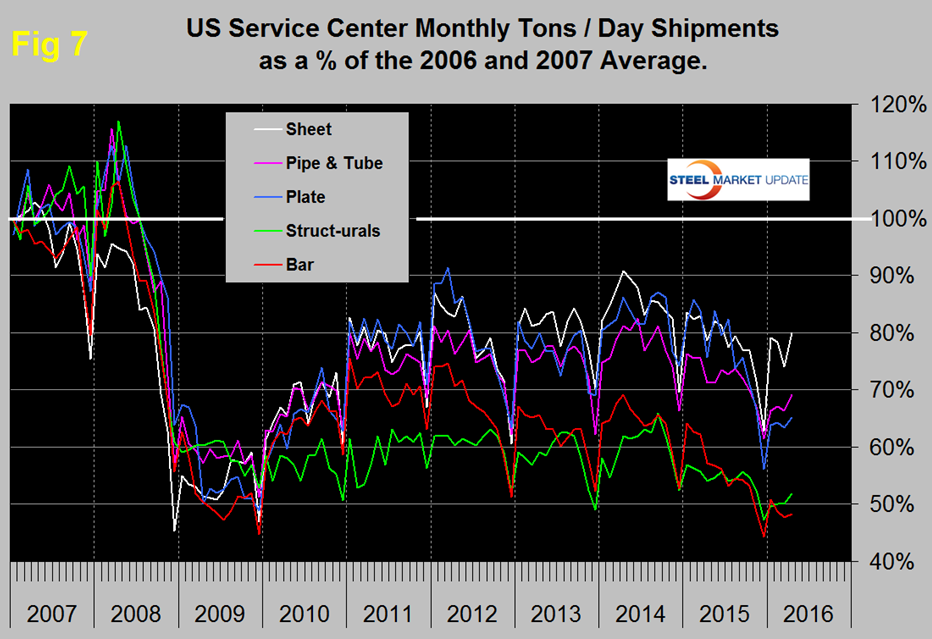
All products experienced the normal end of year collapse and January pick up. The total of carbon steel products is now at 69.3 percent of the shipping rate that existed in 2006 and 2007, with structurals and bar at 51.8 percent and 48.3 percent respectively. Sheet is at 80.0 percent, plate at 65.2 percent and tubulars at 69.2 percent.
MSCI uses product nomenclature flat and plate. In this analysis at SMU we replace the term flat with sheet. MSCI’s definition of “flat” is all hot rolled, cold rolled and coated sheet products. Since most of our readers are sheet oriented we have removed plate from Figure 6 to highlight the history of sheet products which are shown in Figure 8.
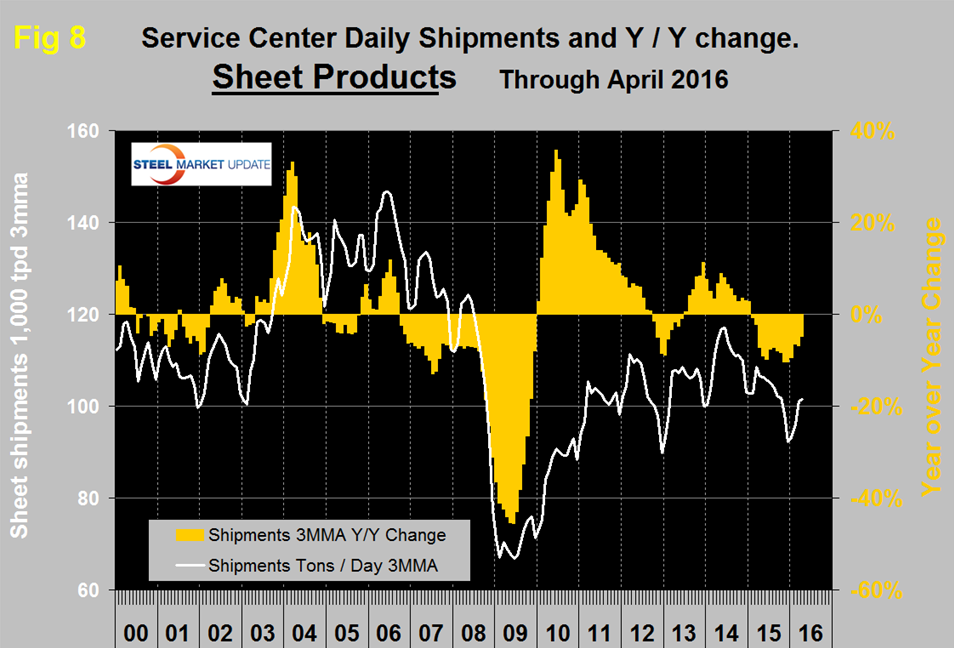
Following the strong post-recession recovery, sheet products experienced 9 months of decline from October 2012 through June 2013. This was followed by 19 months of growth through December 2015 but January 2015 slipped back into negative territory at -0.7 percent year over year and has been negative ever since with a 4.8 percent contraction in April 2016.
SMU Comment: In Figures 2, 5, 6 and 8, the white lines show t/d shipments. There was a distinct decline in shipments for all major product groups in 2015 on a y/y basis and this decline is ongoing. The good news is that for flat rolled the decline is slowing. Figure 9 shows the total supply to the market of long and flat products based on AISI shipment and import data.
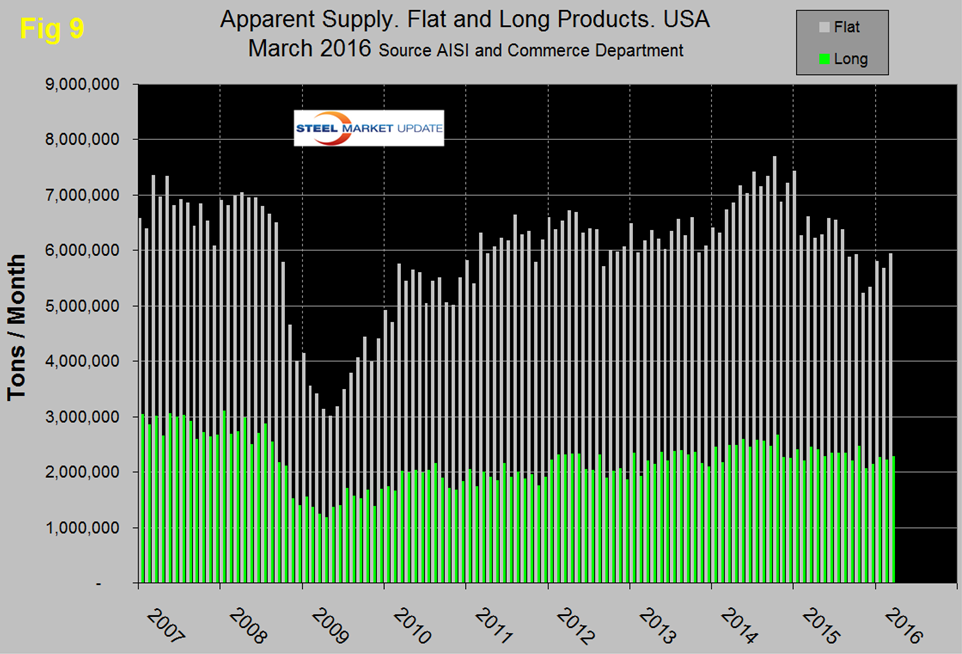
Total supply of long products is much better than the MSCI report of service center shipments with a volume almost double the recessionary low point. Total supply of flat rolled products peaked in October 2014, dropped sharply in April 2015 then through August didn’t change much. However in November supply was the lowest since April 2010. There has been an uptick in total flat rolled supply this year but compared to this time last year volumes are still depressed. For flat rolled the MSCI and AISI data are in reasonable agreement with one another. Note: this supply data is one month behind the MSCI information.
The SMU data base contains many more product specific charts than can be shown in this brief review. For each product we have ten year charts for shipments, intake, inventory tonnage and months on hand. Some readers have requested these extra charts for a particular product and others are welcome to do so.


