

Prices

May 19, 2016
Global Steel Production and Forecast through 2017
Written by Peter Wright
Production in the month of April at 134,874,000 metric tons was down by 2.0 percent from March but the three month moving average (3MMA) that we prefer as a measure was up by 2.0 percent. Capacity is 2.3 billion tonnes per year and capacity utilization in April was 70.5 percent. There has been a significant decline in the 3MMA in the second half of the year since and including 2010 which then picks up in January and February (Figure 1).
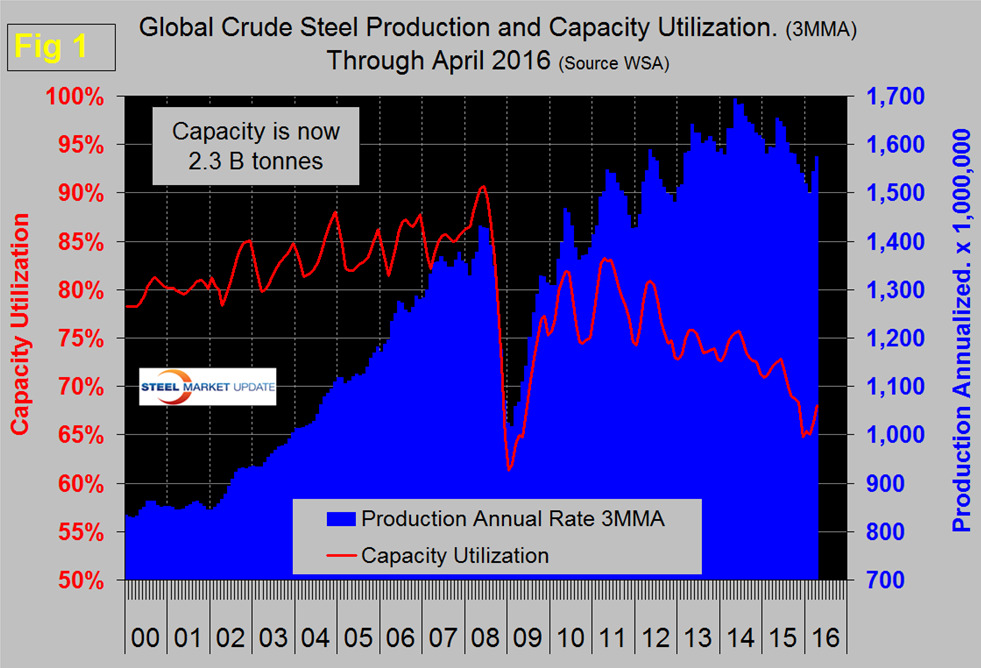
In 2015 the uptick was delayed until April and the high point of 2014 was not reached in 2015. Figure 2 shows the average monthly production by month in the 8 years since 2008.
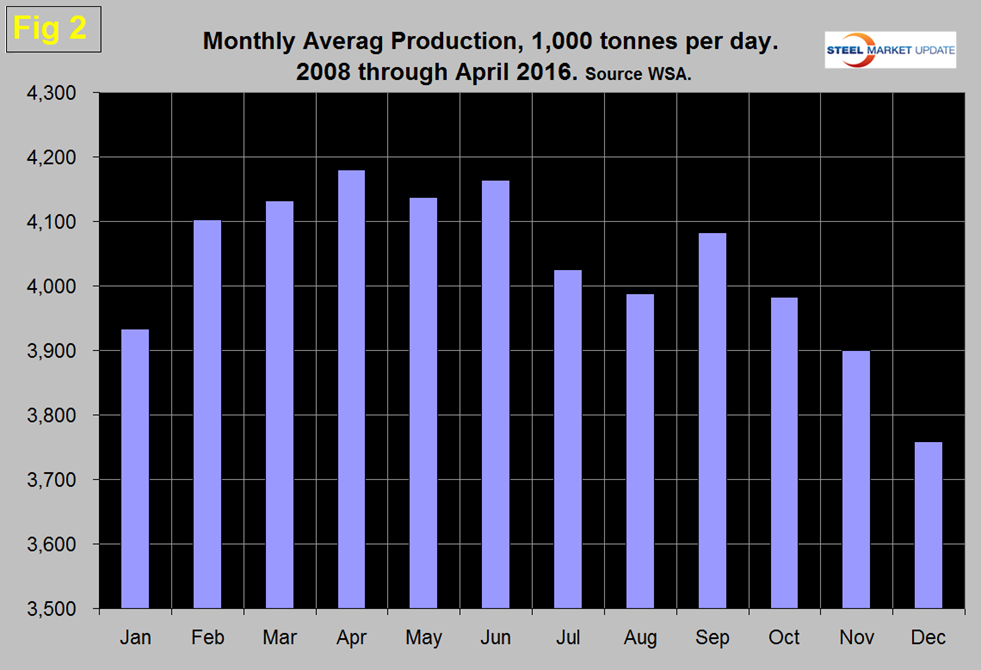
On average April has the highest monthly production of the year and historically has been up by 1.15 percent from March. This year April was up by 1.24 percent from March therefore was relatively normal. On a tons per day basis production in April was 4.496 million tonnes, up 1.2 percent from March and the highest level since May last year. Since the recession, capacity utilization has been on a steadily downward trajectory with an upward blip in the last two months. Capacity utilization in the three months through April was 68.0 percent, down from 72.3 percent in three months through June last year.
Figure 3 is the most succinct description of the change in growth rate since January 2005.
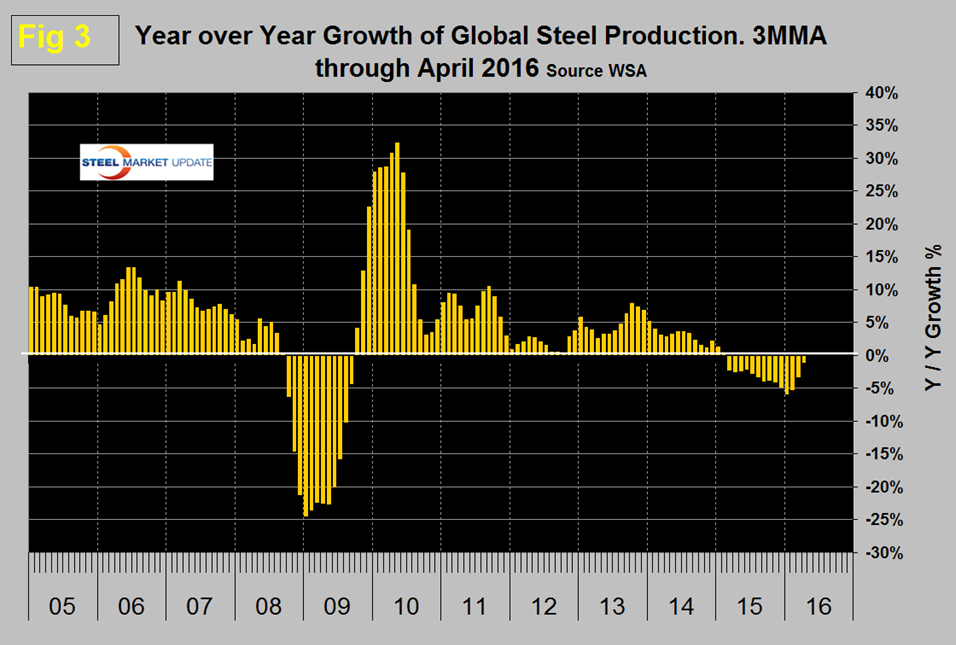
It shows the 3MMA of the monthly year over year growth of global steel production. This became negative in April 2015 for the first time since September 2009 and the slowdown accelerated through January this year when the contraction was 5.8 percent. Since January the contraction has slowed and year over year in April was 1.1 percent. In the last couple of years at the global level, steel supply has exceeded demand but it looks as though the much celebrated slowdown in production may be coming to an end.
Table 1 shows global production broken down into regions and also the production of the top ten nations in the single month of April and their share of the global total.
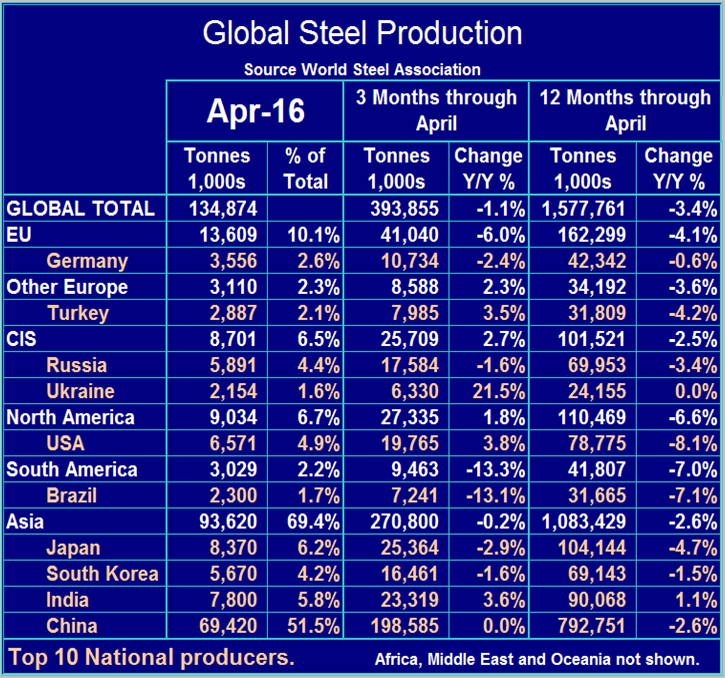
It also shows the latest three months and twelve months production through April with year over year growth rates for each. Regions are shown in white font and individual nations in beige. The world as a whole still has negative growth of 1.1 percent in 3 months and negative 3.4 percent in 12 months through April. If the three month growth rate exceeds the twelve month we interpret this to be a sign of positive momentum and accelerating growth. Momentum was negative for over 12 months through February, became flat in March and positive in April.
China accounted for 51.5 percent of global production in April, up from 48.6 percent in February. Asia as a whole, including India, accounted for 69.4 percent in April. In March, China’s assistant commerce minister stated that China had cut 90M metric tons of capacity and had plans to reduce it by another 100M-150M. There is no sign that this is having any effect. China’s March production was the highest since May 2014 and April was the 3rd highest in that 23 month period.
On a regional basis in 3 months through April year over year, South America and the EU declined by 13.3 percent and 6.0 percent respectively. China’s production was unchanged and Asia as a whole declined by 0.2 percent. Other Europe (mainly Turkey) and the CIS had positive growth in the latest data. North America was up by 1.8 percent in total with the US up by 3.8 percent, Canada up by 7.3 and Mexico down by 8.2 percent.
The October version of the World Steel Association Short Range Outlook (SRO) for apparent steel consumption in 2015 and 2016 had last year contracting at 1.7 percent and 2016 growing at 0.7 percent. What actually happened was that consumption contracted by 3.2 percent in 2015. In April the WSO updated its forecast (note this forecast is steel consumption, not crude steel production which is the main thrust of what you are reading now). Figure 4 is a geographical view of production and growth in 2016, followed by Table 2 which shows the expectations by country and region.
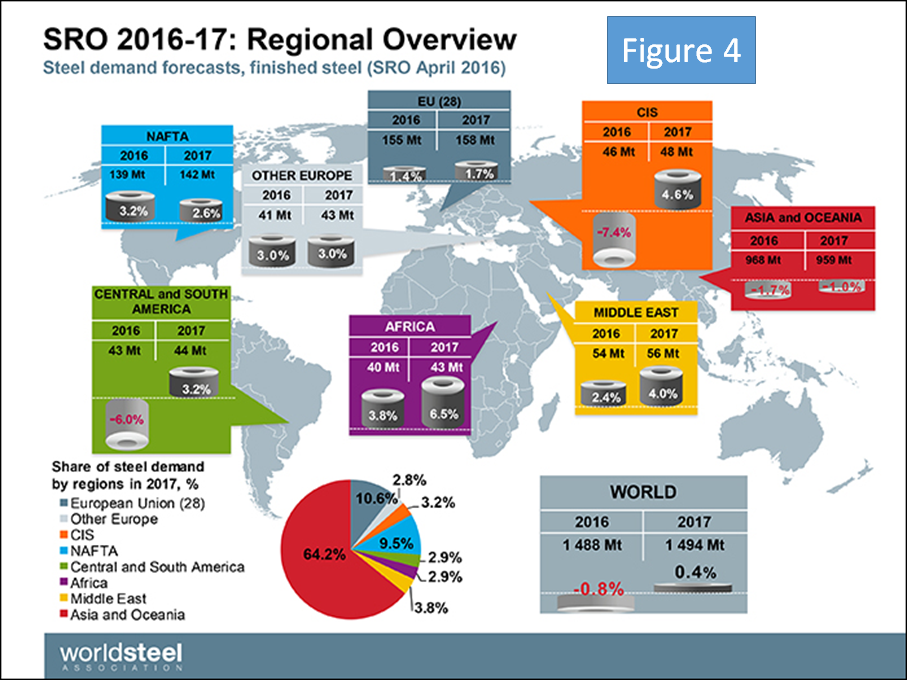
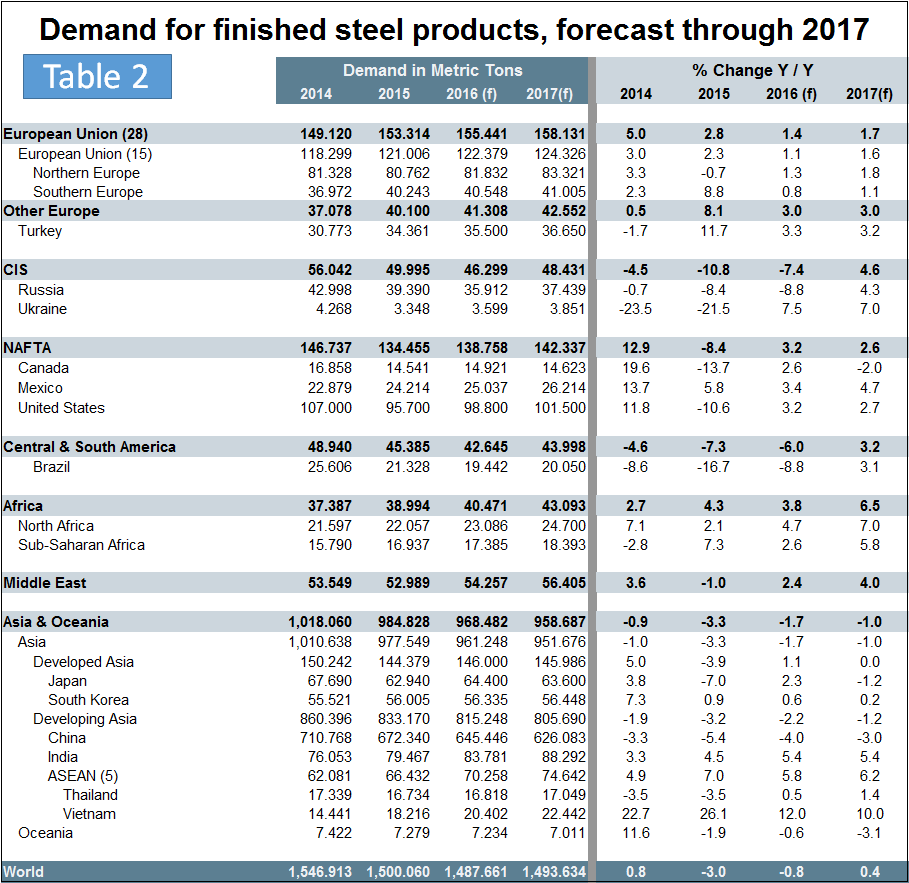
We will leave these two figures in our monthly updates for reference until they are revised next October. The new WSA forecast has global consumption in 2016 contracting at 0.8 percent and in 2017 growing at 0.4 percent. Based on this forecast, NAFTA will grow by 3.2 percent this year and 2.6 percent next. China will decline by 4.0 percent this year and 3.0 percent in 2016.
SMU Comment: This report is disappointing in the sense that the signs of oversupply moderating are less obvious. China’s production has picked back up in the last two months and by all accounts and by virtue of their volume of exports far exceeds their needs. It seems probable that the situation of oversupply and low capacity utilization won’t be resolved much before the end of this decade and that may be an optimistic estimate.
Source: World Steel Association with analysis by SMU.


