

Analysis

May 27, 2016
US Vehicle Sales and NAFTA Vehicle Production through April 2016
Written by Peter Wright
Both auto and light truck sales in the US dropped abruptly in March but recovered to different degrees in April. Auto sales declined from 7.4 million units in February at a seasonally adjusted annualized rate (SAAR) to 6.9 million in March then recovered partially to 7.1 million in April. Light trucks declined from 10.2 million in February to 9.7 million then recovered to 10.4 million in April. Total light vehicle sales in April were 17.5 million units, up from 16.6 million in March (Figure 1).
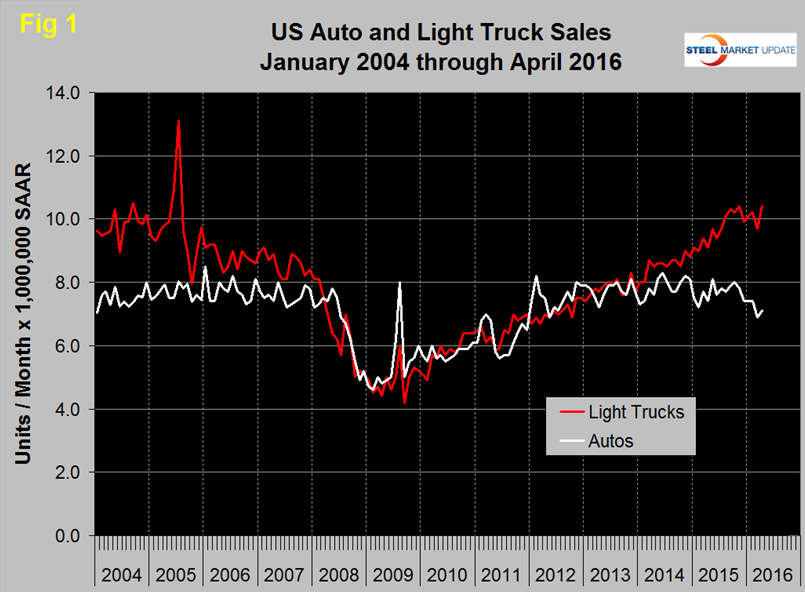
The sales mix in April was 59.8 percent light trucks which is the highest since our data stream began in January 2005. Light truck sales which include crossovers have been doing much better than autos since mid-2014. Import market share of total light vehicles in April was 21.3 percent, close to its average since Q4 2014. There has been a progressive decline in import share since September 2010 when it was 28.8 percent.
Moody’s commented as follows in Economy.com; Consumer fundamentals continue to improve, which will support sales, but the current sales pace is likely not sustainable. We expect vehicle sales to ease once pent-up demand is satisfied, because a pace above 17 million units exceeds the approximately 16.5 million units consistent with underlying fundamentals, which include the size of the driving population, income and wealth
Total light vehicle (LV) production in NAFTA in April was at an annual rate (not seasonally adjusted) of 18.302 million, down from18.849 million in March. Total production in 2015 was 17.361 million units. In cases where seasonality is more than a weather effect we like to compare the monthly result with the monthly norm over a number of years. On average since 2004, April’s production has been 8.0 percent less than March. This year April was down by 2.0 percent therefore we conclude that this was a good performance (Figure 2).
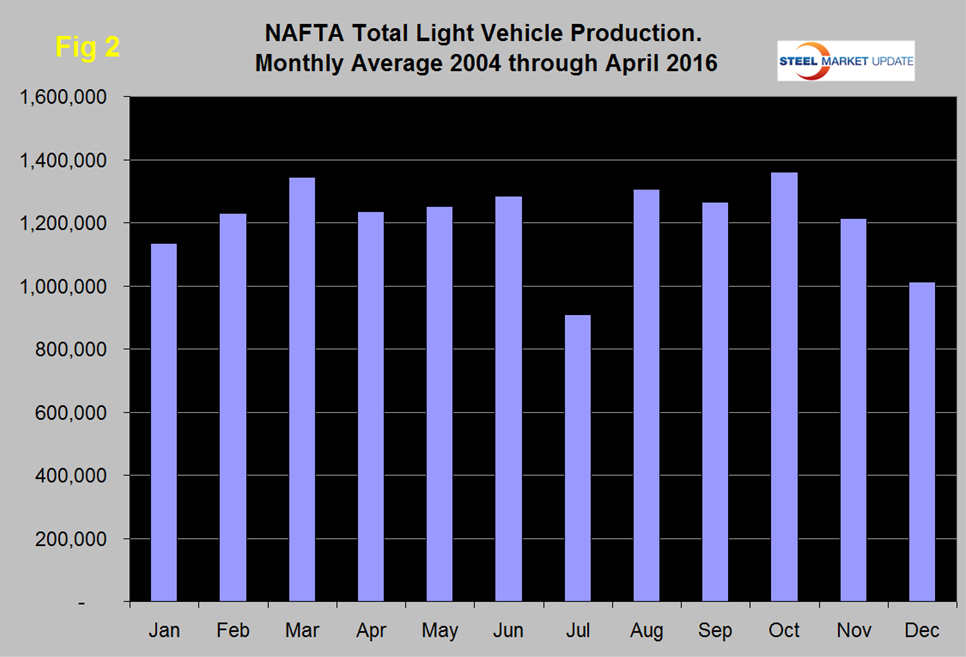
Note: these production numbers are not seasonally adjusted, the sales data reported above are seasonally adjusted. On a three month moving average basis (3MMA) April production was up by 4.6 percent year over year.
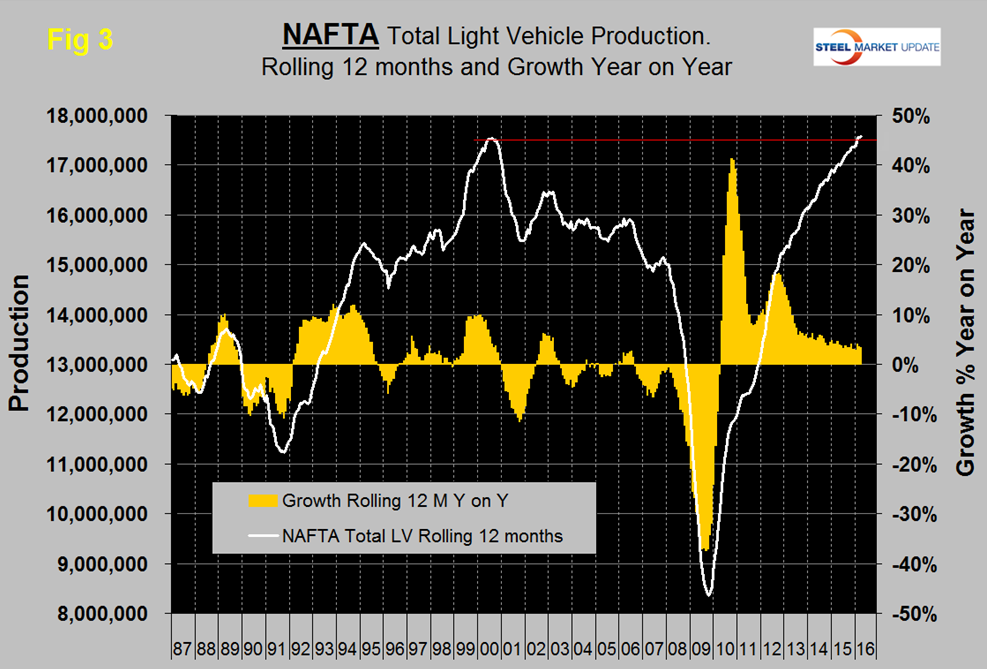
On a rolling 12 months basis y/y through April, LV production in NAFTA increased by 3.3 percent down from 3.6 percent in 12 months through March. LV production in NAFTA on a rolling 12 month basis through April was 17.583 million units, which was an all-time high (Figure 3).
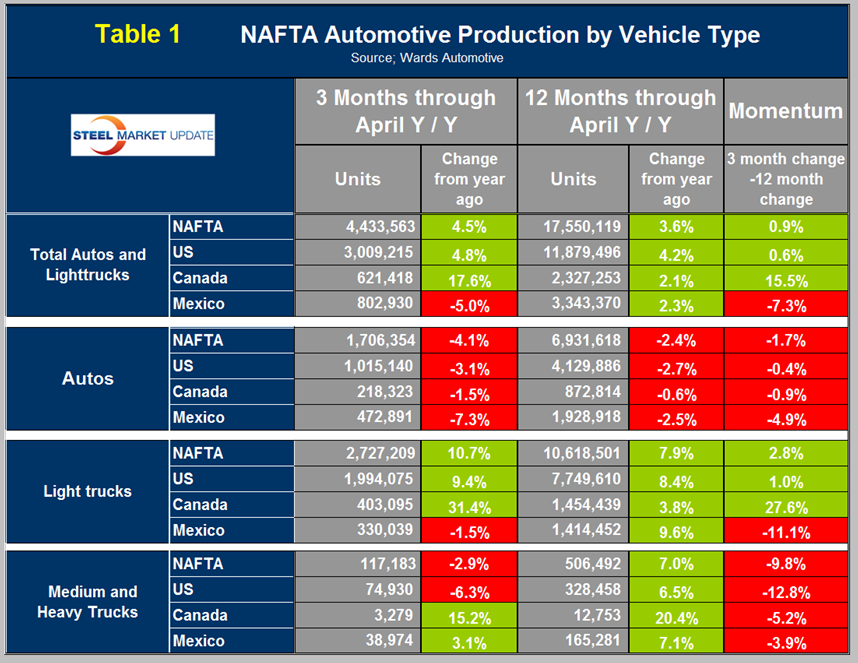
On a rolling 12 months basis y/y the US was up by 4.2 percent with positive momentum, Canada was up by 2.1 percent with very positive momentum and Mexico was up by 2.3 percent with negative momentum (Table 1).
Mexico has had negative momentum for twelve straight months. The US has gained production share in the most recent 3 ½ years (Figure 4) at the expense of Canada though that trend has slowed in the last 12 months when Canada picked up the pace.
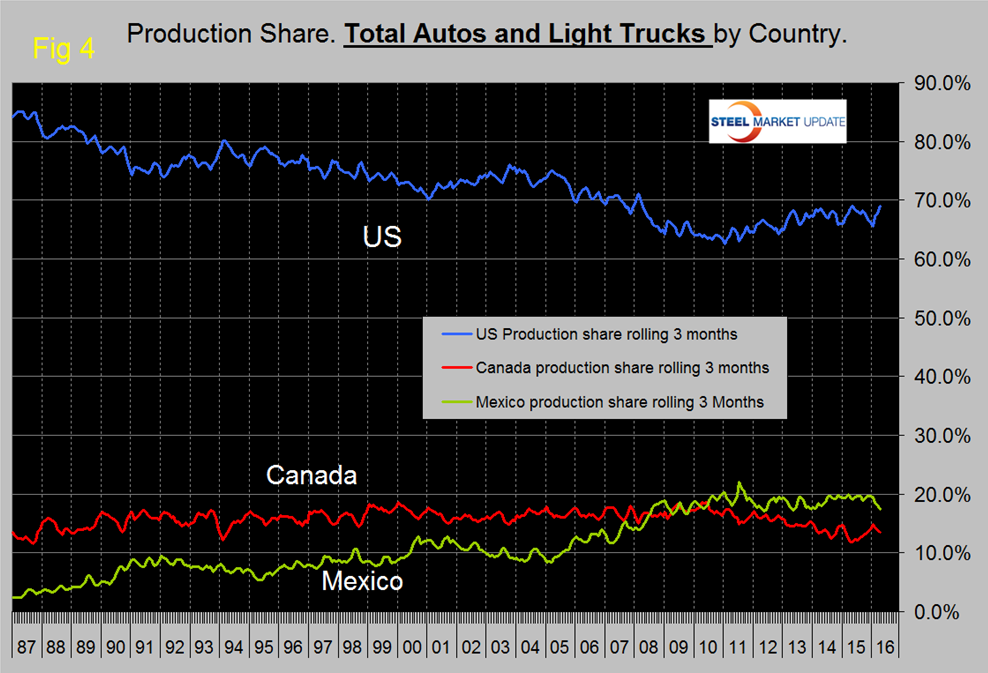
Mexico’s share has been fairly flat for five years and has declined in the last three months. In April on a rolling three month basis, the US production share of total light vehicles was 69.0 percent (up 1.1 percent from March), Canada’s was 13.5 percent (down 0.5 percent), and Mexico’s was 17.4 percent (down 0.7 percent).
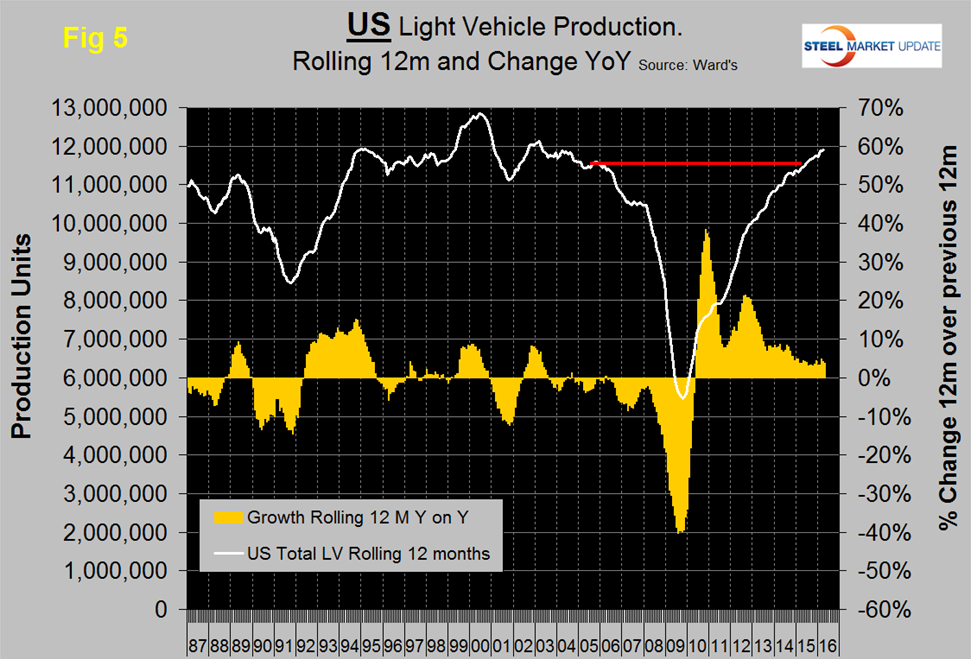
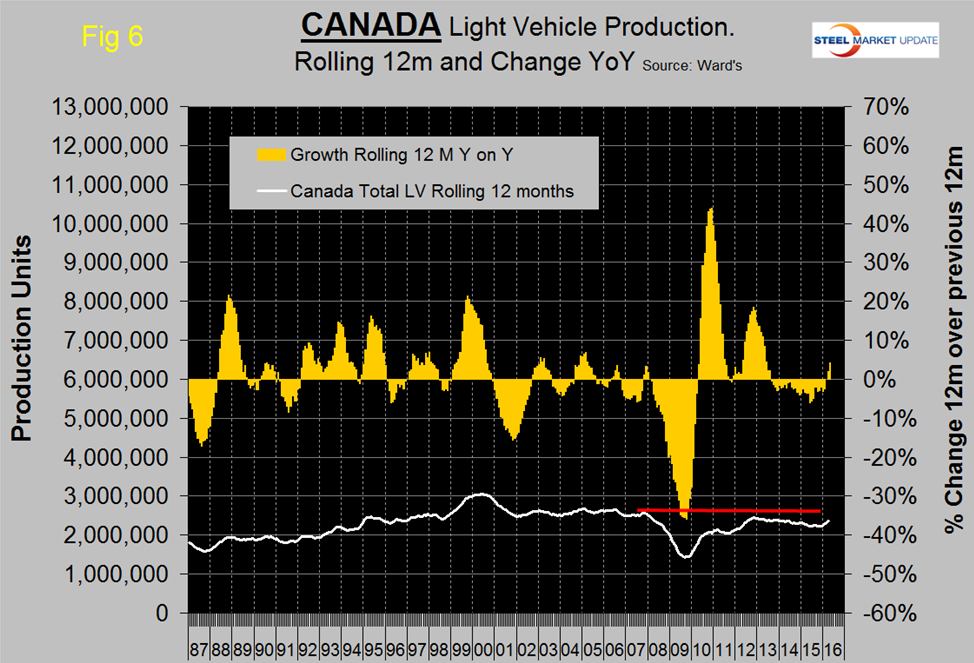
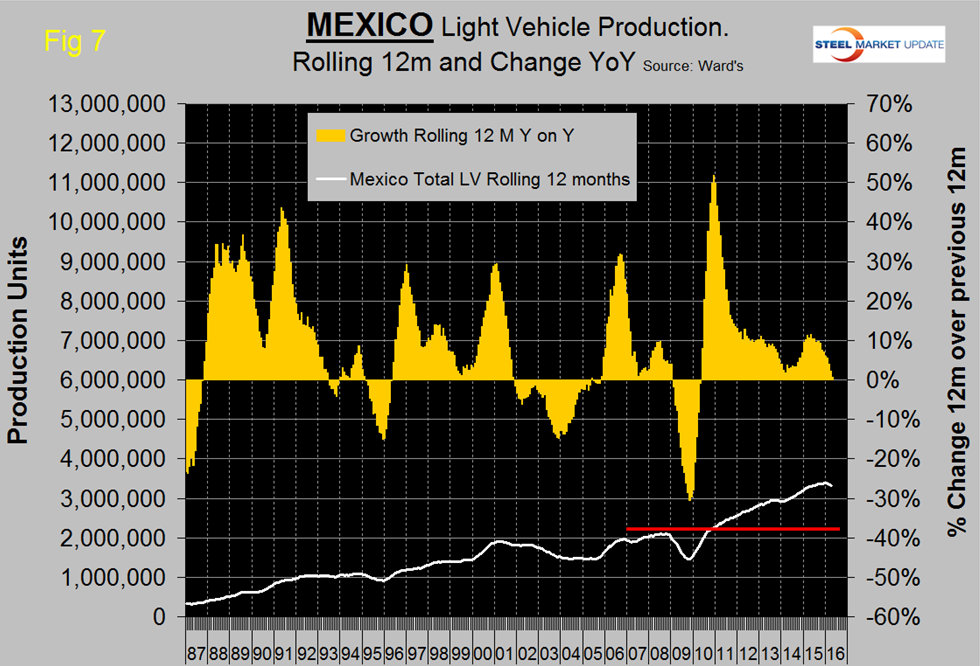
Figures 5, 6 and 7 show total LV production by country with y/y growth rates and on each the red line shows the change in production since Q2 2006. Note the scales are the same to give true comparability and that Mexican growth has slowed significantly this year and is now less than the US. Canada has had a growth surge in the last three months and the first positive values since July 2013. During the recession Mexico declined by less than the US and bounced back by more during the recovery. This caused Mexico’s production share to surge until Mid-2011 at the expense of the US.
The percentage of light trucks in the production mix of all three countries has been increasing, driven by consumer buying preferences as described above. However in February, March and April, the share of autos in Mexico’s product mix increased by 2.0 percent in February, 2 percent in March and another 1.3 percent in April. The change in preference for light trucks tends to favor the US and Canada over Mexico because the mix of light vehicles is so different by country (Figure 8).
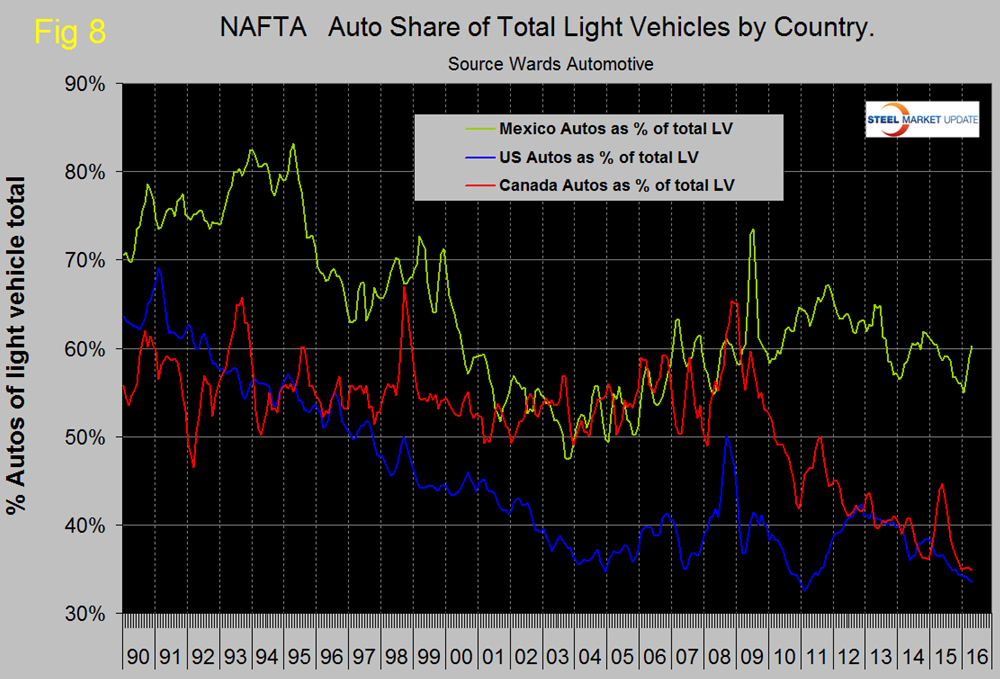
The percentage of autos in the Mexican mix in the last three months was 60.2 percent but only 33.5 in the US and 34.9 percent in Canada. This means that Mexico has staked out a higher relative capacity in autos which will serve it well when gas prices eventually rebound.
Ward’s Automotive reported this week that total light vehicle inventories in the US increased by 5 days of sales in April to 70 days which was 5 days more than April last year. Month over month FCA (Fiat Chrysler Automotive) was up by 2 days to 84, Ford was up by 7 to 87 and GM was unchanged at 71 days.
The SMU data file contains more detail than be shown here in this condensed report. Readers can obtain copies of additional time based performance results on request if they wish to dig deeper. Available are graphs of auto, light truck and medium and heavy truck production and growth rate and production share by country.


