

Market Data
June 19, 2016
Rig Count Rises for 3rd Week
Written by Peter Wright
The price of oil and natural gas have much to do with sales of oil country tubular goods (OCTG) and related steel products. The energy markets represent a large portion of the hot rolled coil used to make pipe and tube, storage facilities as well as equipment used to drill and pump oil and natural gas.
Figure 1 shows historical oil and gas prices since January 2000. The daily spot price of West Texas Intermediate, (WTI) closed at $48.89 on June 13th having been above $50 on the 7th through the 9th according to the latest daily figures available from the Energy Information Administration (EIA). Brent closed at $49.36 on June 13th.
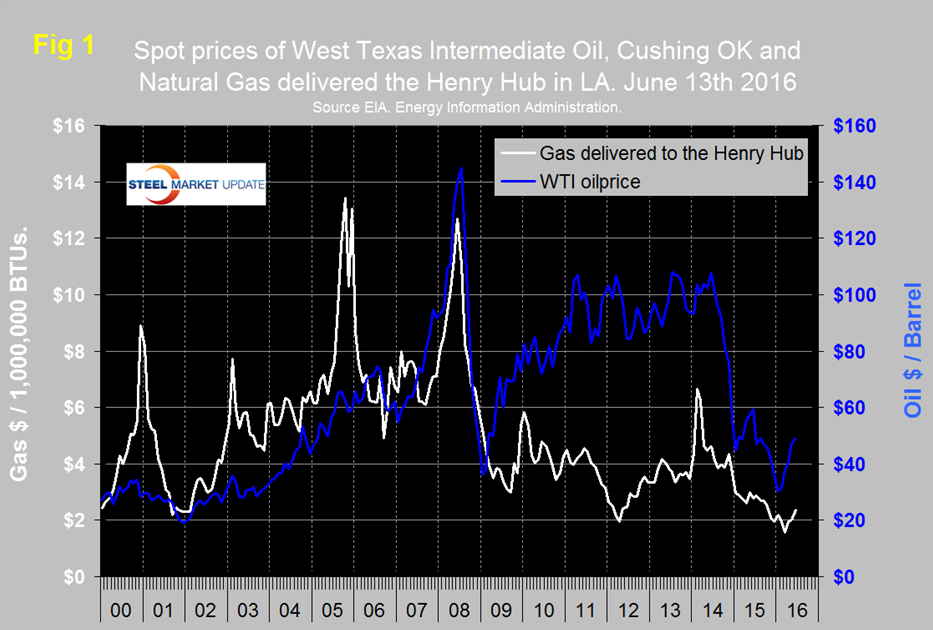
On May 9th the Wall Street breakfast had this to say about goings on in the global oil market: Saudi Arabia has replaced Ali al-Naimi, who had been oil minister since 1995, with Khalid al-Falih, chairman of state-owned oil company Aramco. Prior to the June OPEC meeting Khalid al-Falih put an end to decades of Saudi oil strategy, confirming a shift towards a lower price point. Al-Falih said: “I think managing in the traditional way that we tried in the past may never come again.”
By allowing the market, to “self-balance,” Falih is, in effect, crushing high-cost producers. To be sure, exploration of development costs for shale continue to fall, but a prolonged period of low prices below $50-$60 will cause the shale supply route to fall for at least another year.
Saudi Arabia can also use low oil prices to weaken Iran’s power in the region, and further push the kingdoms goals. Saudi Arabia is the most financially secure of all OPEC nations. As a result, they are the ones holding the cards for the cartel. Falih stated that total Saudi Production capacity, at the moment, sits at about 12.5 million barrels per day; approximately 2.3 million BPD above current rates. Plenty of spare capacity lies in wait for a willing market. This comes with the obvious caveat that spending must continue. However, with Saudi drilling rigs at all-time highs, there is no doubt that is the case.
After the Bi-Annual meeting of OPEC on June 2nd, Andrew Hecht wrote: Since the price of crude oil began to drop in 2014, it has been the Saudi position that shale oil production was the cause. The Saudi-led campaign was to pump up output and crush the price of oil to a level where shale production from North America became uneconomic, building market share for themselves and other OPEC members for the future.
The comments after the June 2 meeting were mostly upbeat with oil ministers presenting a united front that the strategy is working. U.S. production continues to fall, and rig counts in North America stood at 316 as of May 27. When oil was north of $100 per barrel, more than 2000 were in operation. The oil ministers finally decided at the meeting that no production ceiling is presently necessary and that the fall in U.S. output and rise in price is a sign that their strategy has been successful. In a surprising show of unity, the Iranian oil minister Bijan Zanganeh said, “The atmosphere in today’s meeting was calm without any tensions.” It seems that everyone went home from the biannual meeting happy this time. Market fundamentals are looking better, and the price is rising. The Iranians can continue to increase output, and other producing members will benefit from prices higher than in February when panic set in. Additionally, OPEC can claim a victory as their strategy appears to be working cementing the Saudi role as leader of the cartel and manager of the international petroleum market.
The price of natural gas, delivered the Henry Hub in Louisiana, closed at $2.36/MM BTS on June 10th, up from $1.57 on March 4th. June 10th was the latest data published by the EIA. The price has been trending down for two years and it remains to be seen if this recent increase is just a blip but the fact that oil and gas are trending together is encouraging. Natural gas is expected to fuel the largest share of electricity generation in 2016 at 33 percent, compared with 32% for coal. In 2017, natural gas and coal are both forecast to fuel 32 percent of electricity generation.
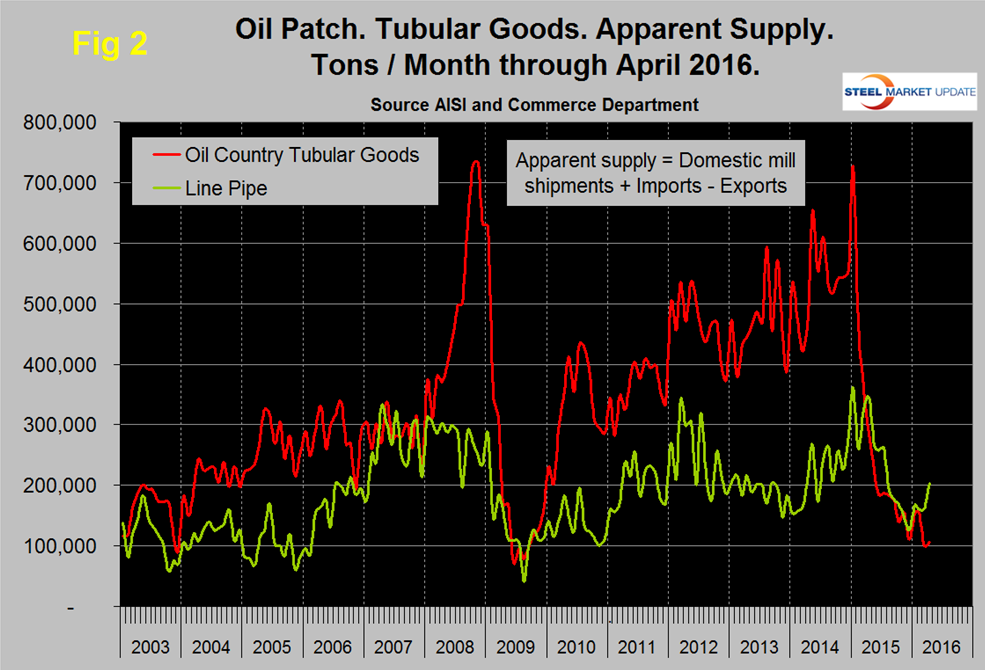
Figure 2 shows the apparent supply of the two main steel tubular products used in oil and gas production from January 2003 through April 2016 (Apparent supply is a proxy for demand.) Following a weak December, line pipe demand has coincided with the rising oil price but OCTD took another dive in March to its lowest post-recession level with a small uptick in April.
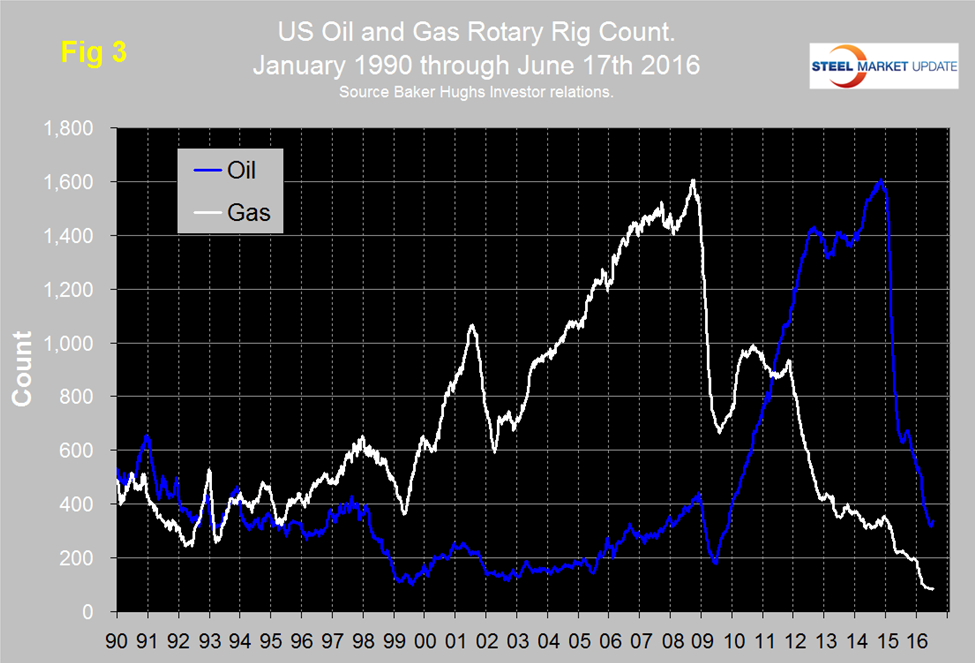
The total number of operating rigs in the US and Canada on June 17th was 491, down from 871 at the start of 2016 and down from 2,018 on January 2nd 2015. However the rig count has risen for three straight weeks from 445 on May 27th. The oil rig count was up in both the US and Canada in the last three weeks and the gas rig count was up in Canada but not in the US. Figure 3 shows the Baker Hughes US Rotary Rig Counts for oil and gas equipment in the US through June 17th. (Explanation below). The small uptick in the US oil rig count was the first since July of last year presumably driven by the oil price breaking through $50. Based on the most recent available data, the EIA estimates that oil production from hydraulically fractured wells now makes up about half of total U.S. crude oil production. U.S. crude oil production averaged an estimated 9.4 million barrels per day (b/d) in 2015, and it is forecast to average 8.7 million b/d in 2016 and 8.2 million b/d in 2017. The decline in the gas rig count has leveled off with very little change in the last seven weeks. However the number of operating rigs in that time frame is lower than at any time since our data began in January 1988.
On a regional basis in the US, the big three states for operating rigs are Texas, Oklahoma and North Dakota. Texas at 191 on June 17th was back to where it was on April 15th but down from 318 at the beginning of the year, Oklahoma at 58 has seen only an increase of one in the last six weeks and was down from 87 at the beginning of the year. North Dakota at 24 on June 17th was down from 53 at the beginning of the year and also up by only one in the last six weeks. On June 18th Orangutan Capital had this to say: An increase in oil rigs has resulted from producers trying to take advantage of $50/barrel oil. This week’s nine oil rig increase puts the rise over the last three weeks to 21 new oil rigs. Of the new rigs, three were horizontal, which pushes the additions over the last three weeks to twelve (not all of them necessarily oil rigs). Apart from an increase in oil rigs in the Permian basin, the quintessential oil producing basin in the country, there were a total of six rigs added in the Barnett and Haynesville basins. These basins are known primarily for being rich in natural gas, rather than oil, and the resulting production flow will turn out to be very gassy. Even if these new rigs were classified as oil rigs, we suspect that these additions have as much to do with producers taking advantage of $2.6/mcf natural gas than taking advantage of $50/bbl oil.
About the Baker Hughes Rotary Rig Count: These are a weekly census of the number of drilling rigs actively exploring for or developing oil or natural gas in the United States. Rigs are considered active from the time they break ground until the time they reach their target depth and may be establishing a new well or sidetracking an existing one. The Baker Hughes Rotary Rig count includes only those rigs that are significant consumers of oilfield services and supplies.


