

Analysis

June 20, 2016
US Vehicle Sales and NAFTA Vehicle Production through May 2016
Written by Peter Wright
Light vehicle (LV) sales in May were 17.5 million units, about the same as April but down from 17.8 million in May last year. All sales numbers in this analysis are at a seasonally adjusted annual rate. Figure 1 shows the auto and light truck components since January 2004.
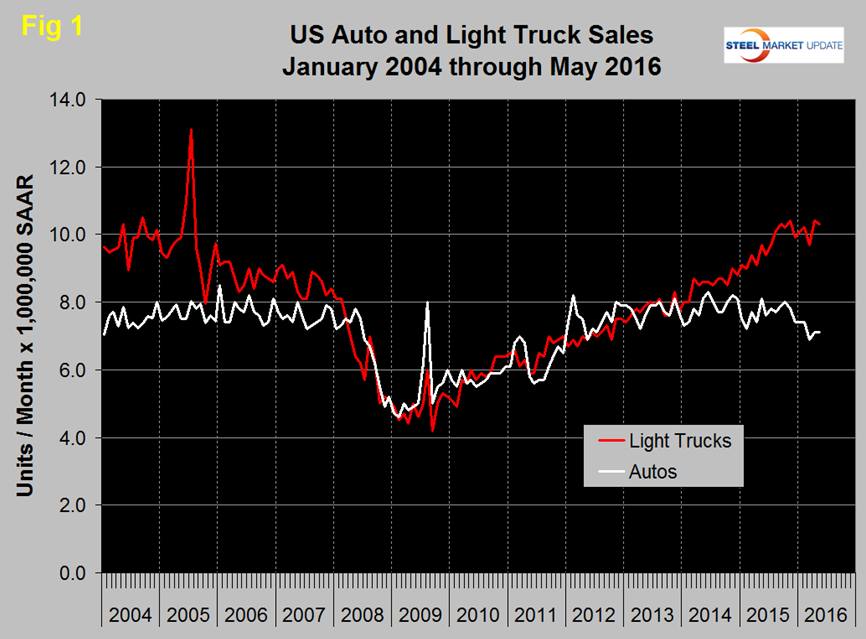
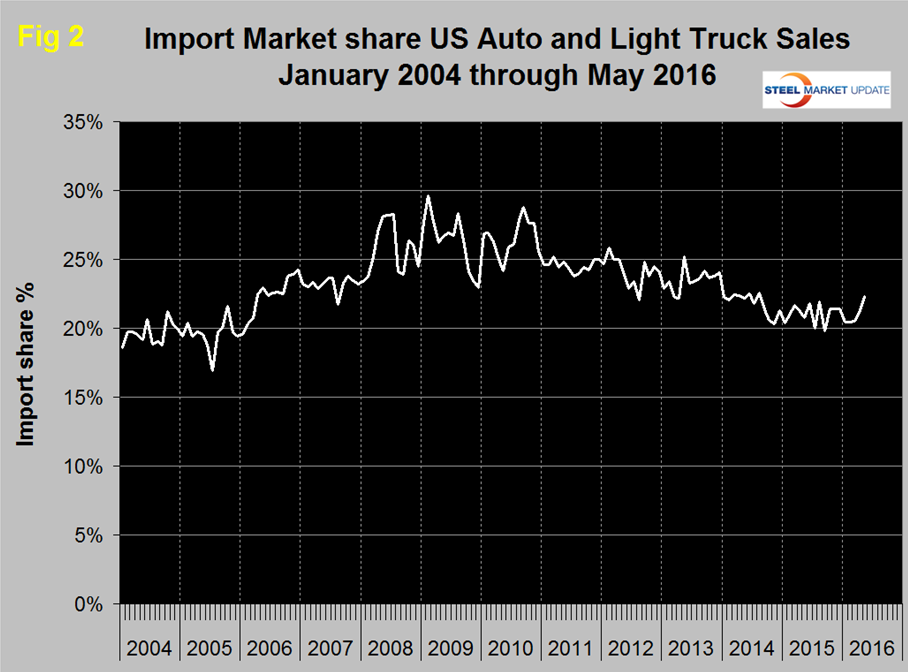
In May, auto sales were the same as April at 7.1 million units, as light trucks declined from 10.4 million to 10.3 million. The mix was 58.9 percent light trucks which includes crossovers and 41.1 percent autos. Of the major manufacturers, Toyota and Nissan had sales increases as Ford, Chrysler, Honda and GM saw their sales decrease. Economy.com believes that LV sales are still higher than the consumer fundamentals suggest and that sales will begin to decline next year to 16.5 million units. Import market share in May was 22.3 percent up from 22.3 percent in April (Figure 2).
Total light vehicle (LV) production in NAFTA in May was at an annual rate (not seasonally adjusted) of 17.49 million, down from 18.3 million in April and 18.85 million in March. Total production in 2015 was 17.36 million units and in the first five months of this year was 17.99 million units annualized. In cases where seasonality is more than a weather effect we like to compare the monthly result with the monthly norm over a number of years. On average since 2004, May’s production has been 2.4 percent higher than April but this year production declined by 4.5 percent (Figure 3).
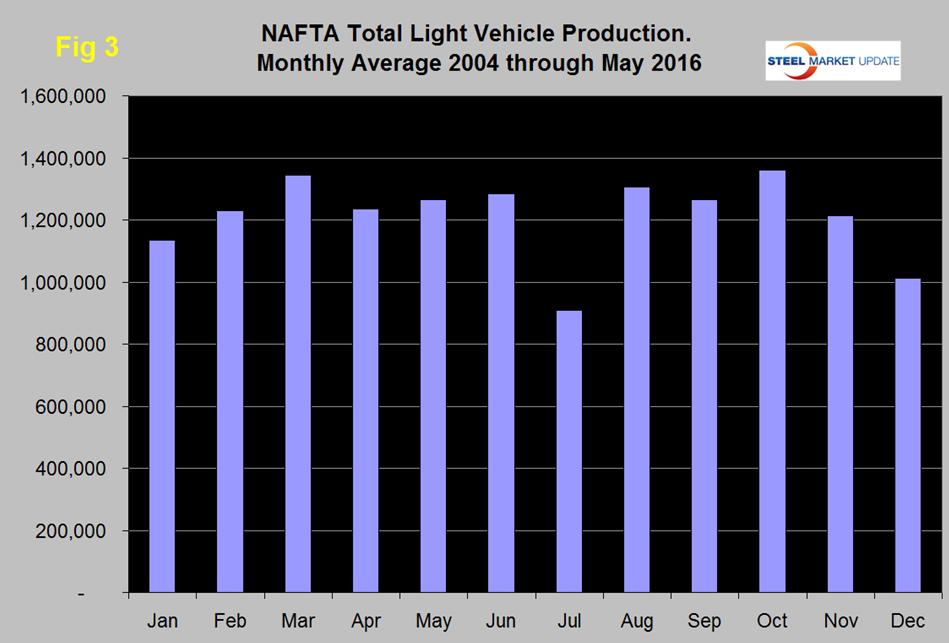
Reminder: These production numbers are not seasonally adjusted, the sales data reported above are seasonally adjusted.
On a rolling 12 months basis y/y through May, LV production in NAFTA increased by 3.4 percent down from 4.1 percent in 12 months through February but consistent with the growth experienced in the last 12 months as indicated by the brown bars in Figure 4.
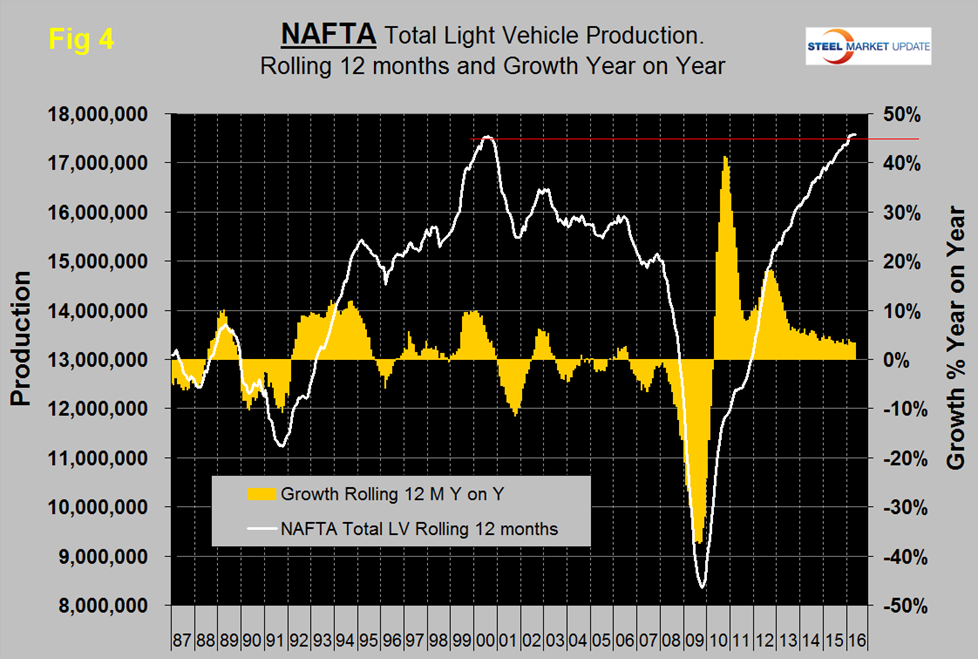
On this basis, production has been at an all-time high for the last four months. On a rolling 12 months basis year over year, the US was up by 3.6 percent with negative momentum, Canada was up by 7.1 percent with very positive momentum and Mexico was up by 0.4 percent with negative momentum (Table 1).
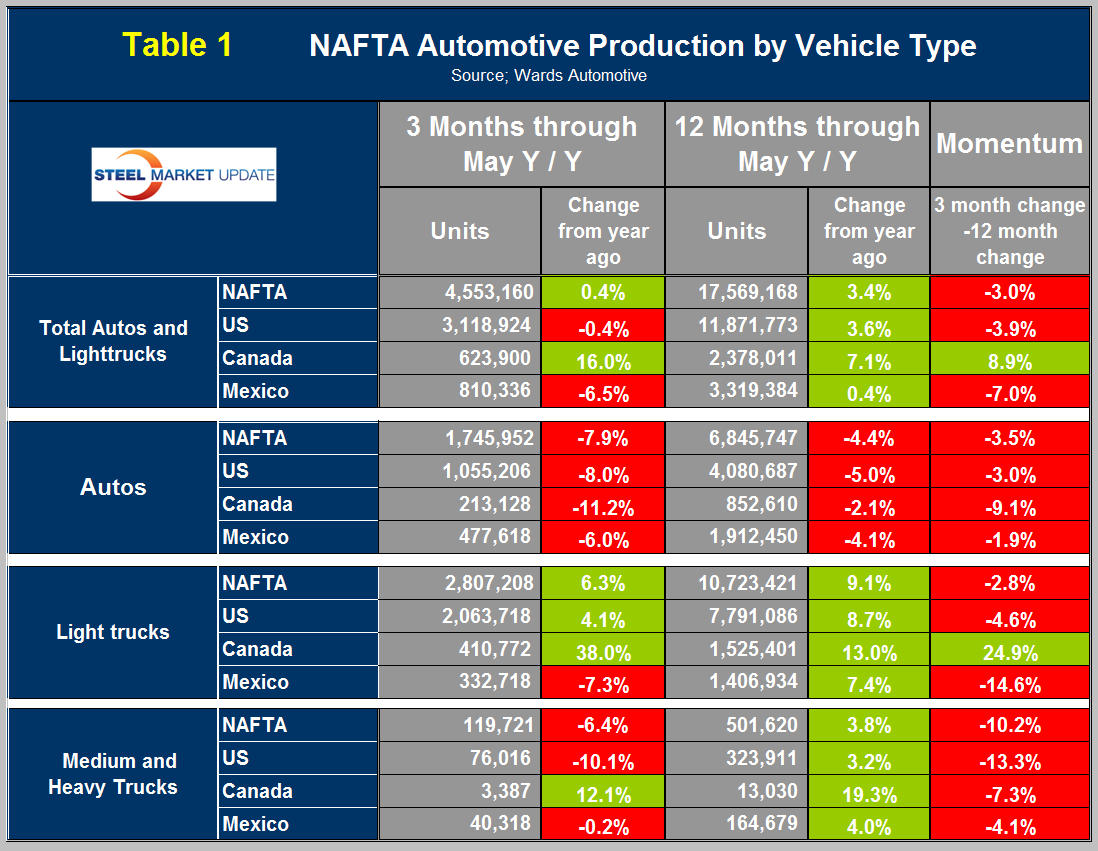
Mexico has had negative momentum for thirteen straight months as Canada has had very strong momentum for the last five months. The US has gained production share in the most recent 3 ½ years (Figure 5) at the expense of Canada though that trend has slowed in the last 12 months when Canada picked up the pace.
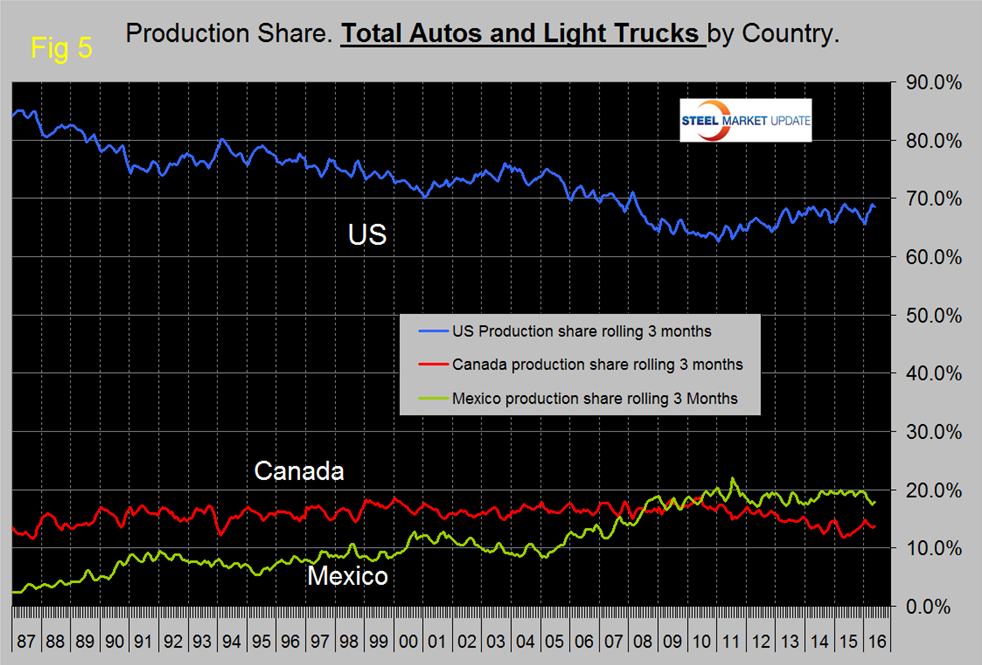
Mexico’s share has been fairly flat for five years and has declined in 2016. In May on a rolling three month basis, the US production share of total light vehicles was 68.5 percent, down from 69.0 percent in April, Canada’s was 13.7 percent (up 0.2 percent), and Mexico’s was 17.8 percent (up 0.4 percent). Production in Mexico in 2014 was 3.2 million units and in 2015 was 3.4 million units. The production target for 2020 in 5.0 million units according to Eduardo Solis, president of the Mexican Automotive Industry Association.
Figures 6, 7 and 8 show total LV production by country with y/y growth rates and on each the red line shows the change in production since Q2 2006.
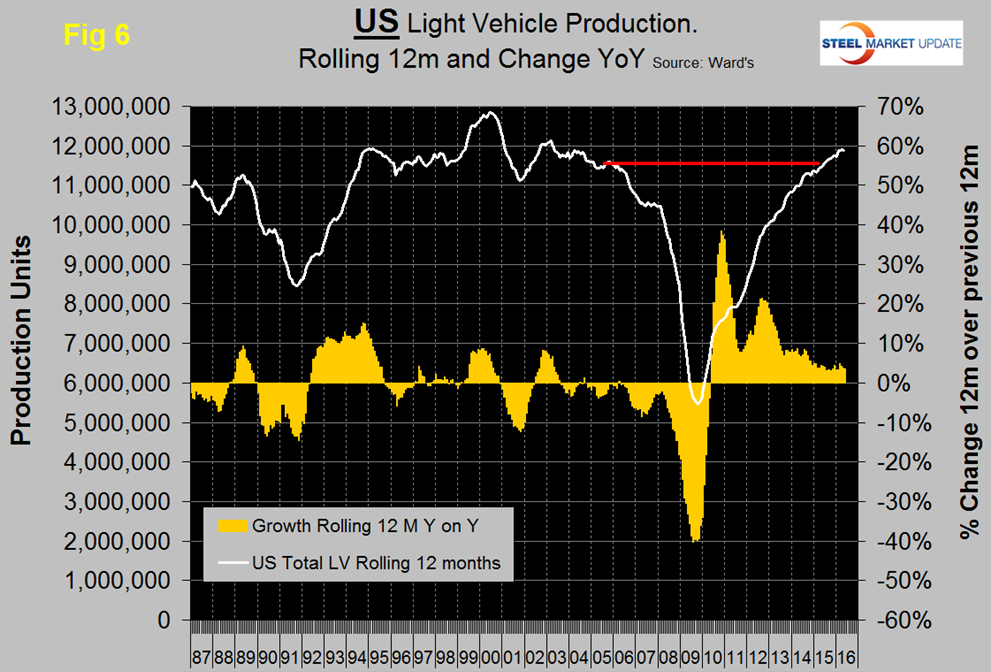
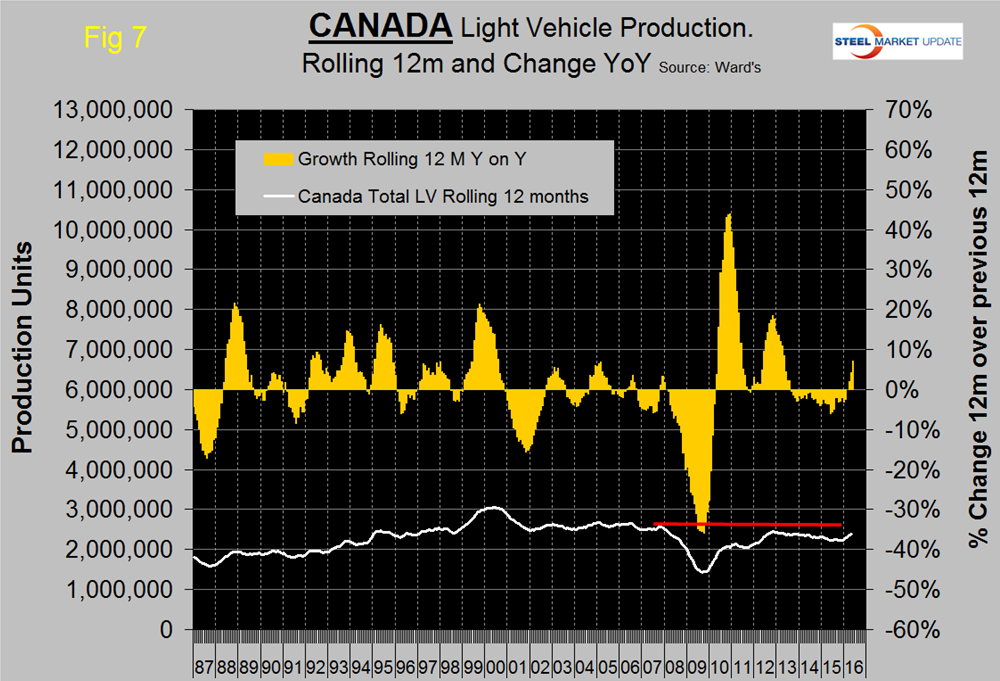
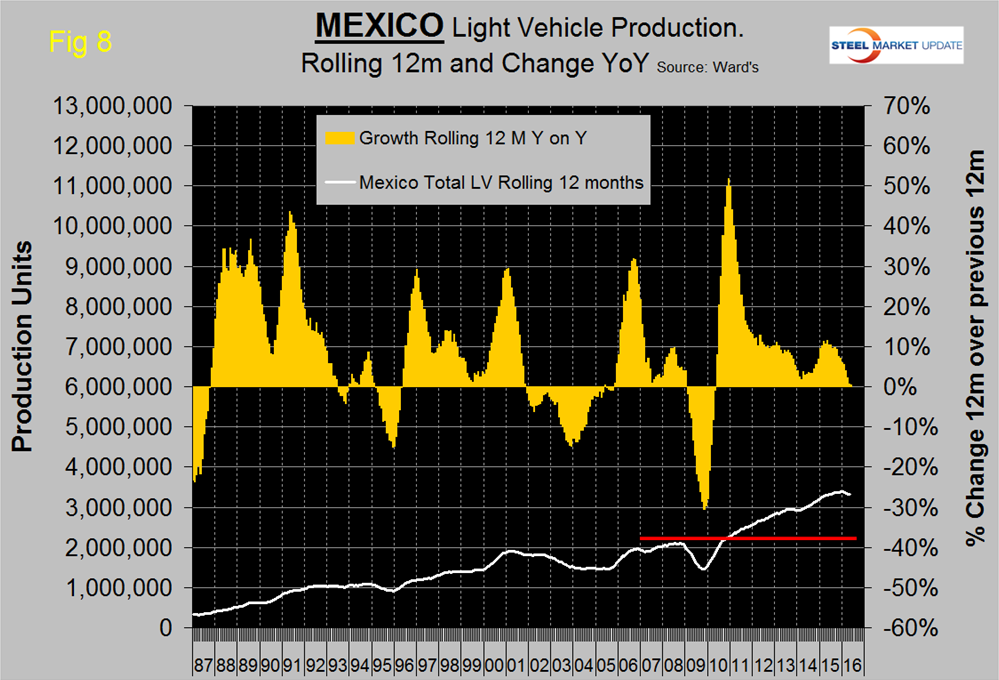
Note the scales are the same to give true comparability and that Mexican growth has slowed significantly this year and is now the lowest in NAFTA. Canada has had a growth surge in the last four months and the first positive values since July 2013. During the recession Mexico declined by less than the US and bounced back by more during the recovery. This caused Mexico’s production share to surge until Mid-2011 at the expense of the US.
Figure 9 shows the percentage of autos in the light vehicle production of each country.
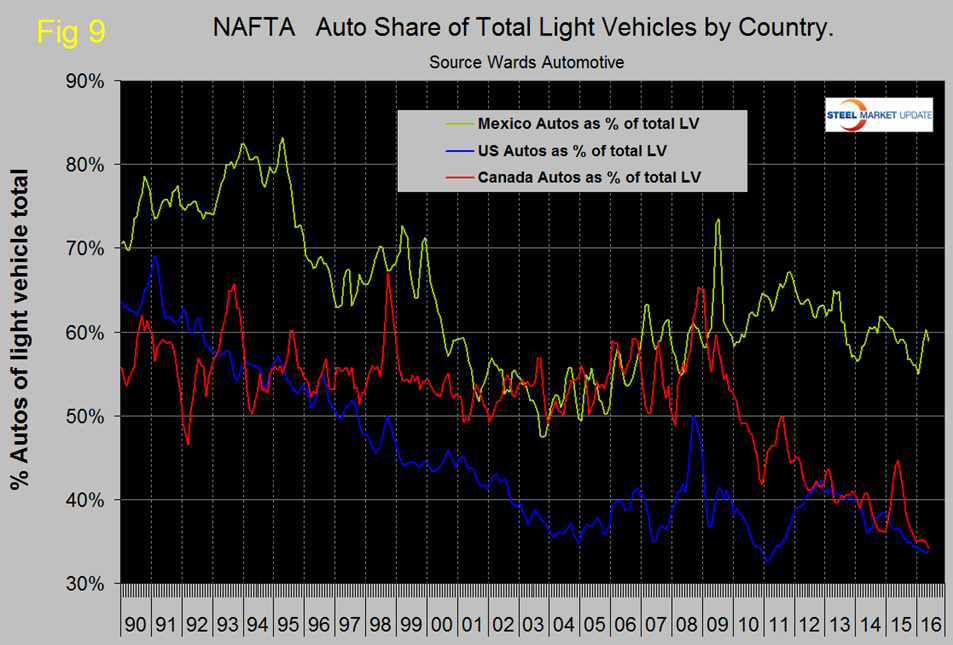
The percentage of autos in the production mix of all three countries has been declining, driven by consumer buying preferences which in turn are heavily influenced by gas prices. The change in preference for light trucks tends to favor the US and Canada over Mexico because the mix of light vehicles is so different by country. The percentage of autos in the Mexican mix in the last three months was 58.9 percent but only 33.8 in the US and 34.2 percent in Canada. This means that Mexico has staked out a higher relative capacity in autos which will serve it well when gas prices eventually rebound.
Ward’s Automotive reported this week that total light vehicle inventories in the US declined by 11 days of sales in May to 59 days which was 3 days more than May last year. Month over month FCA (Fiat Chrysler Automotive) was down by 13 days to 71, Ford was down by 14 to 73 and GM was down by 4 to 67 days.
The SMU data file contains more detail than we show here in this condensed report. Readers can obtain copies of additional time-based performance results on request if they wish to dig deeper. Available are graphs of auto, light truck and medium and heavy truck production and growth rate and production share by country.


