

Market Data

June 29, 2016
Gross Domestic Product First Quarter 2016 Third Estimate
Written by Peter Wright
The annualized GDP growth rate in the third estimate of the first quarter of 2016 was 1.08 percent, up from 0.83 percent in the second estimate and from 0.53 percent in the first estimate. The first quarter result was down from 1.38 percent in Q4 last year. Normally there are two revisions of the first estimate and sometimes three. Revisions to the four quarters of 2015 were +0.4 percent, +1.59 percent, +0.5 percent and +0.69 percent respectively. GDP is measured and reported in chained 2009 dollars and in the third estimate of Q1 was $16.515 trillion. The growth calculation is misleading because it takes the Q over Q change and multiplies by 4 to get an annualized rate. This makes the high quarters higher and the low quarters lower. Figure 1 clearly shows this effect.
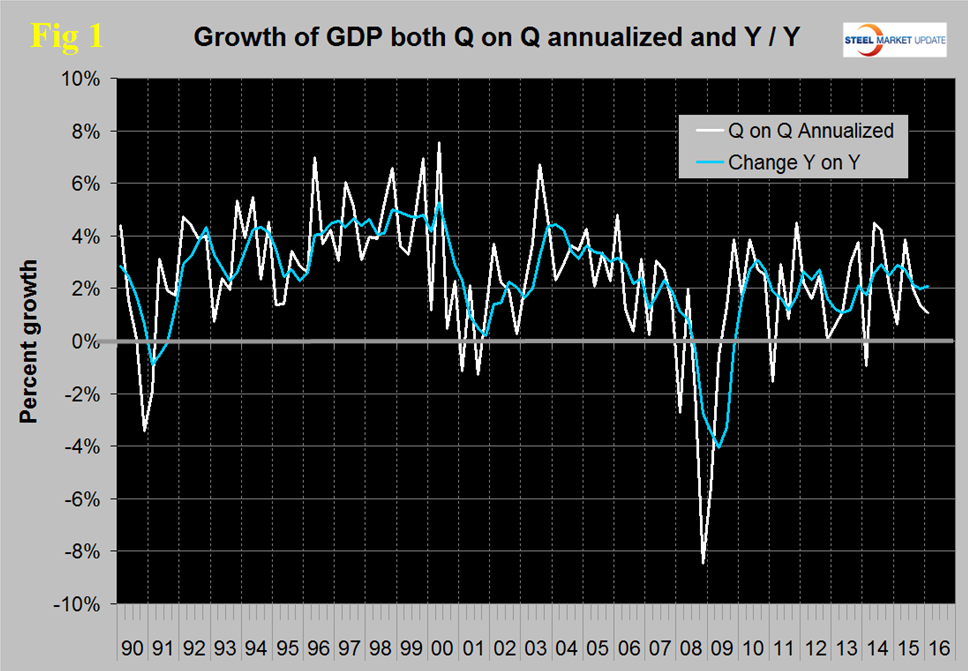
The blue line is the trailing 12 months growth and the white line is the headline quarterly result. On a trailing 12 month basis, GDP was 2.09 percent higher in the first quarter of 2016 than it was in Q1 2015. In the last five years, since Q1 2011 the trailing 12 month growth of GDP has ranged from a high of 2.88 percent to a low of 1.07 percent therefore the latest result is central within this variability. In 7 of the last 9 years, Q2 GDP has been sharply up over Q1. The BEA has been criticized for the accuracy of its seasonal adjustment in the past and has attempted to improve in particular the accuracy of its first quarter reports. It looks as though once again we can expect a surge in the current quarter.
Figure 2 shows the headline quarterly results since 1990 and the latest IMF forecast through 2020. In their April revision, the IMF downgraded their forecast of US growth in 2016 from their October estimate of 2.84 percent to 2.4 percent and downgraded 2017 from 2.80 percent to 2.50 percent.
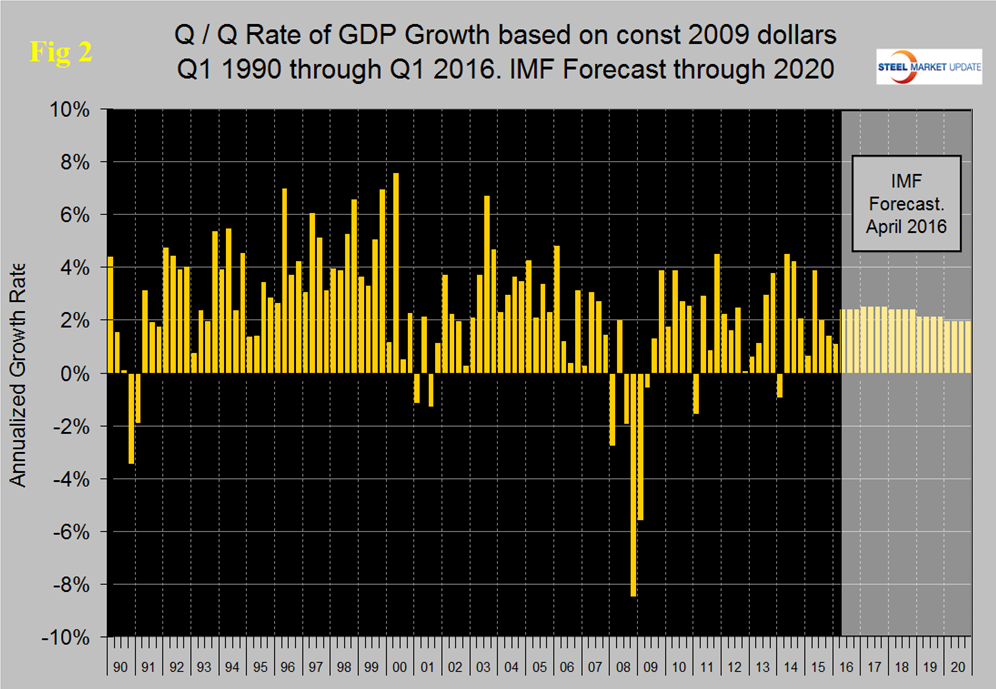
Historically it has been necessary to have about a 2.5 percent growth in GDP to get any growth in steel demand so this latest estimate of GDP doesn’t suggest any significant change in steel demand in the immediate future. This relationship is a long term average and in reality steel is extremely more volatile than GDP. If GDP takes a dive then steel demand craters and if GDP takes a sudden upturn steel soars. Neither of these extremes is evident at present.
There are six major subcomponents of the GDP calculation and the magnitude of these is shown in Figure 3.
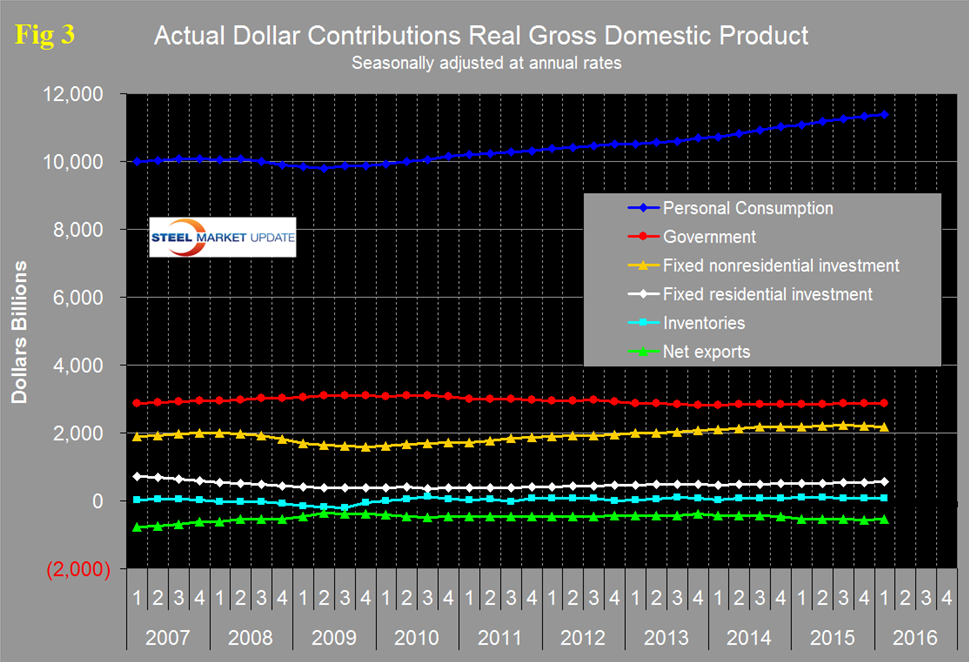
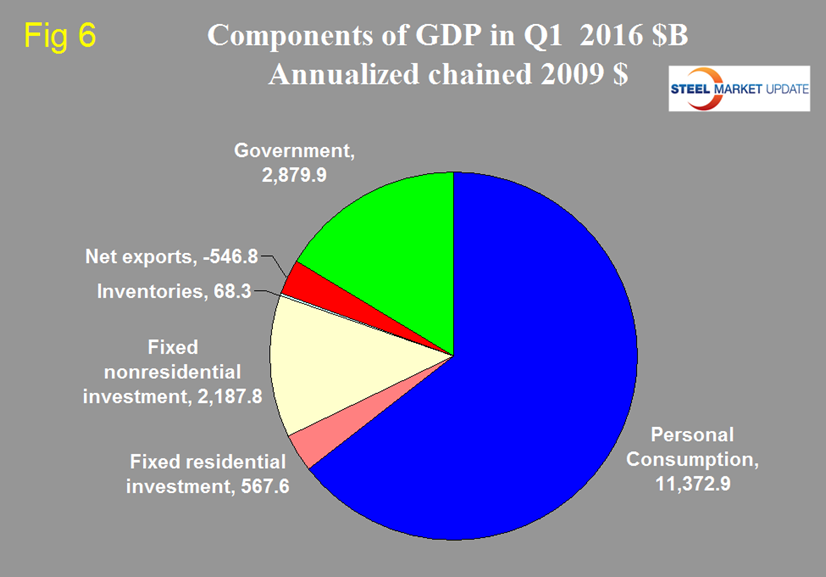
Personal consumption accounted for 68.87 percent of the total in the latest data. Figure 4 shows the change in the major subcomponents of GDP in Q1 2016 and the dominance of personal consumption as a growth driver.
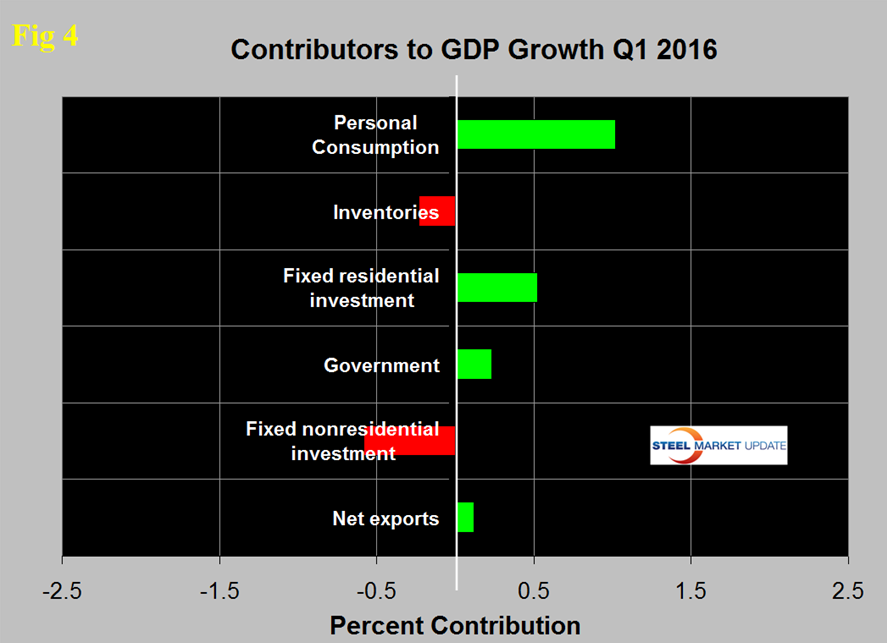
The change in fixed nonresidential investment was the greatest detractor, this includes nonresidential buildings and infrastructure which in the Commerce Department’s CPIP construction report did well in the first quarter. The BEA data for GDP is seasonally adjusted and in our CPIP analysis we have a choice to examine either seasonally adjusted or non-adjusted data. We choose to consider only non-seasonally adjusted data therefore we have introduced a discrepancy in government data from different departments. Declining inventories have a negative effect on the overall GDP calculation and this was the case in the first quarter. Over the long run inventory changes are a wash and simply move growth from one period to another. Net exports made a positive contribution in Q1 and added 0.12 percent. Since US trade is net negative we don’t understand this result but we reproduce here what was reported. Figure 5 shows the contributors to GDP extended back through Q1 2007 and describes the quarterly change in the six major subcomponents.
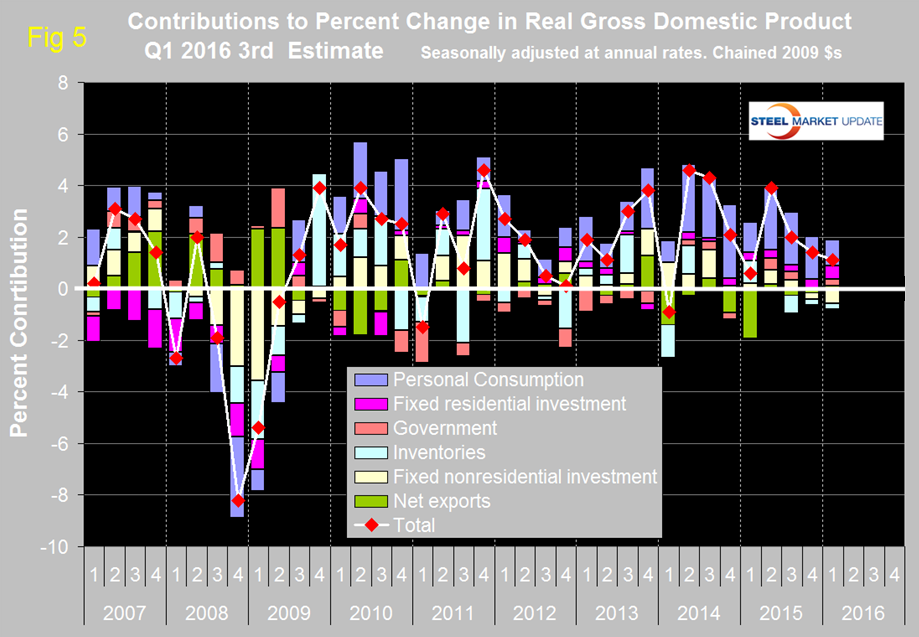
Prior to the latest three quarters of data, the last time that inventories made a major negative contribution was Q1 2014. The contribution of personal consumption at 1.02 percent was down from 1.66 percent in the 4th quarter. Personal consumption includes goods and services, the goods portion of which includes both durable and non-durables. Government expenditures contributed 0.23 percent to growth in Q1 up from 0.02 percent in Q4. The contribution of fixed residential investment at 0.52 percent in Q1 was up from 0.33 percent in Q4 and has been fairly consistent and positive for the last eight quarters. The contribution of fixed nonresidential investment has been more variable and has declined in each of the last two quarters. Inventories which had contributed negative 0.22 percent in Q4 contributed negative 0.23 percent in Q1. Figure 6 shows the breakdown of the $16 trillion economy.
SMU Comment: First quarter data of GDP from the BEA has been notorious in recent years for the inaccuracy of seasonal adjustment. There have been attempts to remedy this and last year the upward revision was only 0.4 percent. We have observed frequently in our SMU reports that steel demand has not been where it should be based on several previously indicative benchmark indicators and that a decline in inventories throughout the supply chain was likely a major contributing factor. This GDP data would seem to be supportive of that view as an inventory reduction has detracted from GDP since H1 2015.
Last week the IMF reviewed the performance of the US economy and we thought it would be worthwhile to provide this external perspective for our subscribers so here goes:
Managing Director Christine Lagarde’s Opening Remarks for the United States 2016 Article IV Press Conference
Welcome to all of you for this briefing on the 2016 United States Article IV Consultation. By now, you will have seen our concluding statement which covers the range of fiscal policies, monetary policy, and the financial sector.
At the outset, I would like to emphasize we think that the U.S. economy is in good shape, despite some setbacks in very recent months. Unemployment is well below 5 percent, in the past year an average of 200,000 new jobs were created every month, and household incomes are rising at a healthy clip.
Having said this, today we will look beyond the important recent achievements and look forward to what will be needed to ensure strong, sustained and balanced growth in the years ahead. I would highlight in particular “four forces” that pose a challenge to future growth.
What are those four forces? Declining labor force participation, falling productivity growth, polarization in the distribution of income and wealth, and high levels of poverty in the U.S. Let me elaborate.
First, labor force participation is declining.
- The U.S. population is aging and, as a result, a smaller share of the population will be active in the labor force in the coming years.
- The workforce makes up the backbone of the U.S. economy. Mitigating the effects of population aging on labor supply and demand should therefore be a priority – both here in the U.S. but also in many of the advanced economies.
Second, productivity growth has also declined.
- It has fallen from 1.7 percent in the decade prior to 2007 to 0.4 percent in the past five years.
- Much of the gains in average per capita incomes in the 20 years before the financial crisis were from gains in productivity, innovation, and efficiency.
- The fall in productivity growth seems, at least in part, to be linked to falling dynamism both in the U.S. labor markets and in the formation of new and productive enterprises.
Third, the distribution of income and wealth has steadily become more and more polarized. This is a double edged sword.
- On the one hand, since 2000 around one quarter of a percent of the population has moved from earning close to the median income to earning 1.5 or more times the median. This is a good thing and has raised living standards for those families.
- On the other hand, though, more than 3 percent of the population has moved into the group that earns less than half of the median income. For that group, economic insecurity and flat real incomes have resulted in either a stagnation or decline in living standards.
- Our calculations suggest that since 1999, this polarization of the income distribution has knocked around 3½ percent off of badly needed consumer demand. That is around one year’s consumption over a period of 15 years.
Fourth, the share of the population living in poverty is at very high levels.
- The latest data shows almost 15 percent of Americans—or 46.7 million people—living in poverty.1 Poverty is even higher for certain minority groups; for single parent (and particularly female-headed) households; for children; and for those with disabilities.
- With such a large share of the population living below the poverty line, this undoubtedly is an important macroeconomic issue.
- Not only does poverty create significant social strains, it also eats into labor force participation, and undermines the ability to invest in education and improve health outcomes. By holding back economic and social mobility, it creates an inter-generational persistence of poverty.
All in all, our assessment is that, if left unchecked, these four forces—participation, productivity, polarization, and poverty—will corrode the underpinnings of growth (both potential and actual) and hold back gains in U.S. living standards.
What are the policies needed to counter these “forces”? We have outlined a range of possible options. Let me highlight a few:
- Policies need to help lower income households – including through a higher federal minimum wage, more generous earned income tax credit, and upgraded social programs for the nonworking poor.
- There is a need to deepen and improve the provision of reasonable benefits to households to give incentives for work, raise the labor supply, and to support families. This should include paid family leave to care for a child or a parent, childcare assistance, and a better disability insurance program. I would just note that the U.S. is the only country among advanced economies without paid maternity leave at the national level and U.S. female labor force participation is 12 percent lower than that for men. Sensible skills-based immigration reform could also raise the labor supply and boost productivity.
- Boosting productivity growth is another policy imperative. Productivity gains must inherently be based in the private sector. But public policies can help. A better tax system, efforts toward more trade integration, better infrastructure, a stronger and more vocationally oriented education system would all support higher productivity growth.
None of this is easy. However, there are many good ideas out there as to how best to address these issues. And that provides a strong foundation for progress.
In conclusion, I would like to reiterate that the near-term U.S. growth prospects are good despite the recent temporary setbacks. We think that growth should be 2.2 percent this year and higher still in 2017. And by countering the “four forces” I have just described, I am confident that the U.S. can remain on the frontier of innovation and opportunity.


