

Prices

July 20, 2016
Global Steel Production in June and Forecast through 2017
Written by Peter Wright
Production in the month of June at 135,720,000 metric tons was down by 2.7 percent from May and the three month moving average (3MMA) that we prefer as a measure was down by 0.2 percent year over year. Month over month the 3MMA was down by 0.6 percent. Capacity is 2.3 billion tonnes per year and the 3MMA of capacity utilization in June was 70.7 percent. Figure 1 shows monthly production and capacity utilization since January 2000.
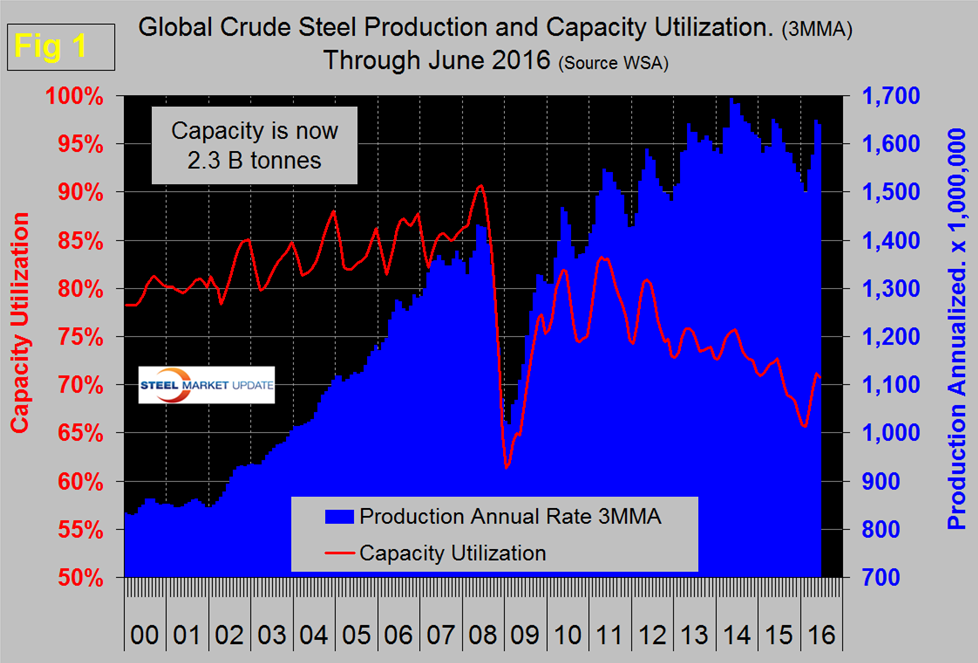
On a tons/day basis production in June was 4.378 million tonnes, down by 2.7 percent from May. Since the recession, capacity utilization has been on a steadily downward trajectory with an upward blip in the last four months. Capacity utilization in the three months through June at 70.7 percent was down from 72.7 percent in three months through June last year. Those are the bare facts presented by the WSA for production through June and it sounds as though output is headed in the right direction meaning down. As we dig deeper a different picture emerges. Our take on these numbers is that the much desired slowdown in global steel production has almost ceased on a year over year basis and that China is once again increasing output.
First we should look at seasonality. Global production has peaked in the summer for the last seven years including 2016. Figure 2 shows the average monthly production by month since 2008.
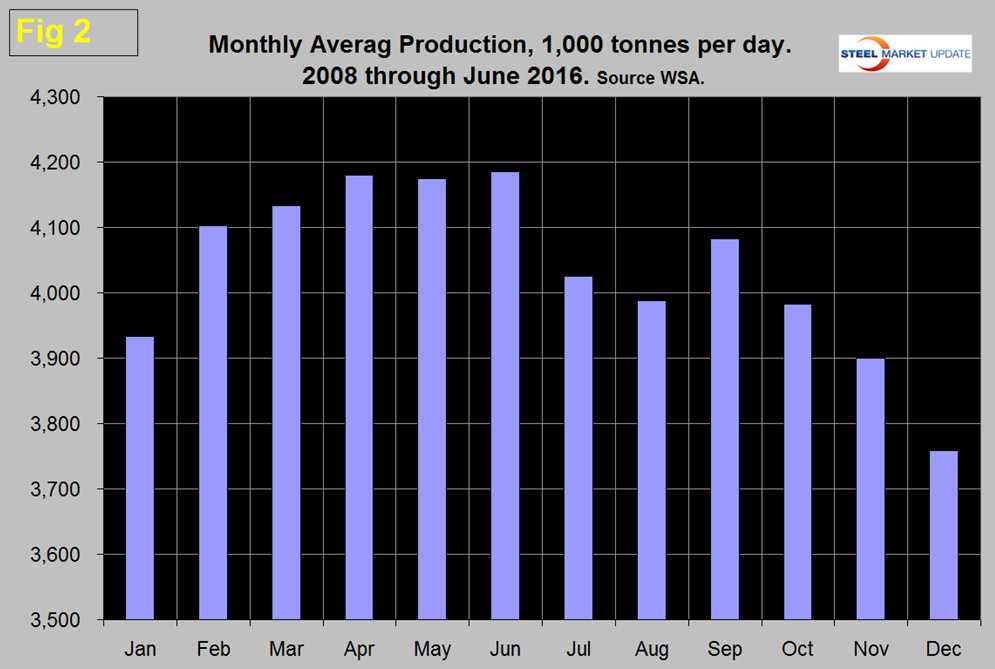
In those 11 years on average, June has increased by 0.26 percent, this year June was down by 2.67 percent. We can expect July to continue the seasonal downward trend. We believe it’s necessary to look at the year over year change in the three month moving average to get the real picture of changes in output and on this basis June was disappointing. Figure 3 shows the change in growth rate since January 2005.
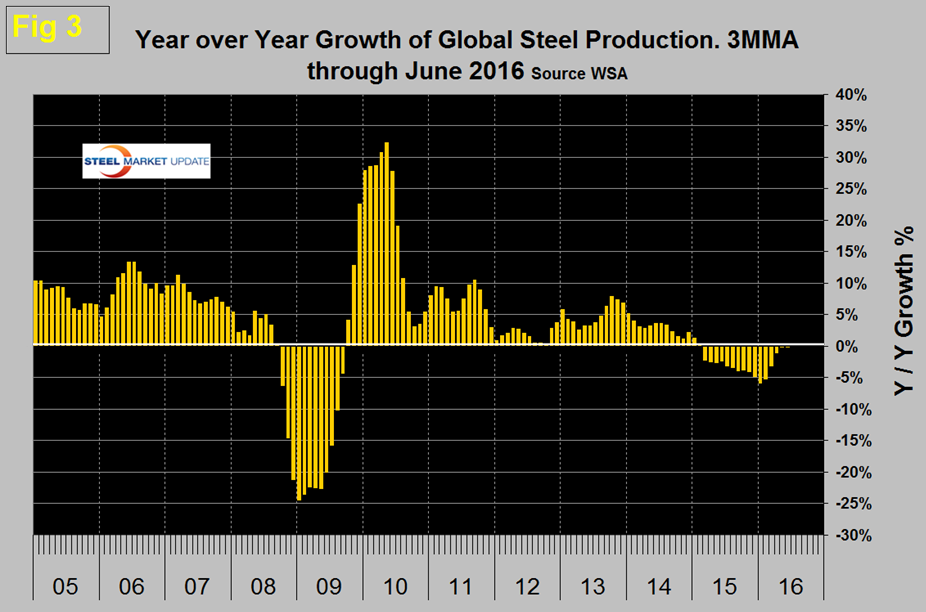
Production began to contract in March last year and the contraction accelerated through January this year when it reached 5.8 percent. In the last five months the rate of contraction has declined and reached -0.2 percent in June. It looks as though we will be back to year over year expansion in the third quarter of this year. The much celebrated slowdown in production has just about ended.
Table 1 shows global production broken down into regions and also the production of the top ten nations in the single month of June and their share of the global total. It also shows the latest three months and twelve months production through June with year over year growth rates for each. Regions are shown in white font and individual nations in beige.
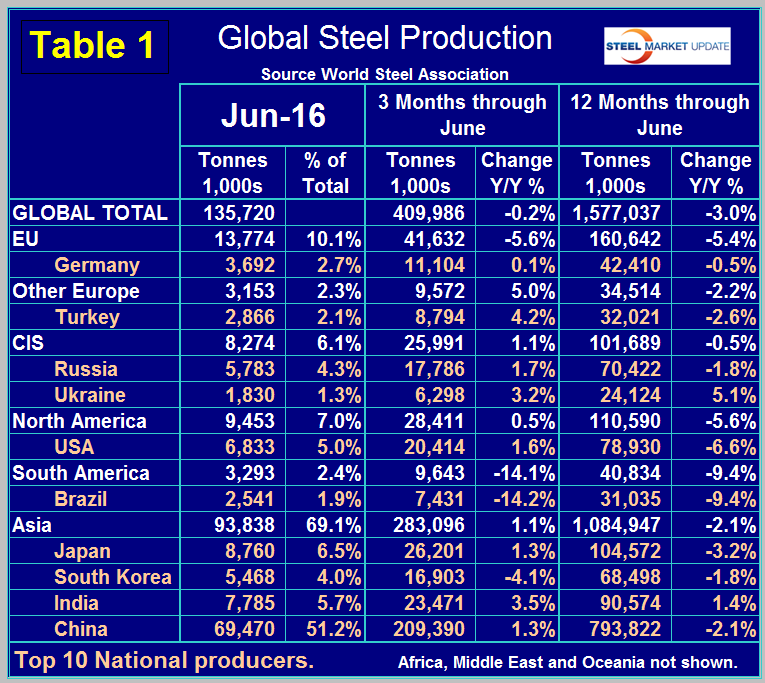
The world as a whole has negative growth of 0.2 percent in 3 months and negative 3.0 percent in 12 months through June. If the three month growth rate exceeds the twelve month we interpret this to be a sign of positive momentum and in this case of a slowdown in contraction. Momentum was negative for over 12 months through February, became positive in March at 0.2 percent was positive 2.3 percent, 2.9 percent and 2.8 percent in April, May and June respectively.
China’s production after slowing for 13 straight months on a 3MMA basis year over year returned to positive growth in May and June and accounted for 51.2 percent of global production in June. As stated above, global production had a positive growth momentum of 2.8 percent in June but China’s growth momentum was 3.4 percent in June. The slowdown in Chinese steel production that has been much written about and welcomed is NOT happening. We reported last month and will repeat it here that in March, China’s assistant commerce minister stated that China had cut 90M metric tons of capacity and had plans to reduce it by another 100M-150M. Reducing capacity is not the same thing as reducing production and there is no sign that the reported capacity reduction (if it is for real) is having any effect on output. China’s June production was the fifth highest on record at 69,470,000 tonnes. Their all-time high was 71,161,000 tonnes in June 2014. To put this into perspective with the rest of the world, on a 3MMA basis year over year through June, China had positive growth of 1.3 percent as the rest of the world contracted by 1.7 percent,
On a regional basis in 3 months through June year over year, South America and the EU declined by 14.1 percent and 5.6 percent respectively. Asia as a whole was up by 1.1 percent. Other Europe (mainly Turkey), the CIS and North America had positive growth of 5.0 percent in the latest data. North America was up by 0.5 percent in total with the US up by 1.6 percent, Canada down by 1.5 percent and Mexico up by 0.7 percent.
The October 2015 version of the World Steel Association Short Range Outlook (SRO) for apparent steel consumption in 2015 and 2016 had last year contracting at 1.7 percent and 2016 growing at 0.7 percent. What actually happened was that consumption contracted by 3.2 percent in 2015. In April this year the WSA updated its forecast. (Note this forecast is steel consumption, not crude steel production which is the main thrust of what you are reading now.) Figure 4 is a geographical view of production and growth in 2016 followed by Table 2 which shows the expectations by country and region. We will leave these two figures in our monthly updates for reference until they are revised in October.
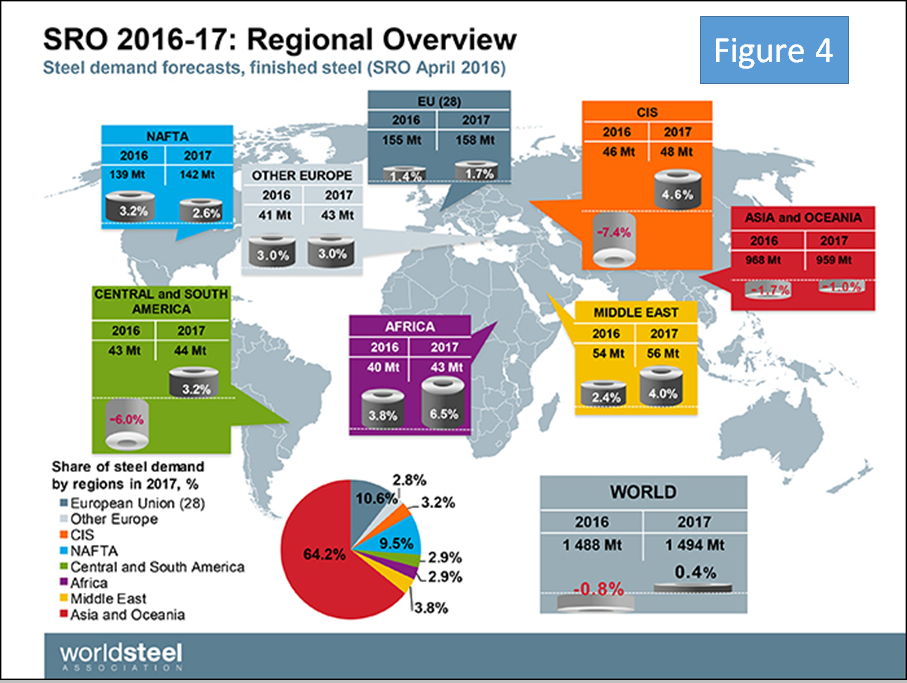
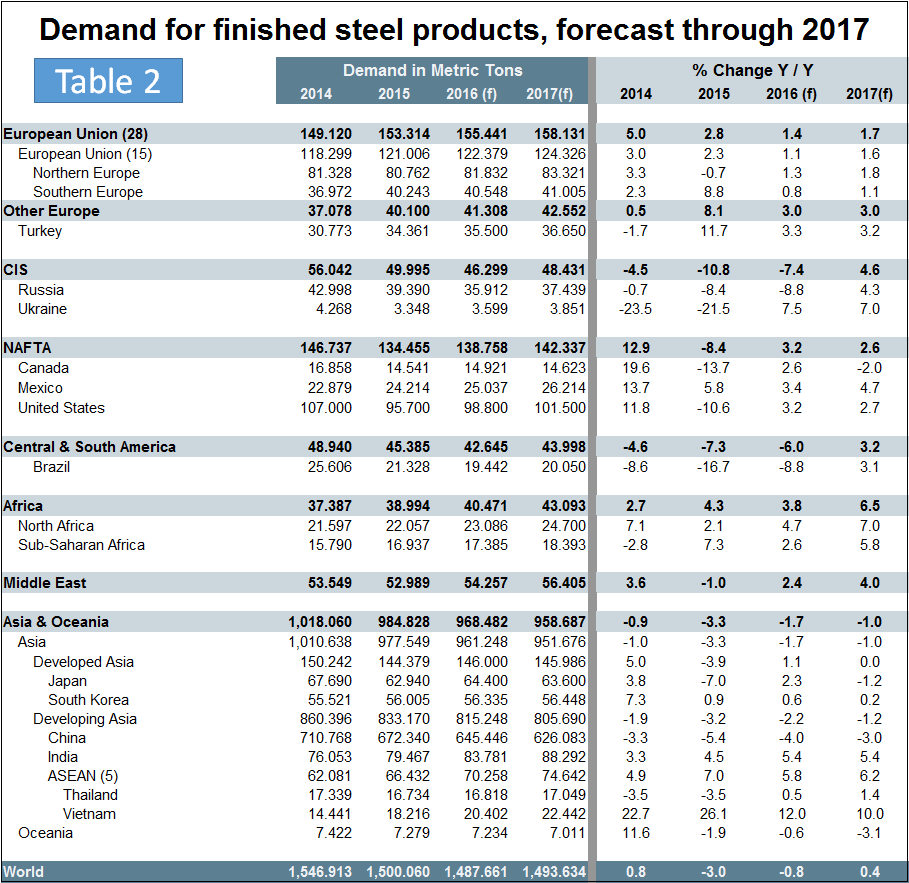
The new WSA forecast has global demand in 2016 contracting at 0.8 percent and in 2017 growing at 0.4 percent. Based on this forecast, NAFTA will grow by 3.2 percent this year and 2.6 percent next. China’s demand will decline by 4.0 percent this year and 3.0 percent in 2017 therefore if their production doesn’t decline by at least that amount the flood of exports will only increase.
SMU Comment: Evidently China is picking up the pace again as the rest of the world has contracted for 17 straight months. With a global capacity utilization of less than 70 percent in June it is evident that capacity reductions have a long way to go before they begin to reduce the market pressure of over production. We repeat what we have said for the last two months and still believe, that oversupply and low capacity utilization won’t be resolved before the end of this decade.
Source: World Steel Association with Analysis by SMU


