Market Segment

July 20, 2016
Service Center Intake, Shipments and Inventory through June 2016
Written by Peter Wright
Based on Steel Market Update (SMU) analysis of the recently released MSCI service center inventory and shipment data, total service center carbon steel shipments increased by 169,300 tons in June to 3.220 million tons. The number of shipping days increased by one to 22. On a t/d basis shipments increased from 145,200 in May to 146,300 tons in June.
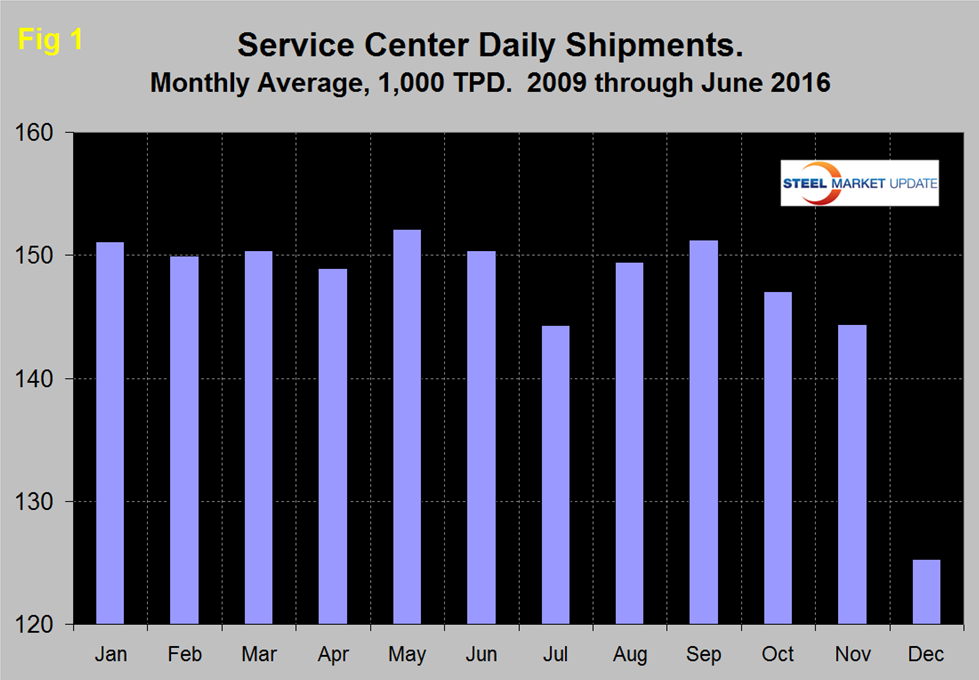
In the eight years since and including 2009, June shipments on average on a t/d basis have been down by 1.1 percent from May. This year shipments were up by 0.8 percent. Therefore on a long term basis (8 years) the June performance was at least not a deterioration with a small t/d improvement. This observation is only intended to give a long term perspective because MSCI data is quite seasonal and we need to get past that before commenting in detail on current results. Figure 1 demonstrates this seasonality and why comparing a month’s performance with the previous month is usually misleading.
In the SMU analysis we always consider year over year changes to eliminate this seasonality. Table 1 shows the performance by product in June compared to the same month last year and also with the average t/d shipments for June in the last three years. We then calculate the percent change between June 2016 and June 2015 and with the 3 year June average. Our intention is to provide an undistorted view of market direction. In June, intake at 148,600 t/d was 2,300 tons more than shipments.
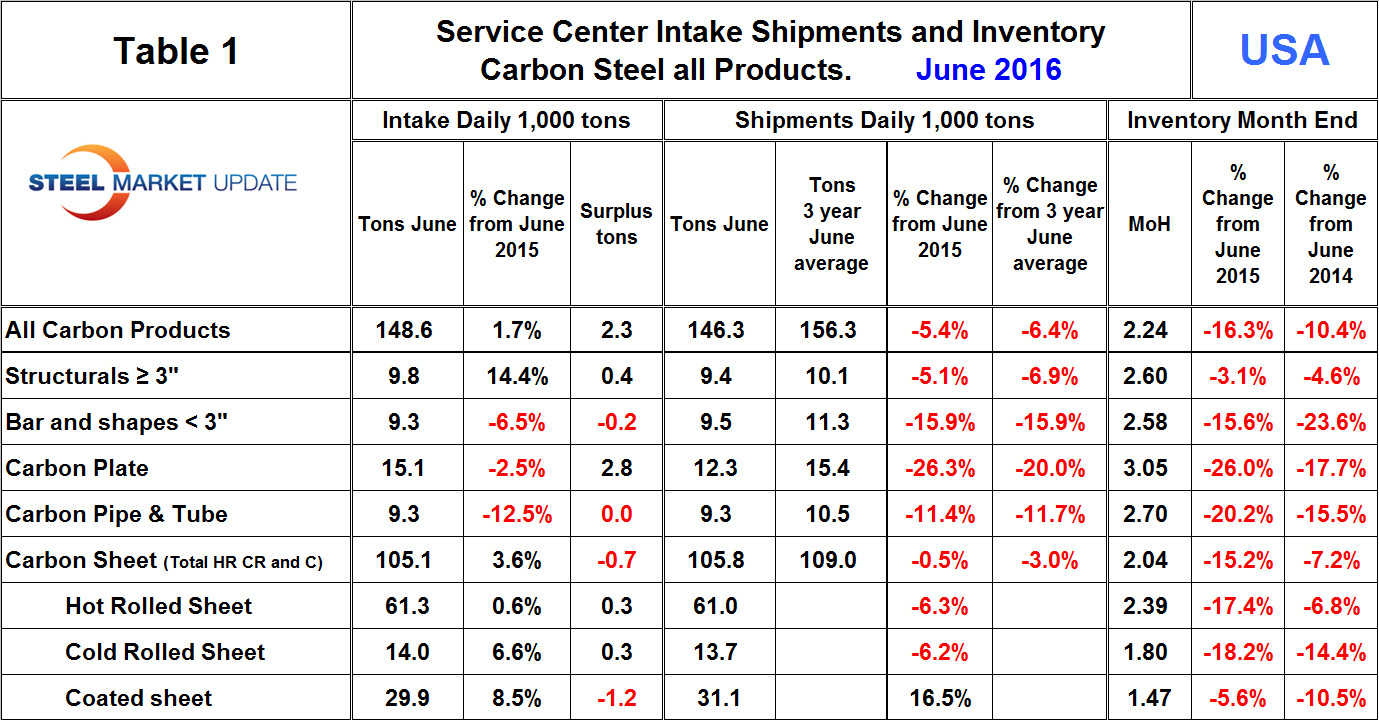
This was the first month of intake surplus after eighth consecutive months of deficit. The deficit averaged 14,300 tons in the four months through January, shrank to 4,300 tons in the four months through May and went positive in June. This seems conclusive enough to announce a positive overall improvement in sentiment. Total sheet products had an intake deficit of 700 tons in June though intake volume was up by 3.6 percent from June last year. Figure 2 shows both the monthly inventory and months on hand since January 2000 for total sheet products.
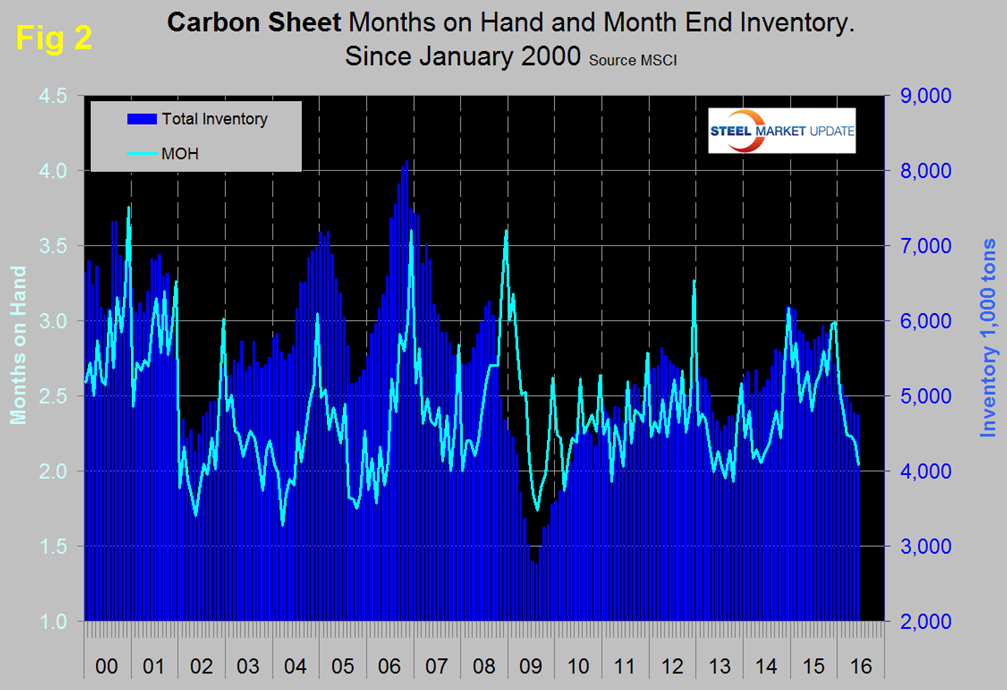
Total sheet inventory has been in a steady decline since September last year with a total reduction since then of 990,000 tons. Months on hand have declined from 3.66 in November last year to 2.39 in June. We have developed a new graph this month, Figure 3 shows the change in inventory monthly for the big 3 sheet products.
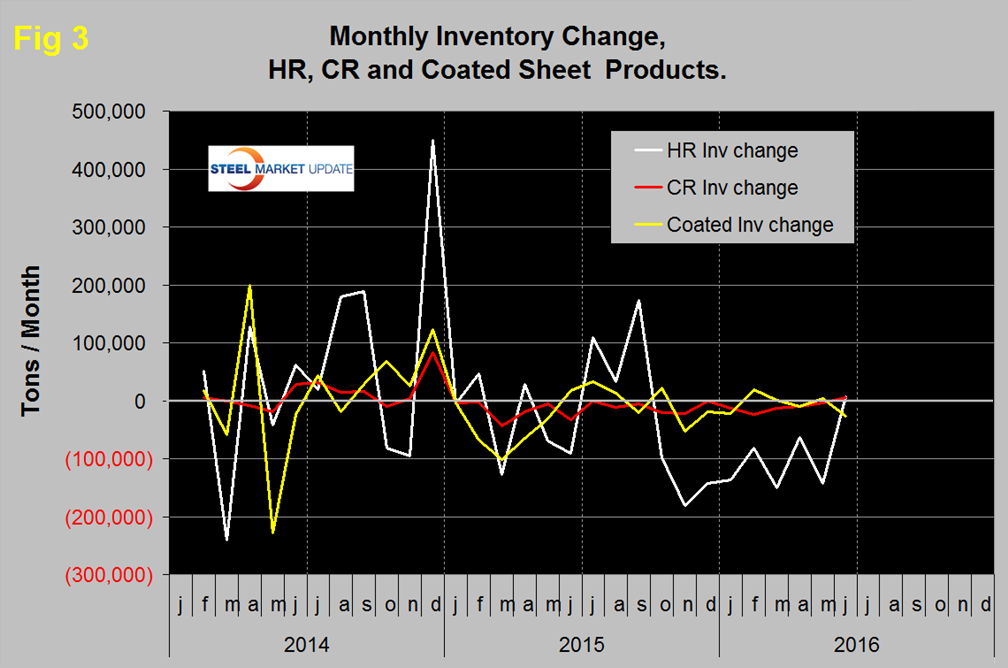
Compared to HR, the monthly inventory changes of CR and coated have been quite small for the last 12 months. HR inventory experienced an abrupt negative shift in October last year that continued through November. Since then the HR inventory level declined more slowly through May then increased by 7,200 tons in June.
In December 2015 the MSCI expanded their data to include sub sets of the major product groups and provided two years of data for 2014 and 2015. Table 1 shows the breakdown of sheet products into hot rolled, cold rolled and coated products. The 700 ton intake deficit of total sheet was driven by coated products, hot and cold rolled both had a small intake surplus. Compared to June 2015, intake was up by 1.7 percent for all carbon steel products and was up for total sheet and all individual sheet products.
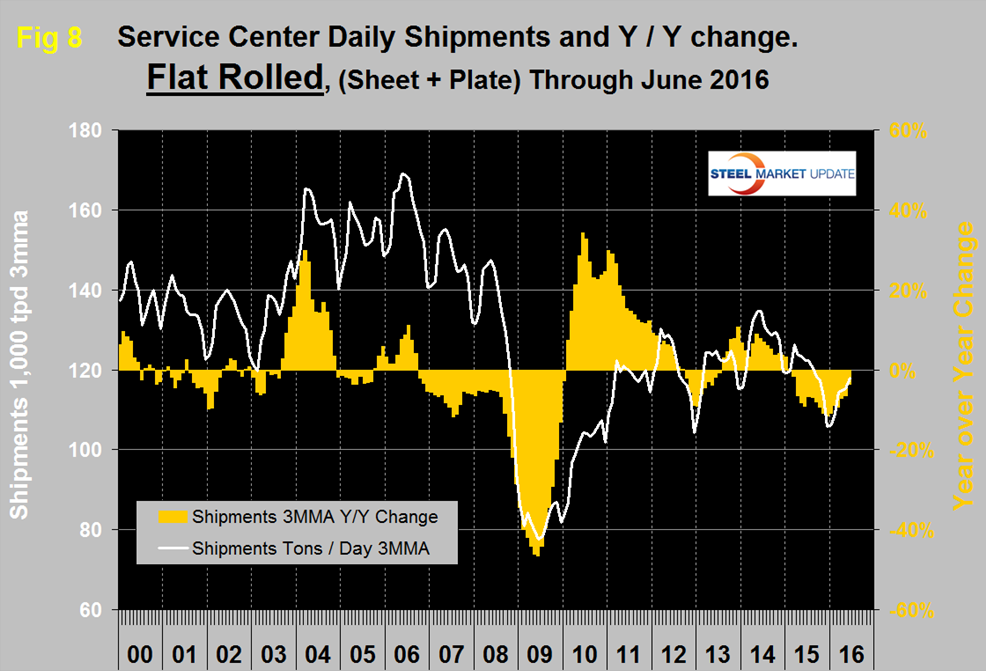
Shipments of all carbon steel products in June on a t/d basis were down by 5.4 percent y/y and were 6.4 percent less than the average June shipments for 2016, 2015 and 2014. The fact that the single month y/y growth comparison is slightly better than the three year comparison suggests that there is some positive momentum. Figure 4 shows the long term trends of daily carbon steel shipments since 2000 as three month moving averages (In our opinion the quickest way to size up the market is the brown bars in Figures 4, 7, 8 and 10 which show the y/y change in shipments. All four of these graphs show a y/y contraction).
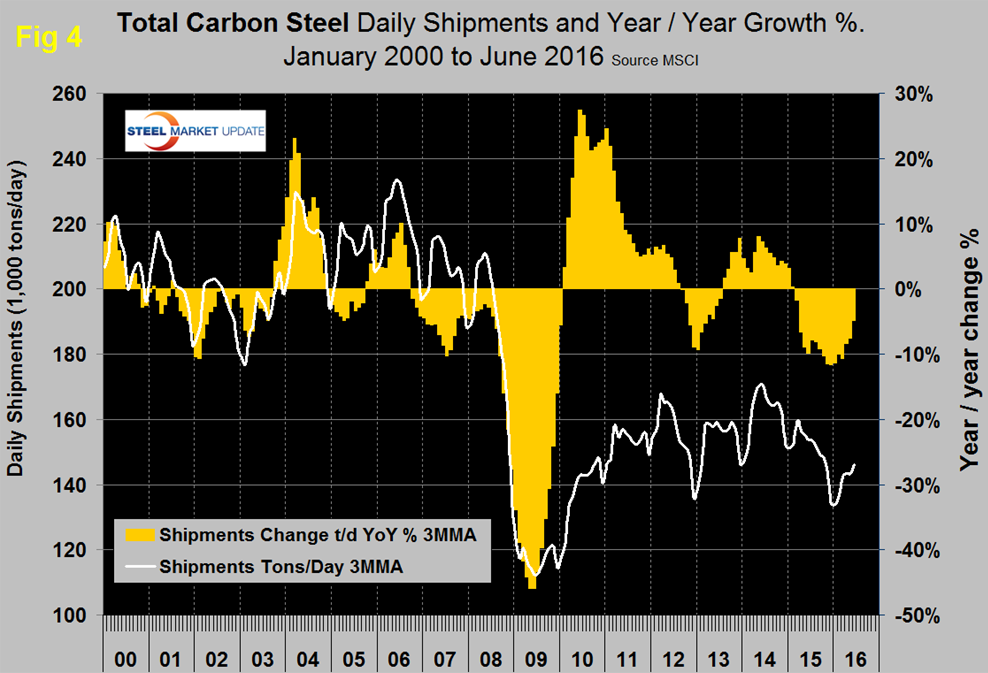
Total daily shipments had a post recessionary high of 173,300 in June 2014 and as shown by the brown bars in Figure 4 have had 16 consecutive months of negative y/y growth. In June shipments of all products except coated sheet were down year over year. Sheet products in total were down by 0.5 percent with declines in HR and CR not quite being balanced by the increase in coated volume. Figure 5 shows the historical shipping rate of the three major sheet products since January 2014.
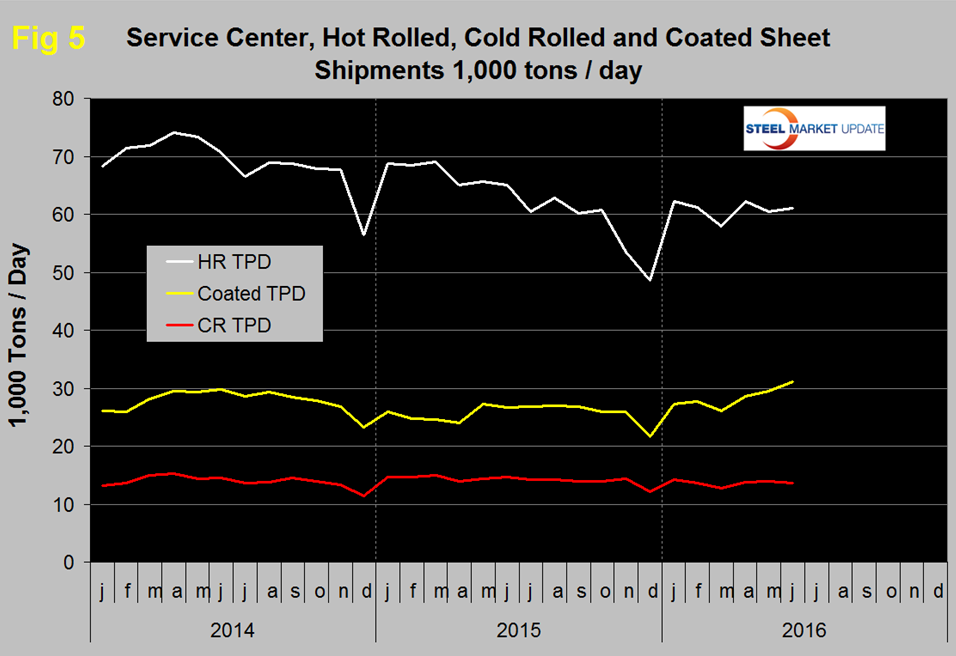
Coated products enjoyed the highest shipments in June since the MSCI developed this detail in January 2014, hot and cold rolled have made no progress this year.
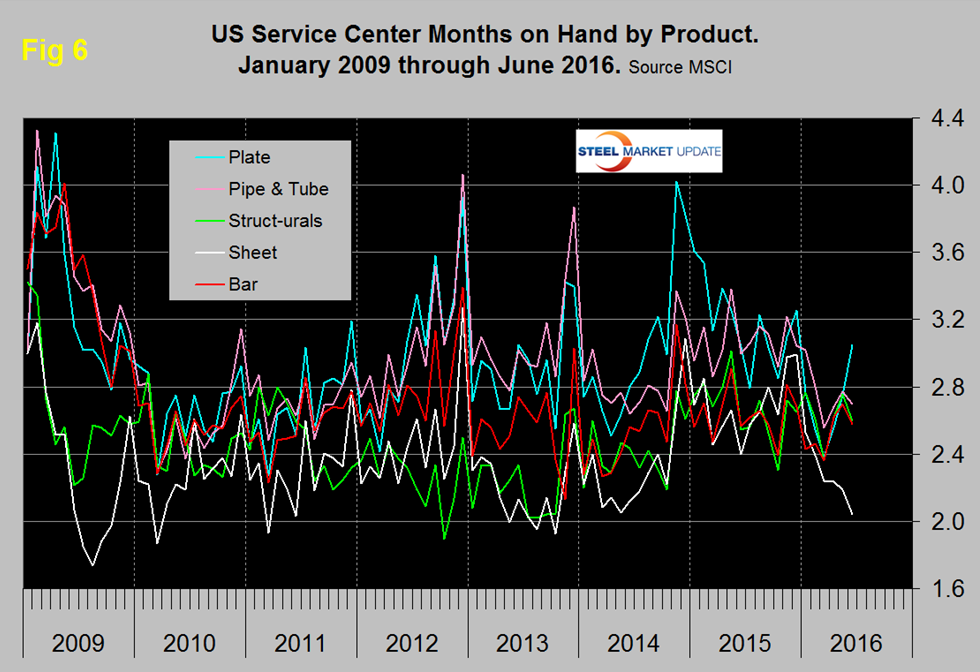
June closed with months on hand (MoH) of 2.24, down from 2.35 in May. All products except structurals and coated sheet had a double digit y/y decrease in MoH and plate was down by 26.0 percent. Figure 6 shows the MoH by product monthly since January 2009. Sheet and plate products are moving in opposite directions as all other product groups have converged at about 2.7 months.
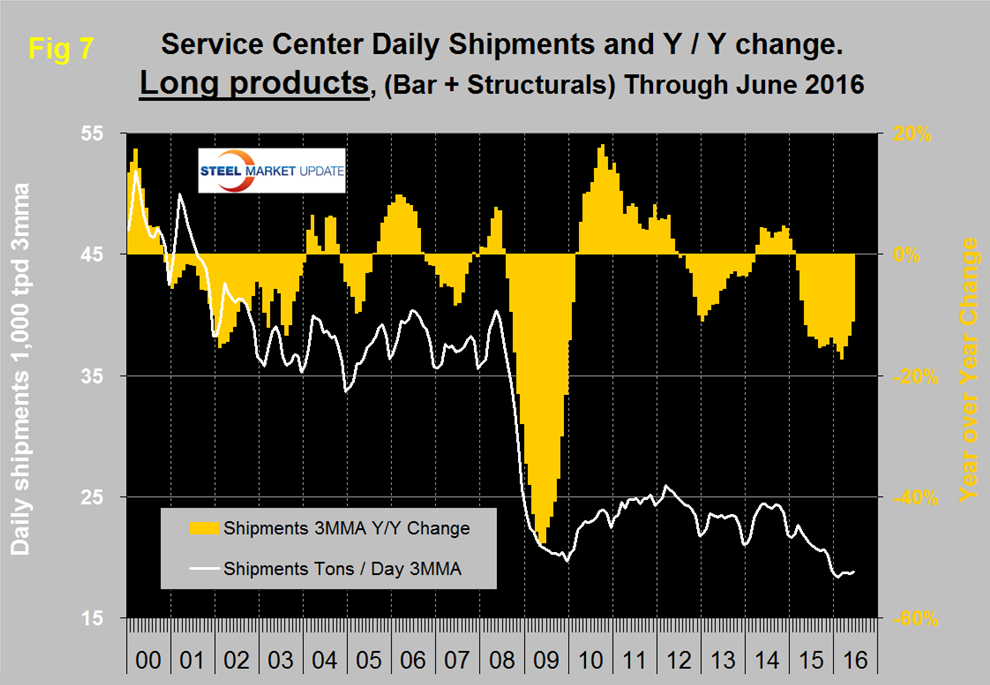
There continues to be a wide difference between the performances of flat rolled (sheet + plate) and long products (structurals + bar) at the service center level. Long product shipments from service centers are now lower than they were at the depths of the recession which makes us scratch our heads. There may have (probably has) been a migration of buyers away from service centers as mills have had their own inventory for sale and room in their schedules. Another possibility is that an unknown quantity of shapes has morphed from hot rolled to cold formed driven by the advantageous price of hot rolled. Then possibly the numbers are just wrong because of gaps in company participation (Figure 7).
Considering the improving construction statistics, long products should be doing better than the MSCI indicates. Flat rolled has had a much better recovery since mid-2009 and had positive y/y growth for 18 straight months through January 2015. In February 2015 growth slowed to zero and has been negative ever since (Figure 8).
In 2006 and 2007, the mills and service centers were operating at maximum capacity. Figure 9 takes the shipments by product since that time frame and indexes them to the average for 2006 and 2007 in order to measure the extent to which service center shipments of each product have recovered.
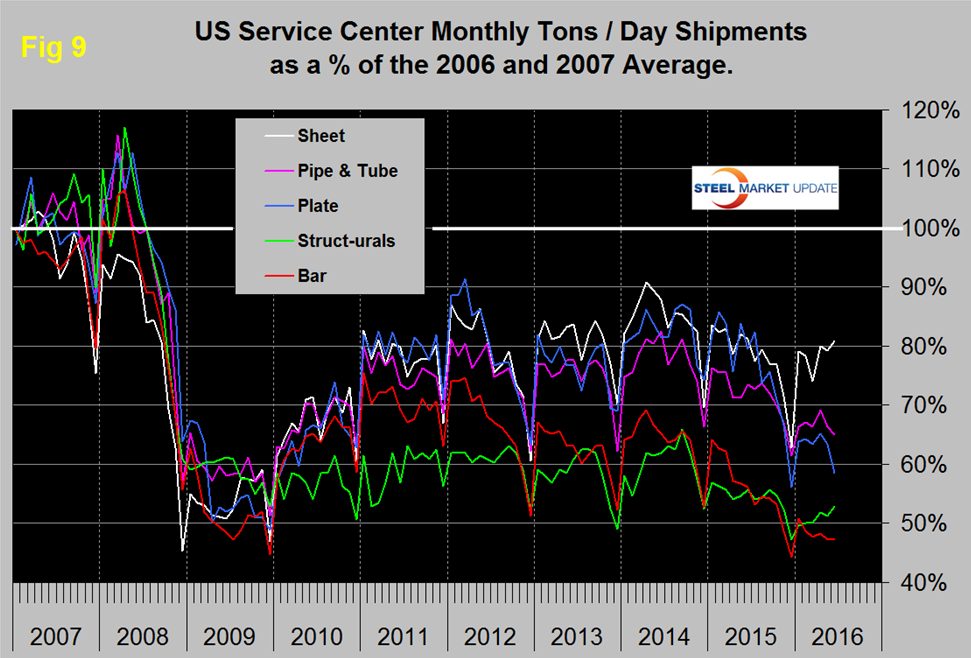
All products experienced the normal end of year collapse and January pick up. The total of carbon steel products is now at 68.9 percent of the shipping rate that existed in 2006 and 2007, with structurals and bar at 53.0 percent and 47.3 percent respectively. Sheet is at 80.8 percent, plate at 58.6 percent and tubulars at 65.0 percent.
MSCI uses product nomenclature flat and plate. In this analysis at SMU we replace the term flat with sheet. MSCI’s definition of “flat” is all hot rolled, cold rolled and coated sheet products. Since most of our readers are sheet oriented we have removed plate from Figure 8 to highlight the history of sheet products which are shown in Figure 10.
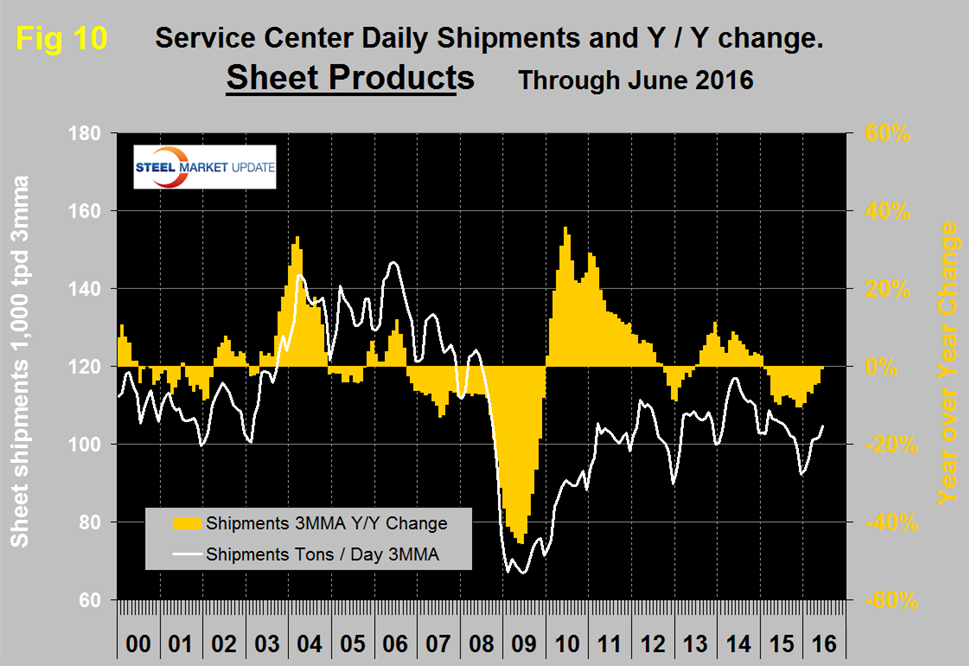
Following the strong post-recession recovery, sheet products experienced 9 months of decline from October 2012 through June 2013. This was followed by 19 months of growth through December 2014 but January 2015 slipped back into negative territory at -0.7 percent year over year and has been negative ever since though the contraction has slowed to 0.8 percent in June 2016.
SMU Comment: In Figures 4, 7, 8 and 10, the white lines show t/d shipments. There was a distinct decline in shipments for all major product groups in 2015 on a y/y basis but this year the decline is slowing for all products and at the present rate of change sheet products could have positive year over year growth this month (July). Figure 11 shows the total supply to the market of long and flat products based on AISI shipment and import data.
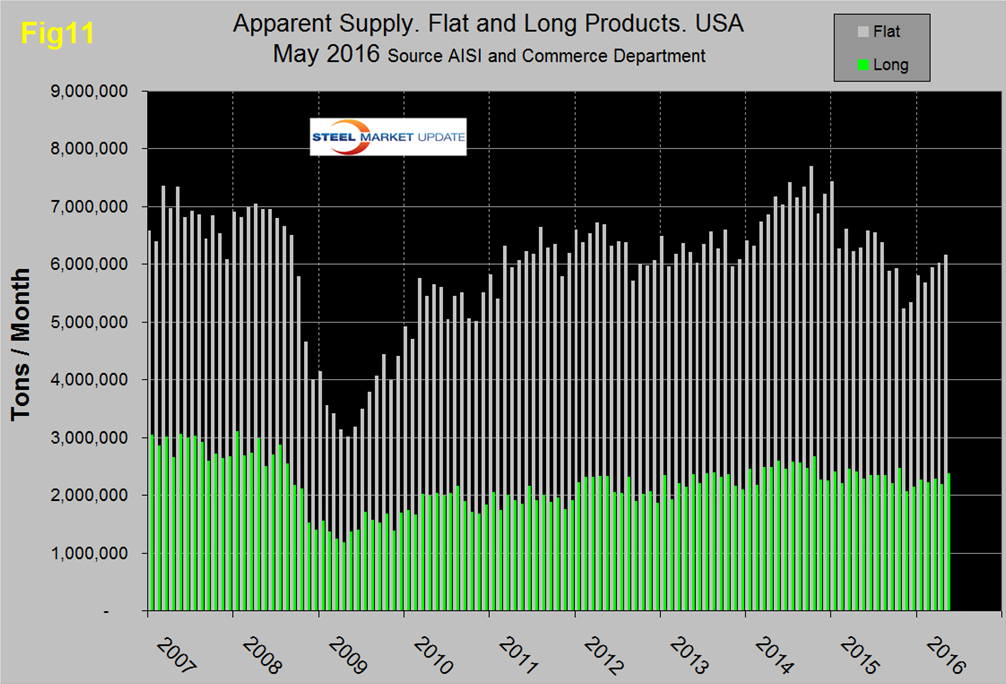
Total supply of long products is much better than the MSCI report of service center shipments with a volume almost double the recessionary low point. Total supply of flat rolled products peaked in October 2014, declined through November 2015 and has risen since then though volumes are still depressed. For flat rolled the MSCI and AISI data are in reasonable agreement with one another. Note: this supply data is one month behind the MSCI information.
The SMU data base contains many more product specific charts than can be shown in this brief review. For each product we have ten year charts for shipments, intake, inventory tonnage and months on hand. Some readers have requested these extra charts for a particular product and others are welcome to do so.