

Market Data

August 1, 2016
Regional Job Creation for Second Quarter 2016
Written by John Packard
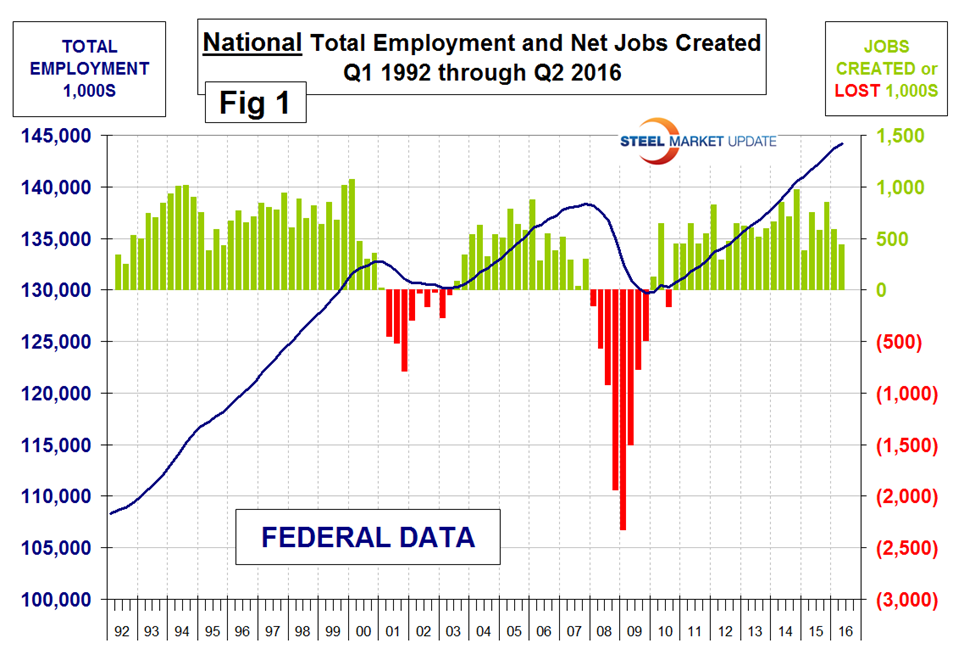
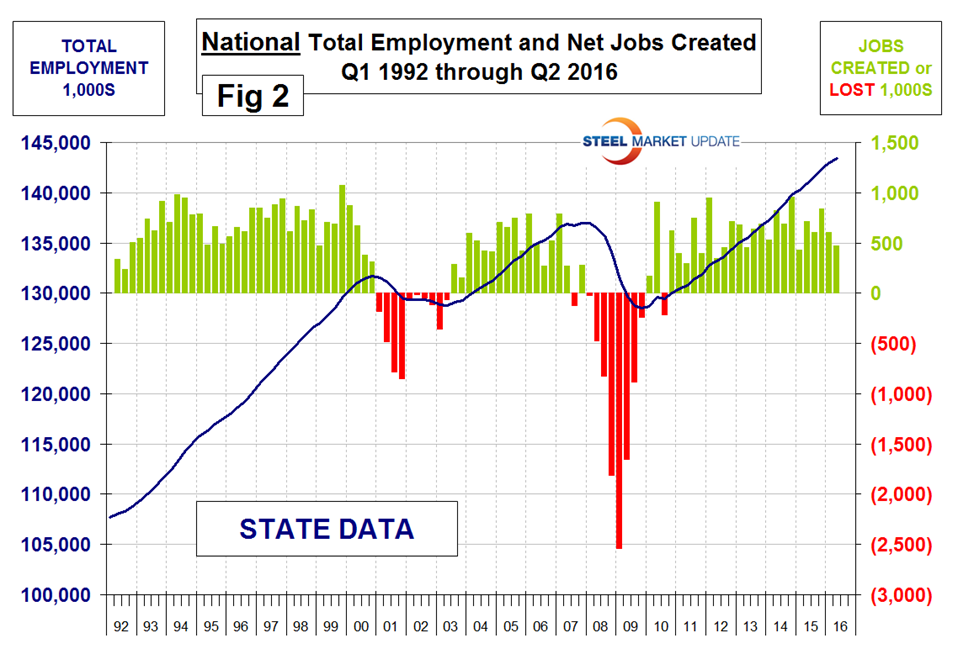
The states compile their employment numbers independently of the Feds, then both are reported by the Bureau of Labor Statistics. The results are close. In the last fourteen quarters since Q1 2013, the Feds reported total job creation of 9,111,000 and the states reported 9,105,400 a difference of only 0.06 percent. Part of this small discrepancy is that the Feds capture off shore military personnel but the states don’t. Figures 1 and 2 show the history of Federal and State totals since 1992. SMU has graphs in the same format for 10 geographic regions and can produce for individual states if a reader so requests.
The 10 geographic regions described in this report are described as follows:
New England (CT, ME, MA, NH, RI, VT)
North East (NY, PA, NJ)
Mid Atlantic (DE, DC, MD, NC, SC, VA, WV)
North Central (IA, KS, MN, MO, NE, ND and SD)
East North Central (IL, IN, MI, OH and WI)
East South Central (AL, KY, MS and TN)
South Central (TX, OK, LA and AR)
Mountain (AZ, CO, ID, MT, NV, NM. UT, WY)
Pacific region (CA, OR and WA)
South East (FL, GA)
Table 1 shows the history of quarterly job creation by region for the last 5 years.
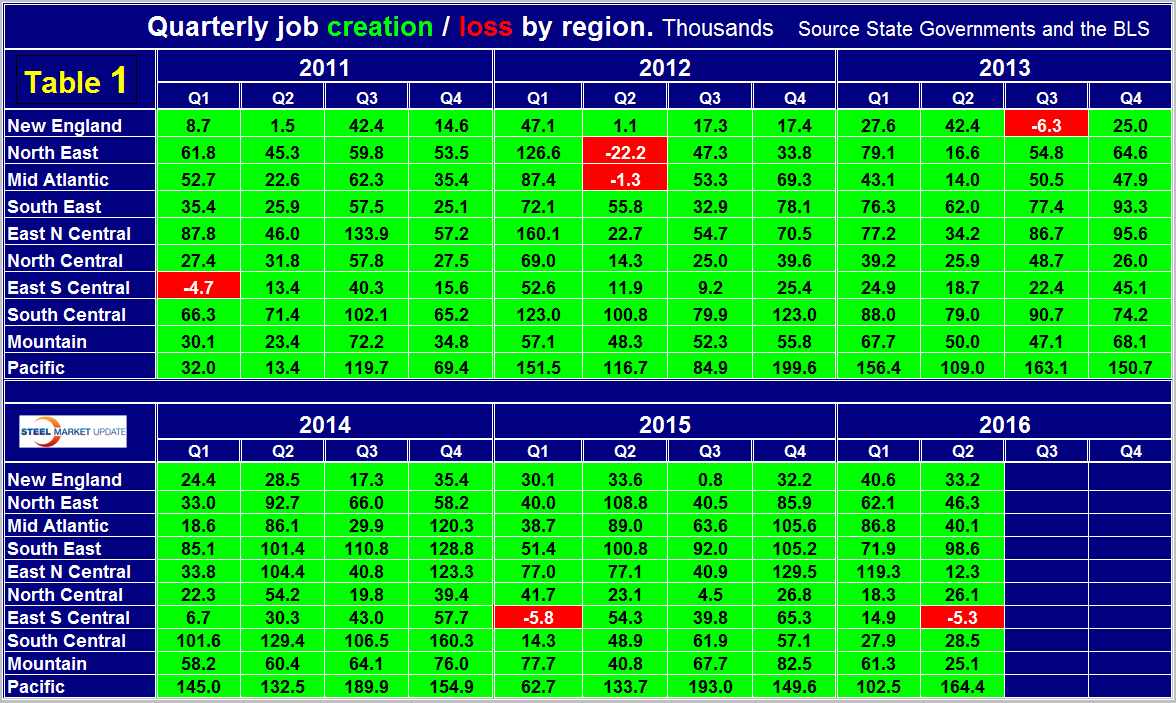
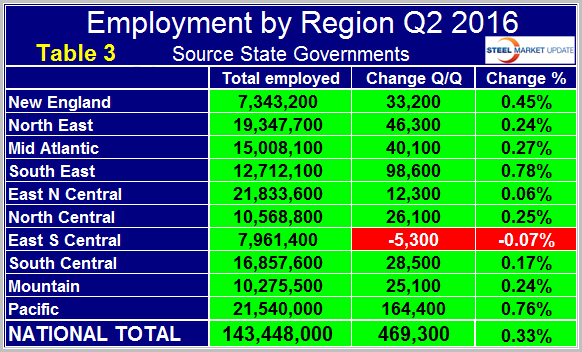
All regions except the East South Central had positive job creation in Q2 2016. The effect of energy prices is evident in these regional employment reports. The South Central region went off a cliff in Q1 2015 after having the highest job creation of any region in the previous quarter. This region rebounded in Q2 2015 through Q4 2015 but has since declined again and is nowhere near where it was before the oil price collapse. In the six quarters since Q4 2014, North Dakota has lost 22,800 jobs, Oklahoma has lost 4,300 jobs but Texas has gained 213,300 jobs. The Pacific region created the most jobs in Q2 of this year followed by the South East. The East South Central lost 5,300 jobs in Q2 2016 mainly in Mississippi which was down by 10,000. Alabama was up by 7,300.
In our last two reports on the monthly Bureau of Labor Statistics national results we were very uncomplimentary about the quality of the May data which had a gain of only 11,000 followed by June with a gain of 287,000. The regional data that we are discussing in this write up was even worse for May with a combined loss of 21,000 and even better for June with a gain of 306,000. This still makes no sense to us and looking at the individual states the really big swings were in Michigan, New Jersey, New York and Pennsylvania.
The regions have fared very differently since the pre-recession high of first quarter 2008 and since the low point of fourth quarter 2009. There are now 6,471,000 more people employed than there were immediately before the recession but of that number almost half occurred in the South Central, and Pacific regions (Table 2).
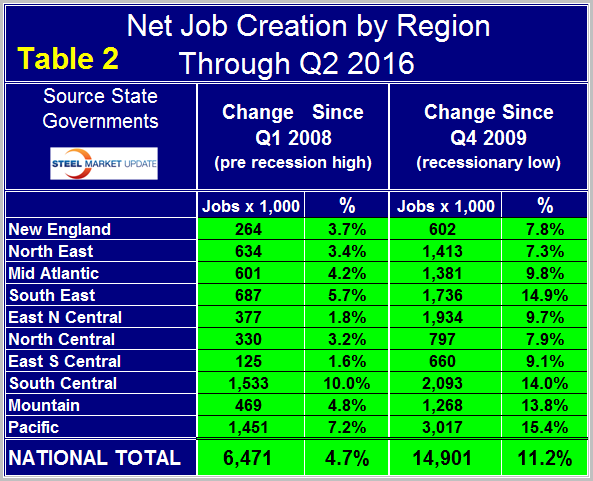
The third quarter of 2015 was the first time that every region had more people employed than it did at the pre-recession peak. Employment is now 14,901,000 positions higher than it was at the low point of the recession. The Pacific has had the largest number of jobs created during the recovery with an increase of 3,017,000 positions which amounts to 15.4 percent of total employment. The South Central is in second place with 2,093,000 jobs created which is 14.0 percent of total employment. The East North Central currently has the highest number of employed people with 21,833,600 but the Pacific with 21,540,000 is catching up fast (Table 3).
During the depths of the recession in Q1 and Q2 2009, the East North Central had the highest number of job losses
SMU Comment: We believe it’s important for those subscribers whose businesses are substantially regional to have as much data as possible to compare their own results with those of their locality. This report along with the regional GDP report that we also report quarterly is intended to help in that respect.


