Market Data

September 26, 2016
A Word from Our Publisher
Written by John Packard
Last week Steel Market Update invited just under 600 steel executives to participate in our flat rolled market trends survey. As is normal with SMU surveys, we intentionally invite manufacturing companies and service centers to lead the way. Last week 45 percent of the respondents came from manufacturing and 44 percent from the steel distributors. The remainder was made up of trading companies (5 percent), steel mills and toll processors (3 percent each). This is close to the normal make-up of the respondents to any individual survey with the key suppliers of data being manufacturing companies and distributors.
Earlier today I was asked by one of our Premium level subscribers if there was anything unusual in this past week’s survey results.
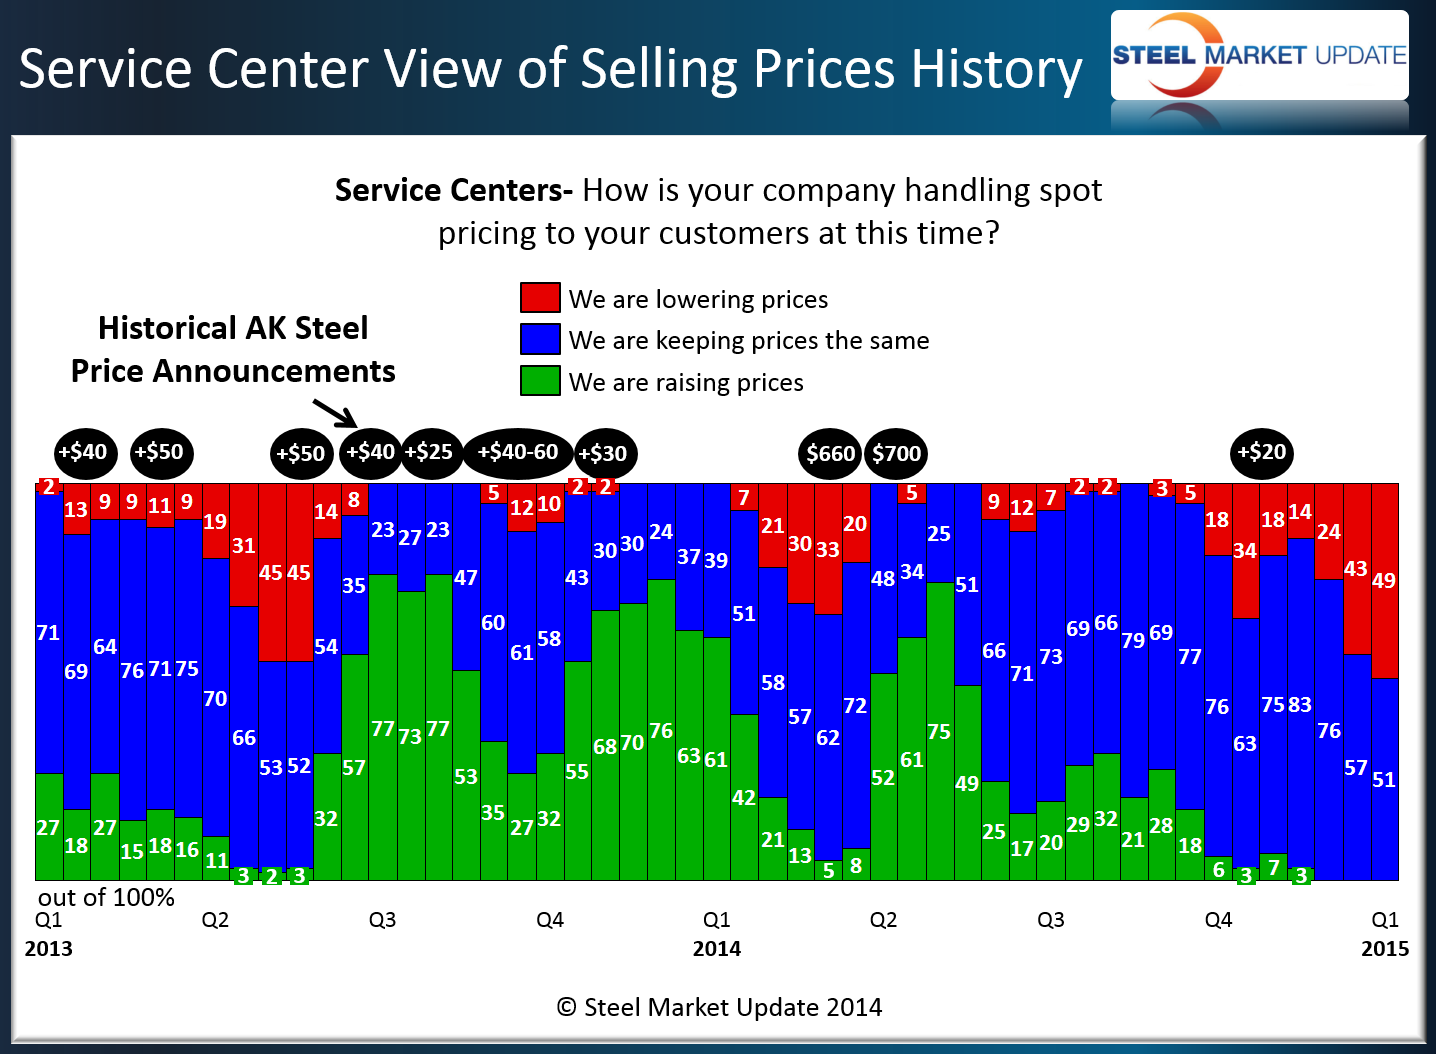
We will write a more detailed article on this subject later this week in our Executive level issue of our newsletter, but we are seeing a strong move toward “capitulation” which is the level at which service centers essentially cry “uncle.” We have loosely defined capitulation as being the point when 75 percent of the service centers are reporting their company as lowering spot prices to their end user customers.
If you look at the Power Point presentation on our website, in the 29th slide we address the service center view of spot prices history with the AK Steel price increase announcements referenced above the red bars. Going back to January 1, 2015, the price increase announcements came approximately two months to three months from when the peak of capitulation occurred. We have not yet reached the 75 percent level but we are very close and I expect that we will if domestic steel prices (mill spot prices) continue to drift lower in the coming weeks.
Out of curiosity I went back and looked at the previous two year period (2013-2015) to see if the time period between the service centers reaching the point of capitulation and the first price increase was the same as what we are seeing in the 2015-2016 data. What we discovered is we had a strong period of time when the service centers were supporting increases (the first two AK increases did not result in higher spot prices in 2013). Prices actually fell from January through mid-May before bouncing back from that point until mid-August 2014 when a strong price drop occurred through April 2015.
A word of warning to those listening to the rumors of a price increase, remember the increase alone does not cause prices to move higher. The graphic below is a good example. If you go to our website, sign in and click on prices and then compare benchmark HRC on a weekly basis during this same time period you will note that a number of these AK announcements were just that, announcements as an attempt to move the market (stop the bleeding). The announcement made in 4Q 2014 is a great example. So, there are periods of time when announcements can be made prior to the service centers reaching the point of capitulation.
The mill lead time history slides (#33 & #34) provide an excellent look at how the normal season business cycle works, with growth occurring in the first and second quarters before you get the summer cool down heading into 4th Quarter. Once we get past the Thanksgiving & Christmas holidays (and the election), we expect that we will see a similar rise in the lead times next year. We make that statement based on Dr. Alan Beaulieu of the Institute for Trend Research (ITR) who is forecasting 2017 to be a better year for the steel industry than 2016.
The slides regarding foreign steel pricing and whether new orders were being placed by either manufacturing companies or service centers tell the tale of the market prior to the latest complaints filed against Vietnam/China. We will watch the responses in our next two surveys (next week and mid-October). We expect there could be a change in the percentages as fewer companies take the risk of buying foreign steel from countries like Vietnam, in particular.