

Market Data
February 13, 2017
Oil and Gas Prices and Rotary Rig Counts through February 2017
Written by Peter Wright
The prices of oil and natural gas drive the consumption of oil country tubular goods (OCTG) and related steel products. The energy markets represent a large portion of the hot rolled coil used to make welded tubular goods as well as equipment used to drill and pump oil and natural gas.
Figure 1 shows historical oil and gas prices since January 2000.
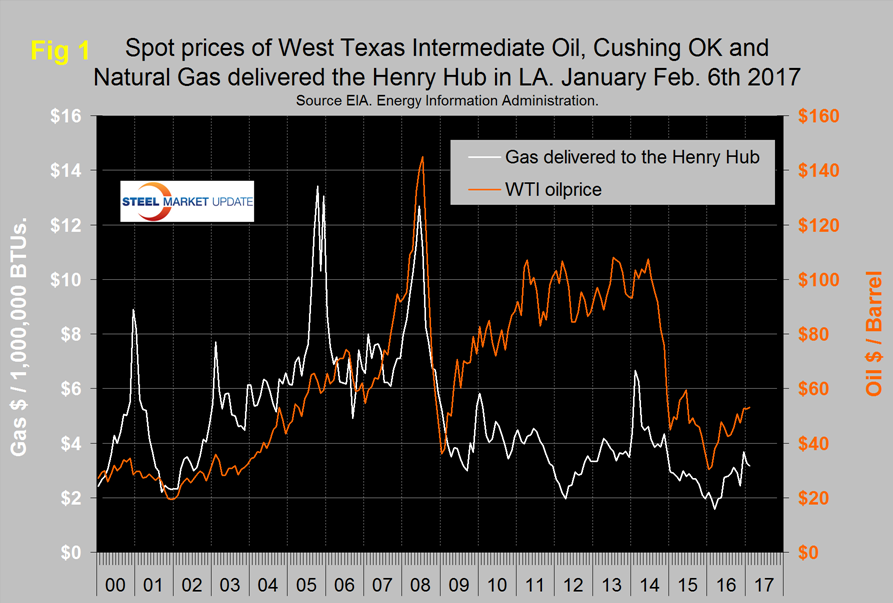
The daily spot price of West Texas Intermediate (WTI) rose through $50 on December 8th and has stayed above that level ever since. The price had a recent high of $54.01 on December 28th and settled back to $53.01 on February 6th, Brent closed at $55.02 on the same day. Data source is the Energy Information Administration (EIA). On February 13th Gary Bourgeault wrote: “Companies with shale exposure in the U.S., especially in the Permian basin, will continue to boost production throughout the next couple of years at least, and the increased productivity per rig and well, along with increased efficiencies, will surprise to the upside on the production side in my view.
“As for the OPEC and Russian output cut deal, the other reason, beyond robust U.S. supply growth, is other countries like Canada and Brazil aren’t really being talked about much in the media, even though they’re expected to bring over 400,000 more barrels per day into the market this year. Also keep in mind that many U.S. producers hedged at a higher price when the agreement was being talked about in the media, which drove up the price of oil. This will allow them to be very aggressive with their production levels, no matter what happens with supply. Another factor has been a stronger U.S. dollar, which also, to a degree, offsets the cut in production. Improved efficiencies and productivity, more hedging, and the strengthening U.S. dollar are all beneficial to U.S. oil production. For these reasons, I see the oil output in the U.S. significantly surpassing most estimates.”
On the morning of the 13th the latest data from the EIA for the price of natural gas, delivered the Henry Hub was January 17th which is much delayed from normal. Natural gas had a recent low of $2.22 on November 11th but by December 7th had shot up to $3.69/MM BTU. By January 17th the price had slid back to $3.17. The price of gas had trended down for two years prior to March 4th when it bottomed out at $1.57/MM BTU. Natural gas fuelled the largest share of electricity generation in 2016 at 33 percent, compared with 32 percent for coal and in 2017, natural gas and coal are both forecast to fuel 32 percent.
The total number of operating rigs in the US and Canada on February 10th was 1,092 which was more than double the low point 445 on May 27th. The good news is that in each of the eight weeks before and including February 10th the count has had an increasing y/y growth which reached 40.1 percent in w/e February 10th. The y/y growth rate of US and Canadian rigs was 37 percent and 41.2 percent respectively. Figure 2 shows the Baker Hughes US Rotary Rig Counts for oil and gas equipment in the US through February 10th (explanation below).
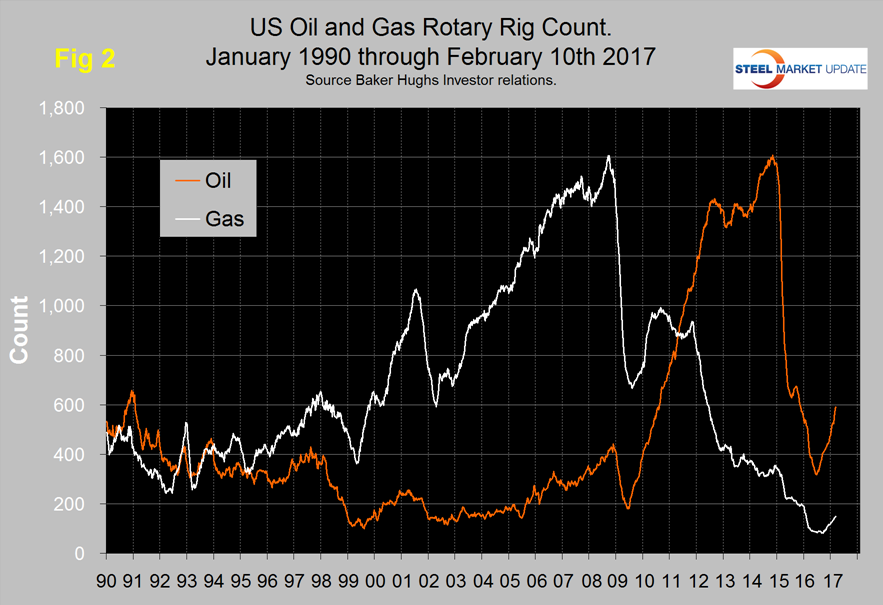
The uptick in the US oil rig count is now well established having increased from 316 on May 27th to 591 on February 10th. The gas rig count is growing more slowly and on February 10th was 149, up from a low point of 81 on August 5th.
On a regional basis in the US, the big three states for operating rigs are Texas, Oklahoma and North Dakota. Texas at 361 on February 10th was up from a low point of 173 on May 27th 2016 and up from 245 on February 12th last year. Oklahoma at 102 on February 10th was up from its low point of 54 on June 24th last year and up from 76 y/y. North Dakota at 36 on February 10th was flat for three weeks but up from its low point of 22 on June 3rd but still down from 39 at the beginning of 2016.
Baker Hughes Rotary Rig Count: These are a weekly census of the number of drilling rigs actively exploring for or developing oil or natural gas in the United States. Rigs are considered active from the time they break ground until the time they reach their target depth and may be establishing a new well or sidetracking an existing one. The Baker Hughes Rotary Rig count includes only those rigs that are significant consumers of oilfield services and supplies.


