

Market Data

March 13, 2017
Net Job Creation by Industry through February 2017
Written by Peter Wright
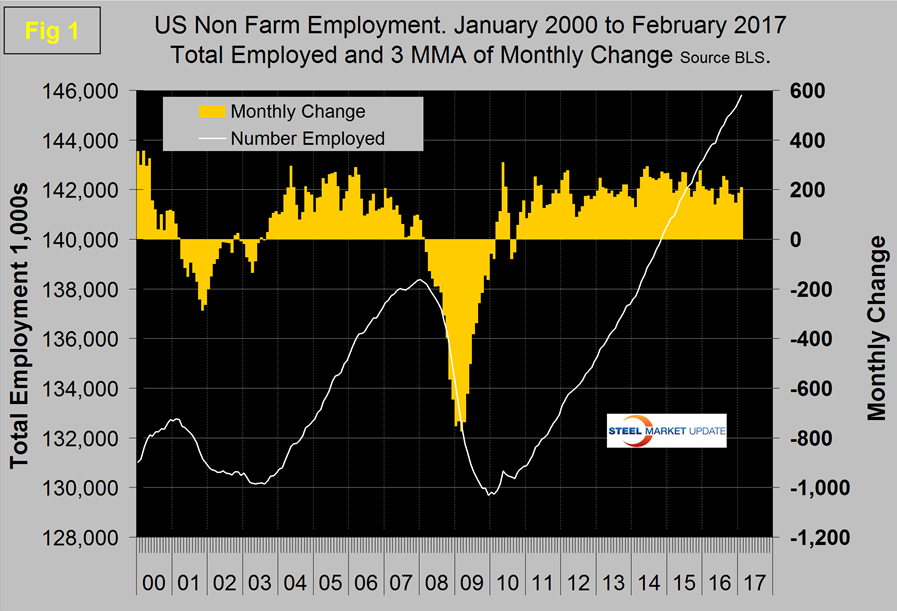
The Bureau of Labor Statistics (BLS) released the February employment data on Friday which was a week later than normal. This was the best result for goods producing industries (mainly construction and manufacturing) since August 1998. The preliminary result for net job creation in February was 235,000. December was revised down by 2,000 and January revised up by 11,000. Using a three month moving average (3MMA), the result for February was 209,000 up from 186,000 in January. Figure 1 shows the 3MMA of the number of jobs created monthly as the brown bars since 2000.
These numbers are seasonally adjusted by the BLS. In order to examine if any seasonality is left in the data after adjustment we have developed Figure 2.
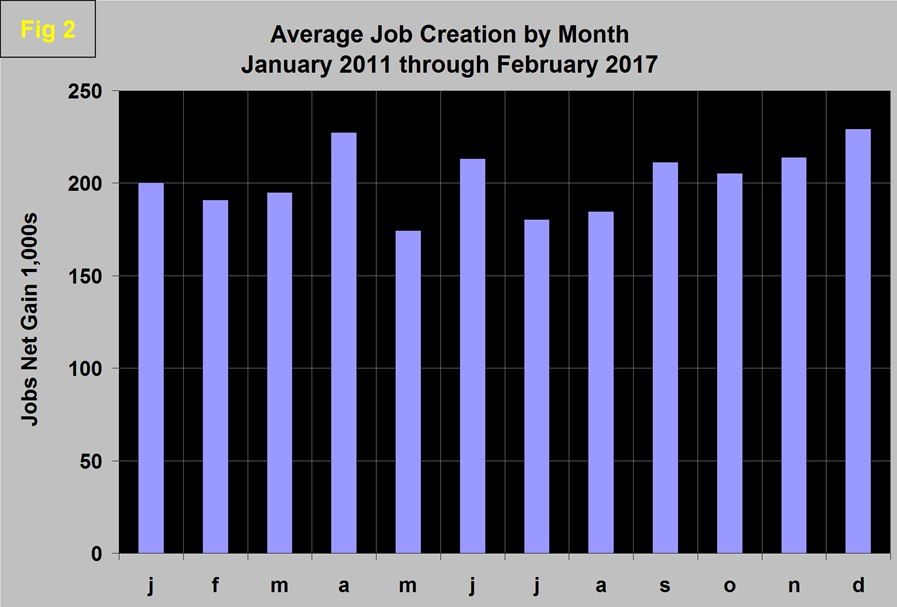
In the seven years since and including 2011, job creation in February has been down by an average of 5.0 percent. This year February was down by 1.0 percent therefore this latest result was fairly normal.
Total non-farm payrolls are now 7,433,000 more than they were at the pre-recession high of February 2008. The BLS reported that the average workweek for all employees on private non-farm payrolls was unchanged at 34.4 hours in February. In manufacturing, the workweek was unchanged at 40.8 hours, and overtime remained at 3.3 hours. The average workweek for production and non-supervisory employees on private non-farm payrolls has been 33.6 hours since August 2016. In February, average hourly earnings for all employees on private non-farm payrolls increased by 6 cents to $26.09, following a 5-cent increase in January. Over the year, average hourly earnings have risen by 71 cents, or 2.8 percent. Average hourly earnings of private-sector production and non-supervisory employees increased by 4 cents to $21.86 in February and average hourly earnings for all employees on private non-farm payrolls rose by 3 cents to $26.00, following a 6-cent increase in December. Over the year 2016, average hourly earnings rose by 2.5 percent.
On Thursday (before the February data was released), Economy.com had this to say: “mild weather, a recovery in manufacturing and mining, and rising consumer and business confidence have been a boon for employment growth. Expected policies for a relaxation of government regulations and lower taxes are boosting business confidence and stock market performance. Increased confidence will help keep hiring on the right track, and help bring more workers back into the labor market. However, as we near full employment, employers are struggling to fill open positions, which are now near a record high. This will lift wages, which will, in turn, encourage households to spend more over the year and aid consumer-dependent industries.”
Table 1 slices total employment into service and goods producing industries and then into private and government employees.
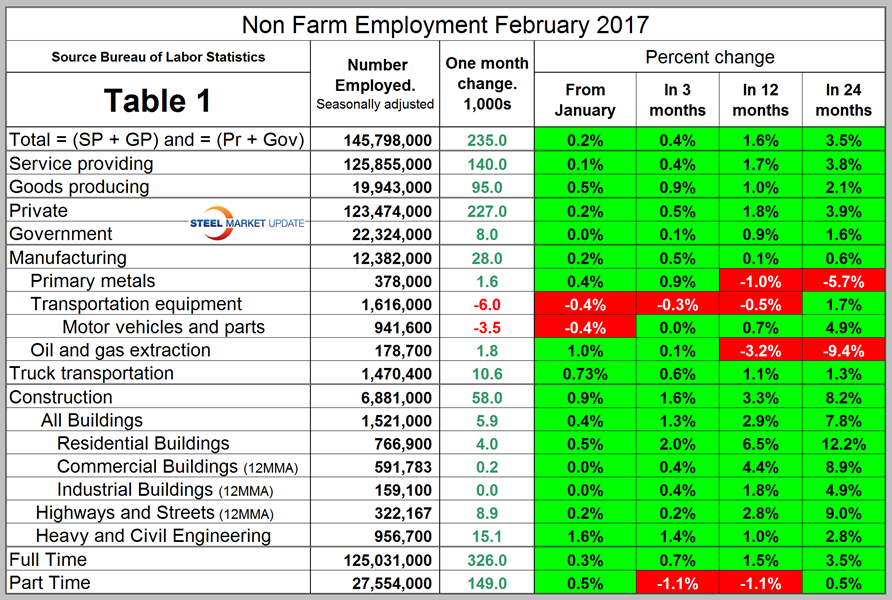
Total employment equals the sum of private and government employees: it also equals the sum of goods producing and service employees. Most of the goods producing employees work in manufacturing and construction and the components of these two sectors that we consider to be of most relevance to steel people are broken out in Table 1. In February, 227,000 jobs were created in the private sector and government gained 8,000. The Federal government gained 2,000 as local governments gained 9,000 and state governments lost 3,000. Since February 2010, the employment low point, private employers have added 16,217,000 jobs as government has shed 152,000. In February service industries expanded by 140,000 as goods producing industries driven by both construction and manufacturing expanded by 95,000. Since February 2010, service industries have added 13,749,000 and goods producing 2,316,000 positions. This is part of the reason why wage growth has been slow since the recession as service industries on average pay less than goods producing such as manufacturing.
In February, manufacturing gained 28,000 positions for a total of 57,000 in the last three months. This was the best result for manufacturing since October 2015. In February, total manufacturing employment was 0.6 percent higher than the same month in 2015. Table 1 shows that primary metals had positive growth of almost 1 percent in the last three months. Transportation equipment including motor vehicles lost jobs in February but trucking was very strong. Oil and gas extraction gained 1,800 jobs in the preliminary February result which was 1.0 percent. Note the subcomponents of both manufacturing and construction shown in Table 1 don’t add up to the total because we have only included those that we think have most relevance to the steel industry.
Construction was reported to have gained 58,000 jobs in February and is up by 219,000 in the last 12 months or 3.3 percent. This sector has been favorably influenced by the very mild winter across most of the country. Some of the major construction sub categories are routinely reported one month in arrears which distorts the data in Table 1. These include, industrial buildings, commercial buildings and highways and streets. Construction has added 1,381,000 jobs and manufacturing 929,000 since the recessionary employment low point in February 2010 (Figure 3).
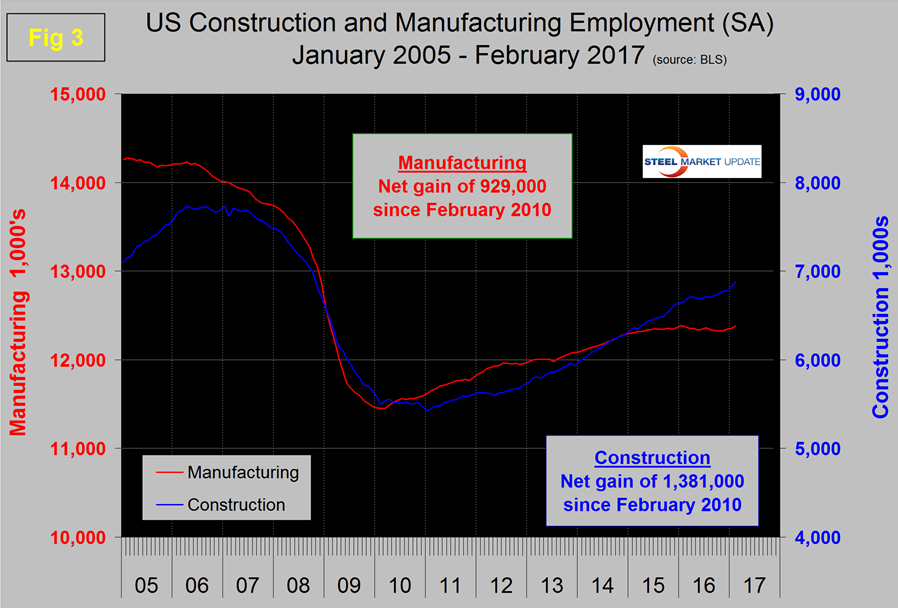
Construction has leapt ahead of manufacturing as a job creator but the growth of construction productivity is very low (or non-existent), in contrast to manufacturing where it is very high. The difference is the difficulty of automating construction jobs.
The official unemployment rate, U3, reported in the BLS’s Household survey (see explanation below) came in at 4.7 percent which was down from 4.9 percent in February last year. This number doesn’t take into account those who have stopped looking. The more comprehensive U6 unemployment rate was down from 9.7 percent in February last year to 9.2 percent in this latest report (Figure 4).
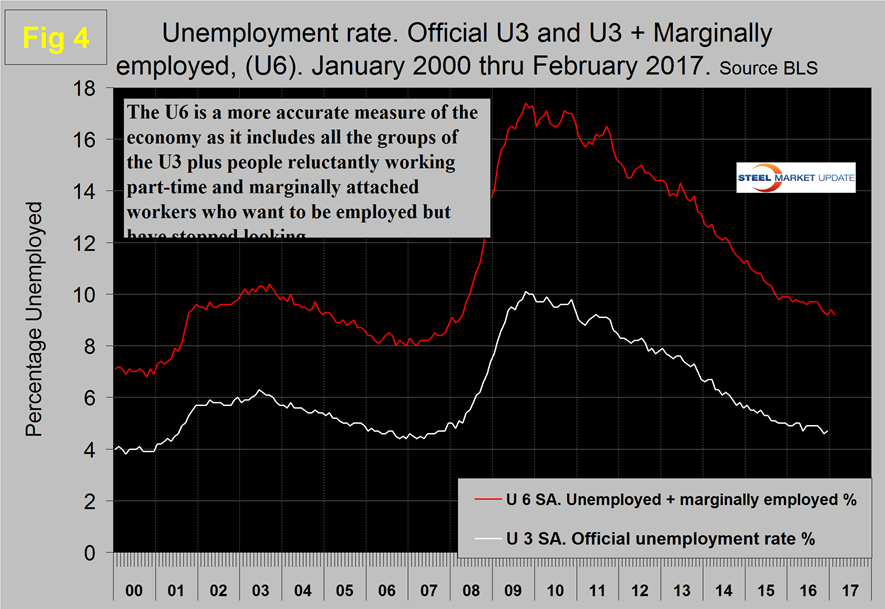
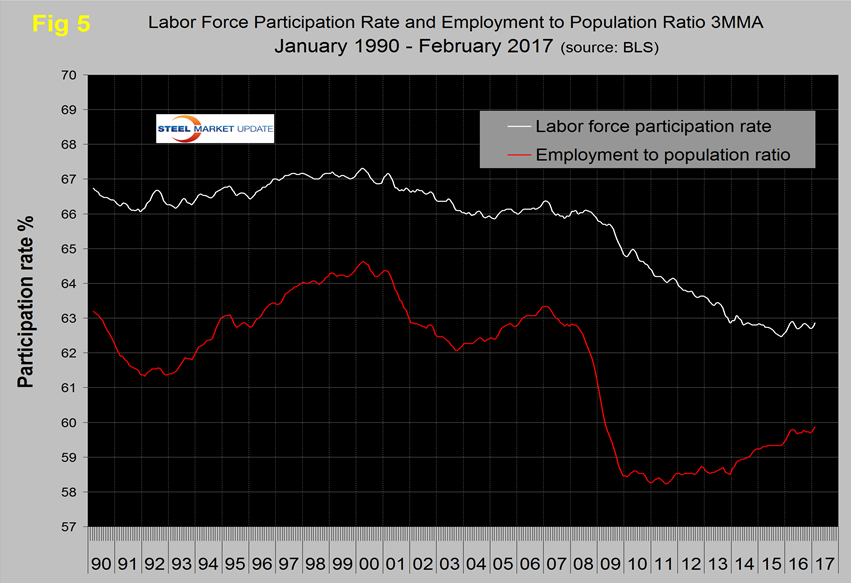
U6 includes workers working part time who desire full time work and people who want to work but are so discouraged that they have stopped looking. The differential between these rates was usually less than 4 percent before the recession but is still 4.5 percent. It has been estimated that the economy needs to create about 150,000 jobs per month to keep up with population growth. In the last 13 months the average job creation has been 194,000 so the impact on unemployment has been about 44,000/month. The employment participation rate is accurately reported in the press as going nowhere. In February 2017 the rate was 62.9 percent which was the same as March and April last year. We’re not sure that we understand what this is a percentage “of” because of the multiple descriptions of the labor pool. Another measure is the number employed as a percentage of the population which we think is much more definitive. In February this measure was 60.0 percent up from 59.8 percent in February last year. Until a year ago when it stalled, there was a gradual improvement in employment to population ratio since late 2011. Figure 5 shows both measures on one graph.
In the 26 months since and including January 2015 there has been an increase of 5,097,000 full time and 48,000 part time jobs. Figure 6 shows the rolling 12 month total change in both part time and full time employment.
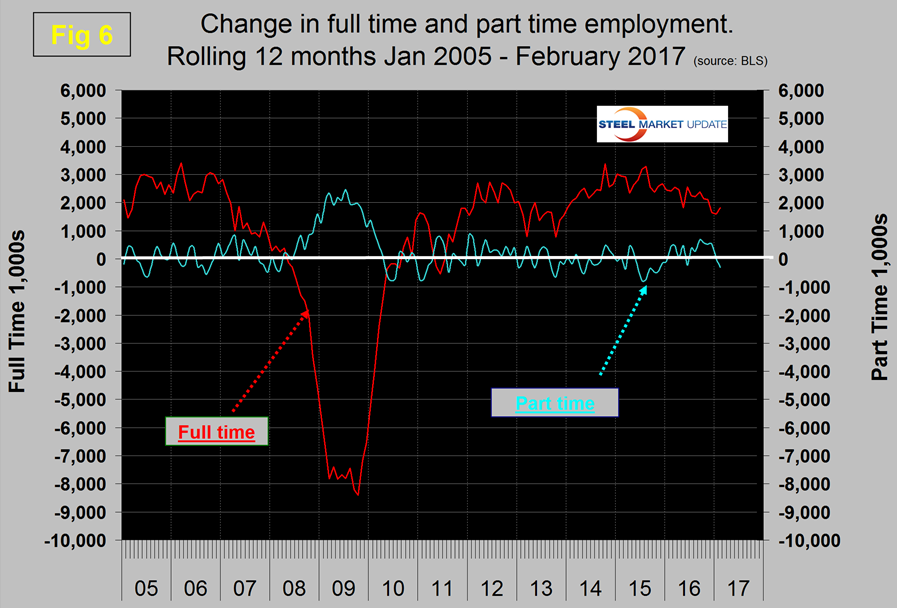
Frequently in the press we read that a large part of job creation is in part time employment which in some months is true, but the part time numbers are extremely volatile. This data comes from the Household survey and part time is defined as < 35 hours per week. Because the full time/part time data comes from the Household survey and the headline job creation number comes from the Establishment survey, the two cannot be compared in any particular month. To overcome the volatility in the part time numbers we have to look at longer time periods than a month or even a quarter which is why we look at a rolling 12 months for this component of the employment picture in Figure 6.
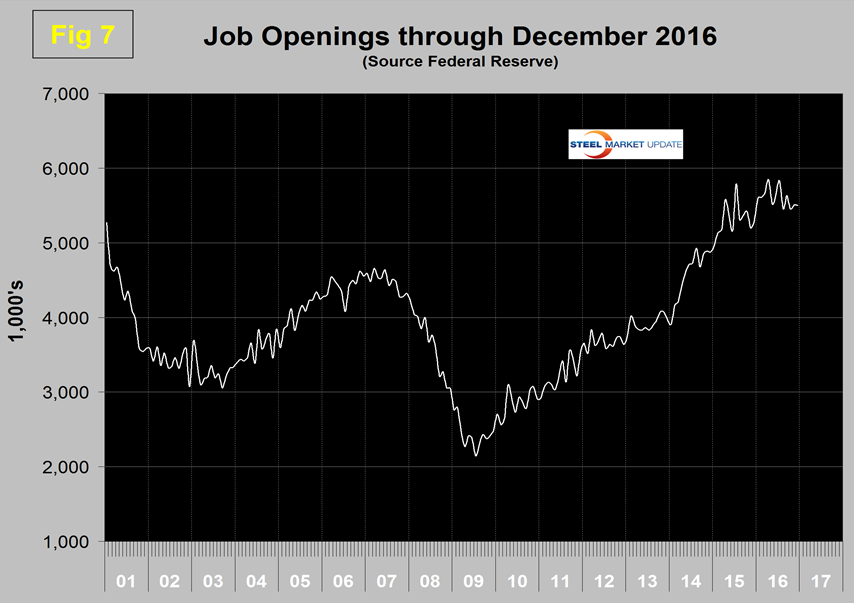
The job openings report known as JOLTS is reported on about the 10th of the month by the Federal Reserve and is over a month in arrears. Figure 7 shows the history of unfilled job openings through December when openings stood at 5,501,000 not far off the all-time high of 5,845 in April. There has been an improving trend since mid 2009.
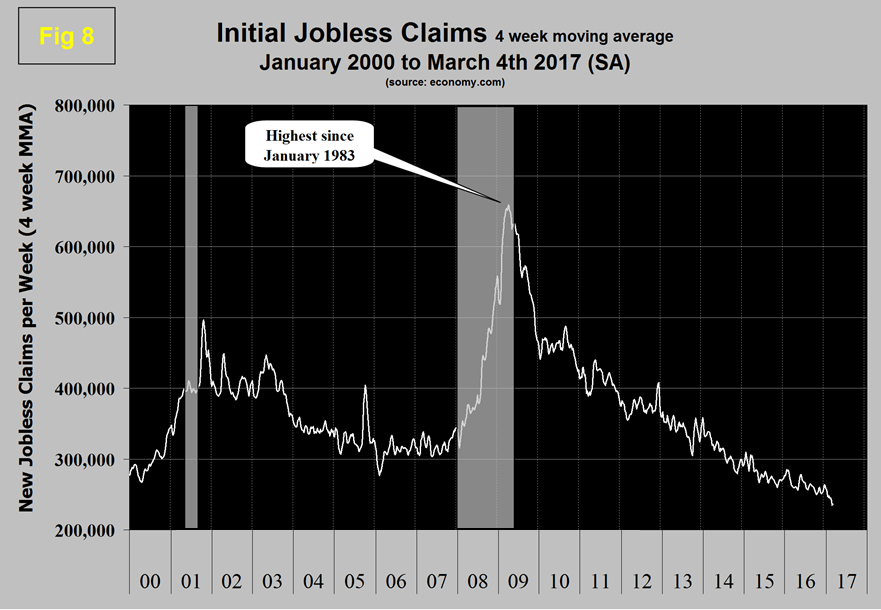
Initial claims for unemployment insurance, reported weekly by the Department of Labor have continued their downward drift this year and in w /e March 4th were 243,000 with a four week moving average of 236,500. This marks the longest streak since 1973 of initial claims below 300,000. (Figure 8). The result for w/e November 12th at 233,000 was the lowest since April 1974.
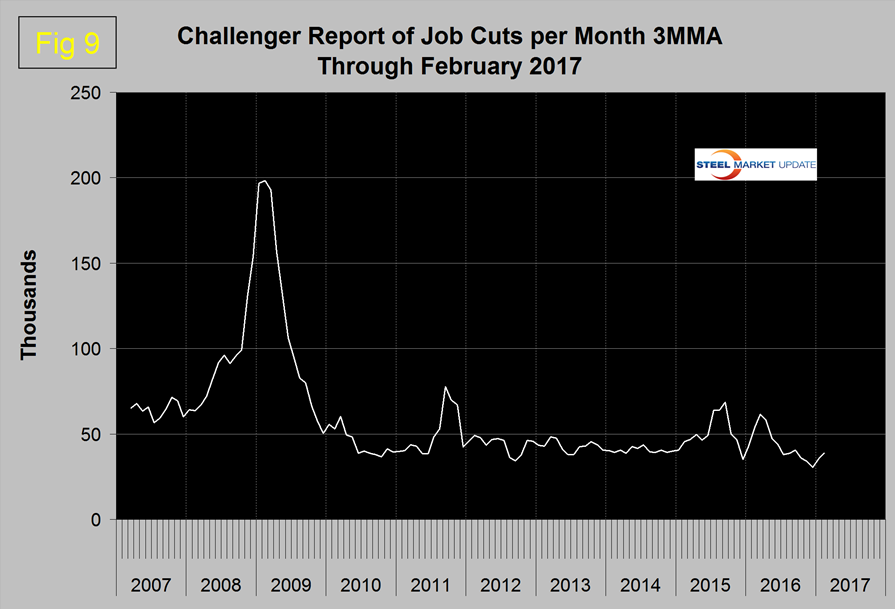
The last piece of the employment puzzle that we examine is the Challenger report which measures job cuts monthly (Figure 9). This data also tends to be quite erratic therefore again we examine a rolling 12 months and can see that job cuts decreased for most of 2016 but ticked up a little in January and February.
SMU Comment: Construction employment has benefited from the mild winter this year but the growth in manufacturing jobs in the last three months can’t be dismissed so easily therefore we are encouraged. February was the 76th consecutive month of job growth and in the last 14 months seven have exceeded 200,000 jobs created per month. The road hauling sector had its best month since December 2014 which we regard as a general economic indicator. Job losses in the oil fields have halted. The results for manufacturing and construction are sign posts for steel sales activity. In the big picture, layoffs are historically low and job openings are close to all-time highs therefore the year has started off well.
Explanation: On the first Friday of each month the Bureau of Labor Statistics releases the employment data for the previous month. Data is available at www.bls.gov. The BLS reports on the results of two surveys. The Establishment survey reports the actual number employed by industry. The Household survey reports on the unemployment rate, participation rate, earnings, average workweek, the breakout into full time and part time workers and lots more details describing the age breakdown of the unemployed, reasons for and duration of unemployment. At SMU we track the job creation numbers by many different categories. The BLS data base is a reality check for other economic data streams such as manufacturing and construction and we include the net job creation figures for those two sectors in our “Key Indicators” report. It is easy to drill down into the BLS data base to obtain employment data for many sub sectors of the economy. For example, among hundreds of sub-indexes are truck transportation, auto production and primary metals production. The important point about each of these hundreds of data streams is in which direction they are headed. Whenever possible we at SMU try to track three separate data sources for a given steel related sector of the economy. We believe this gives a reasonable picture of market direction. The BLS data is one of the most important sources of fine grained economic data that we use in our analyses. The States also collect their own employment numbers independently of the BLS. The compiled state data compares well with the federal data. Every three months SMU examines the state data and provides a regional report which indicates strength of weakness on a geographic basis. Reports by individual state can be produced on request.


