

Market Data

March 15, 2017
Oil and Gas Prices and Rotary Rig Counts through March 2017
Written by Peter Wright
The prices of oil and natural gas drive the consumption of oil country tubular goods (OCTG) and related steel products. The energy markets represent a large portion of the hot rolled coil used to make welded tubular goods as well as equipment used to drill and pump oil and natural gas.
Figure 1 shows historical oil and gas prices since January 2000.
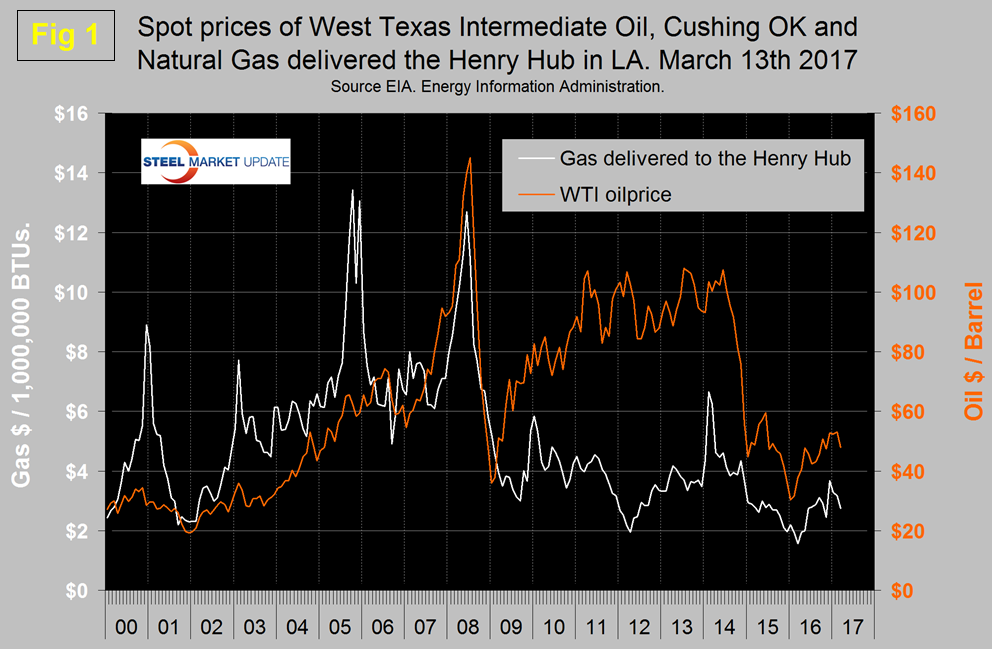
The daily spot price of West Texas Intermediate (WTI) rose through $50 on December 8th and stayed above that level until Wednesday last week (the 8th). Since then the price has declined each business day through the latest result for the 13th when it closed at $47.95. Brent closed at $50.10 on the same day. Data source is the Energy Information Administration (EIA). The recent decline was helped along by a huge rise in inventories reported late Tuesday and Wednesday last week, and the catalyst at the end of last week was another rise in active oil rigs. “The uptrend in U.S. crude stocks…has now become the dominant fundamental concern,” says Citi Futures’ analyst Tim Evans.
On March 13th The Heisenberg stated, “the Saudis are at a crossroads and their plight can’t be overstated.”
Here’s how Bloomberg’s “oil strategist” Julian Lee put it over the weekend: “Saudi Arabia has ended up with precisely what it didn’t want. Its output cut has left it supporting rival producers, while its sacrifice of volume has yielded little in the way of higher prices. Crude fell back on Thursday to levels not seen since before the producer group announced its historic oil output cuts on Nov. 30. The Saudis have now gotten themselves into a situation where they’ll have to decide whether they’re willing to endure some near-term pain in order to achieve long-term stability.”
On the morning of the March 10th the latest data from the EIA, the price of natural gas delivered the Henry Hub was $2.75, down from a recent high of $3.69 on December 9th. Natural gas fueled the largest share of electricity generation in 2016 at 33 percent, compared with 32 percent for coal and in 2017, natural gas and coal are both forecast to fuel 32 percent.
From HFIR Research March 13th. “Our discussion with two physical gas traders point to the disappointing natural gas rally being caused primarily by longs liquidating positions. While natural gas storage will remain 200 Bcf over the five-year average come April, storage will end over 470 Bcf lower than where we ended last year. This reduced surplus will help push storage below the five-year average sometime over the summer given the latest forecasted structural deficit.”
The total number of operating rigs in the US and Canada on March 10th was 1,083. Oil rigs in Canada fell by 26 in the latest two weeks of data as gas rigs were unchanged. The oil rig count in the US continues its steady march upward as gas rigs were unchanged in the latest two weeks of data. The y/y growth rate of US and Canadian total rigs was 60 percent and 221 percent, respectively. Figure 2 shows the Baker Hughes US Rotary Rig Counts for oil and gas equipment in the US (explanation below).
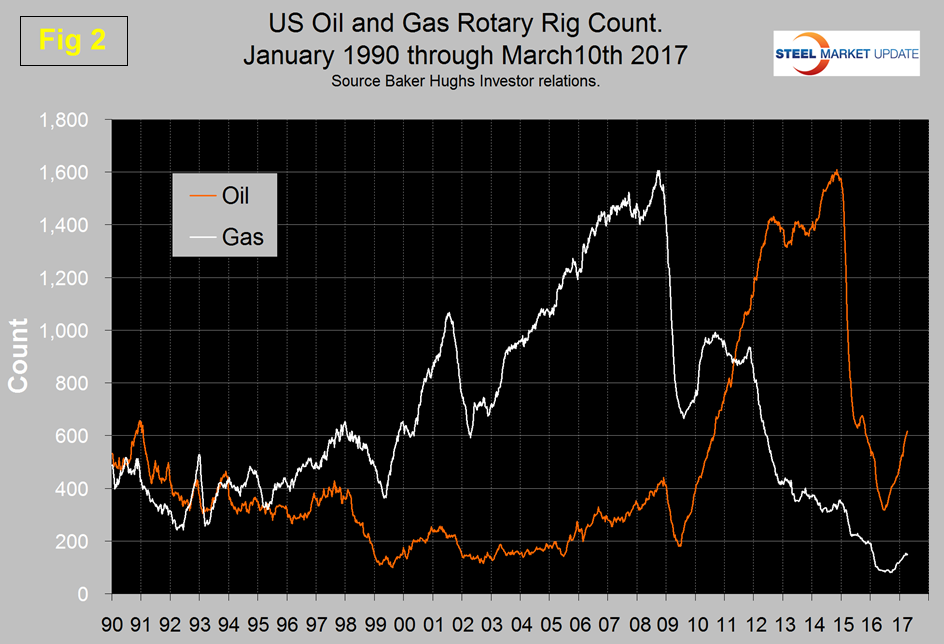
The uptick in the US oil rig count is now well established having increased from 316 on May 27th to 617 on March 10th. The gas rig count is growing more slowly and on March 10th was 151, up from a low point of 81 on August 5th.
On a regional basis in the US, the big three states for operating rigs are Texas, Oklahoma and North Dakota. Texas at 390 on March 10th was up from a low point of 173 on May 27th 2016 and up from 213 on March 11th last year. Oklahoma at 101 on March 10th was up from its low point of 54 on June 24th last year but has made no progress in the latest six weeks of data. North Dakota at 37 on March 10th has been flat for seven weeks but up from its low point of 22 on June 3rd.
The Baker Hughes Rotary Rig Count: These are a weekly census of the number of drilling rigs actively exploring for or developing oil or natural gas in the United States. Rigs are considered active from the time they break ground until the time they reach their target depth and may be establishing a new well or sidetracking an existing one. The Baker Hughes Rotary Rig count includes only those rigs that are significant consumers of oilfield services and supplies.


