

Market Data

May 3, 2017
US Gross Domestic Product - Q1 2017 First Estimate
Written by Peter Wright
The headline report of GDP growth in Q1 came in at 0.7 percent a decline from 3.53 percent in the third quarter and 2.08 percent in Q4 2016. Economy.com had this to say about first quarter tendencies. “The first quarter can be full of surprises; during this expansion, first quarter GDP growth has come in short of consensus expectations every time, with an average absolute forecast error of 0.47 percentage point. Residual seasonality in GDP implies that there is a predictable seasonal pattern. This is clear in the first quarter, as GDP tends to be noticeably weaker than in the subsequent three quarters. The differences are frequent and large enough that they are unlikely a fluke. Also, residual seasonality is evident across many of the major components of GDP, including parts of services spending, exports, federal and state and local government expenditures, and nonresidential structures.”
![]()
GDP is measured and reported in chained 2009 dollars and in the first estimate of Q4 was $16.805 trillion. The growth calculation is misleading because it takes the Q over Q change and multiplies by 4 to get an annualized rate. This makes the high quarters higher and the low quarters lower. Figure 1 clearly shows this effect.
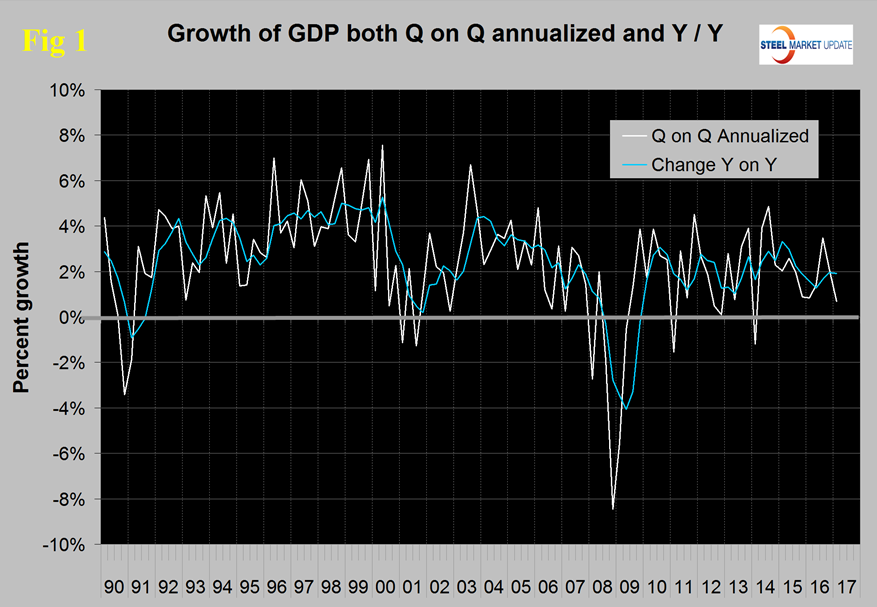
The blue line is the trailing 12 months growth and the white line is the headline quarterly result. On a y/y basis GDP was up by 1.92 percent in Q1 which was close to the 1.94 percent in Q4 2016 and close to the 2.08 percent average in 29 quarters since Q1 2010. Therefore we conclude that in recent quarters the growth of US GDP is in line with its average for the last sixteen years.
Figure 2 shows the headline quarterly results since 1990 and the April IMF forecast through 2022.
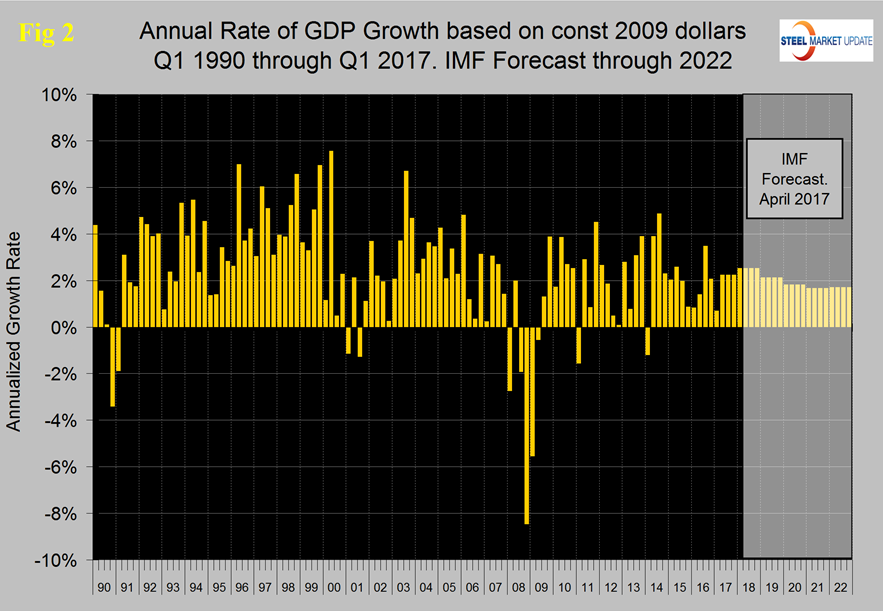
In their April revision, the IMF raised their forecast of US growth in 2017 from their October 2016 estimate of 2.2 percent to 2.31 percent and for 2018 from 2.10 percent to 2.52 percent.
Figure 3 shows the change in the six major subcomponents of GDP in Q1 2017.
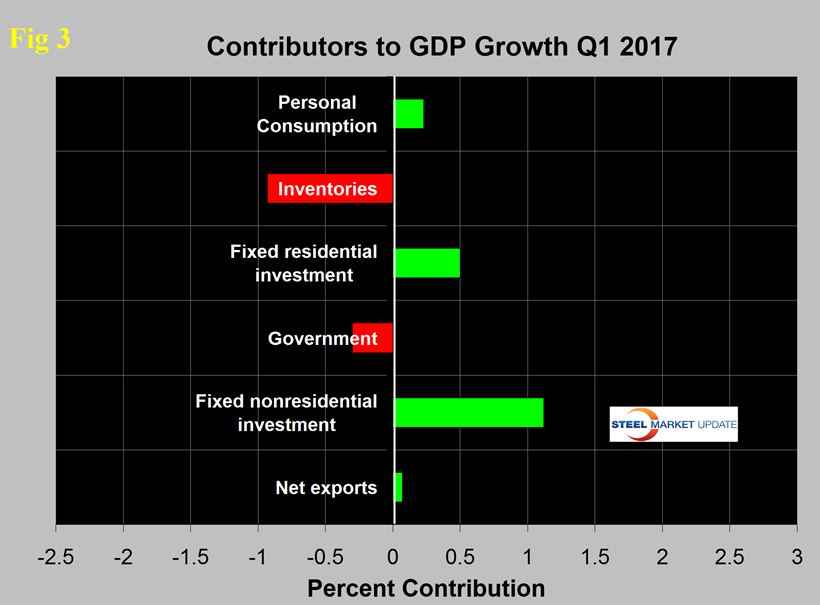
Normally personal consumption is the dominant growth driver, but not so in Q1 when this component fell to the lowest value since Q4 2009. Personal consumption includes goods and services, the goods portion of which includes both durable and non-durables. Moody’s had this to say, “Growth in consumer spending slowed dramatically in the first quarter. Weather undermined utility and vehicle spending. The latter was hurt by a major Northeast snowstorm in March. Sales will be made up, however, supporting second quarter growth. Delayed tax refunds may also have hurt spending as did payback from strong fourth quarter growth.”
The contribution of inventories was negative 0.93 percent deterioration from positive 1.01 percent in the previous quarter. Rising inventories have a positive effect on the overall GDP calculation and this was the case in Q3 and Q4 last year following five straight quarters when inventories contracted. Over the long run inventory changes are a wash and simply move growth from one period to another. The bright spot was fixed non-residential expenditures which were the strongest since Q1 2012. Residential expenditures had the highest contribution since Q4 2012.
Figure 4 shows the contributors to GDP extended back through Q1 2007 and describes the quarterly change in the six major subcomponents.
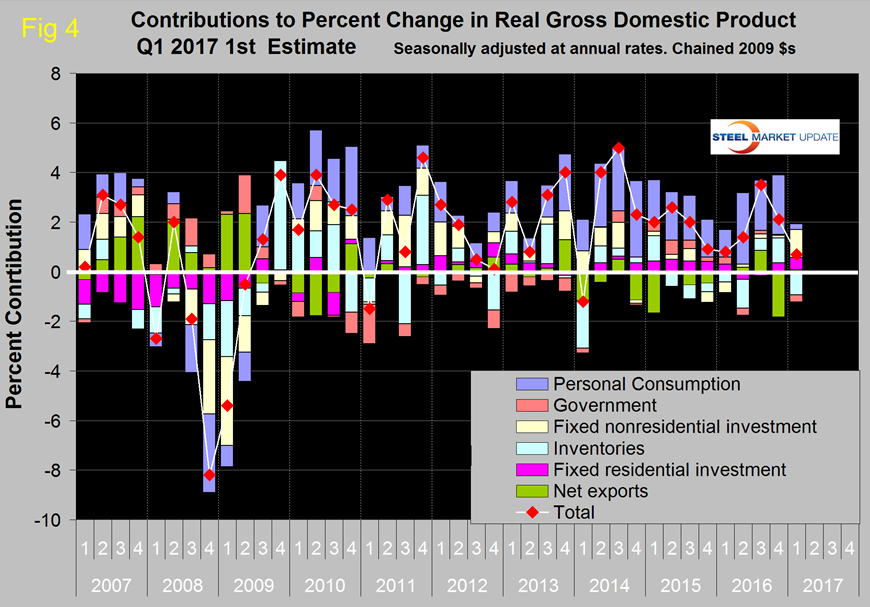
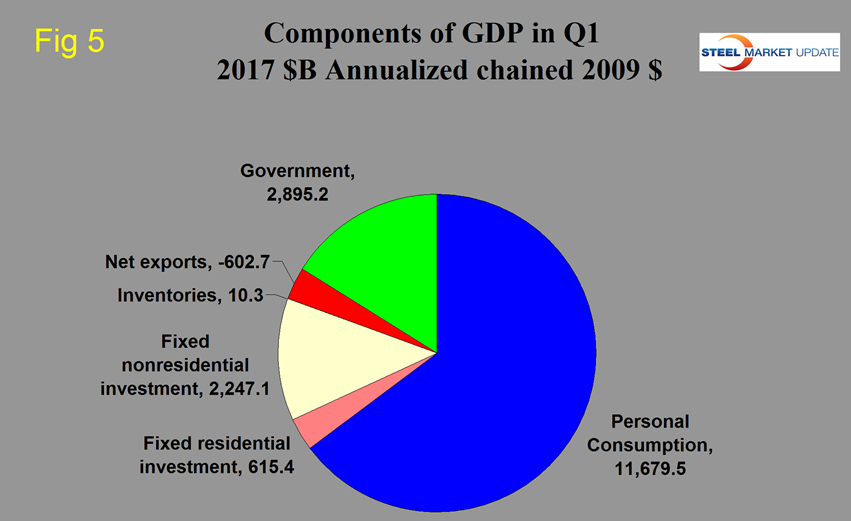
This diagram clearly shows the whipsaw effect of inventory changes in the last four quarters. Government expenditures contributed negative 0.3 percent, only the second quarter since Q4 2014 for this component to be a detractor. Figure 5 shows the breakdown of the $16.8 trillion economy.
SMU Comment: Net exports made a very small positive contribution influenced by the decline in the value of the dollar so far in 2017. This isn’t likely to last as the Fed appears committed to at least two more rate increases this year. The important thing to realize in our opinion is that GDP growth on a y/y basis has been fairly consistent since Q1 2010, during which period it has ranged from 1.04 percent to 3.31 percent. In contrast the headline Q/Q result (annualized) has ranged between negative 1.19 percent and positive 4.87 percent. There have only been two quarters when the y/y growth exceeded 3.0 percent growth in the last 26 quarters and zero quarters of negative growth. In the April IMF forecast of global and national growth rates the US is expected to continue at around 2 percent through 2022.


