Logistics
May 9, 2017
Flatbed Truck Availability Tightens as Demand Increases
Written by Sandy Williams
Flatbed trucks are generally first choice to move steel products from mills to distribution centers to manufacturing clients. What determines what freights will be for this workhorse of the steel industry?
Freight costs are influenced by fuel costs, weather, seasonal demand, historical costs, and load-to-truck ratios. Flatbed rates are particularly vulnerable to weather conditions in the Midwest and Northern states. During winter months, flatbed capacity shifts to the South, pushing rates up in the colder regions as fewer trucks become available and weather conditions make driving more hazardous. During summer weather, capacity generally eases in the region but can still be volatile due to other factors.
Seasons also affect freight costs due to changes in demand for certain commodities. The steel industries biggest competitors for flatbed truck usage are the construction and the oil and gas industries and, lately, wind energy. Load-to-truck ratios can change depending on demand from other industries.
In April, the average flatbed load-to-truck ratio was 43.7 loads per truck compared to 3.5 for vans and 6.6 for reefers. According to DAT Trendlines, flatbed demand has increased 102 percent year over and has been on an upward trend since August 2016. The ratio rose 19 percent from March to April. With late spring and early summer the peak seasons for flatbed demand, capacity may tighten further, says DAT.

Demand has been particularly intense in the Gulf Coast regions as LNG exports picks up. Wind energy is also claiming capacity for shipment of wind turbines. Texas, as a manufacturing hub for wind towers, has three of the top spot markets for flatbed freight in the U.S., according to DAT Trendlines. A reader, whose inquiry prompted this article, told SMU that trucking is really tight right now in the South, especially out of Decatur, Berkeley, Calvert and Columbus.
The construction industry moves lumber, steel and other construction materials by flatbed truck. Demand for residential and nonresidential construction is currently strong and set to increase as funding is allotted to infrastructure projects.
The automotive industry, tied closely to the steel industry, not only receives raw products by flatbed trucks but also uses flatbeds to ship out its finished products.
Flatbed rates were relatively steady during the past year but have been in on a gradual upward trend since January. Rates were at a national average of $2.07 per mile as of April 29, 2017. The DAT Trendlines chart below shows national average line haul rates and fuel surcharges for flatbeds in the past 13 months.

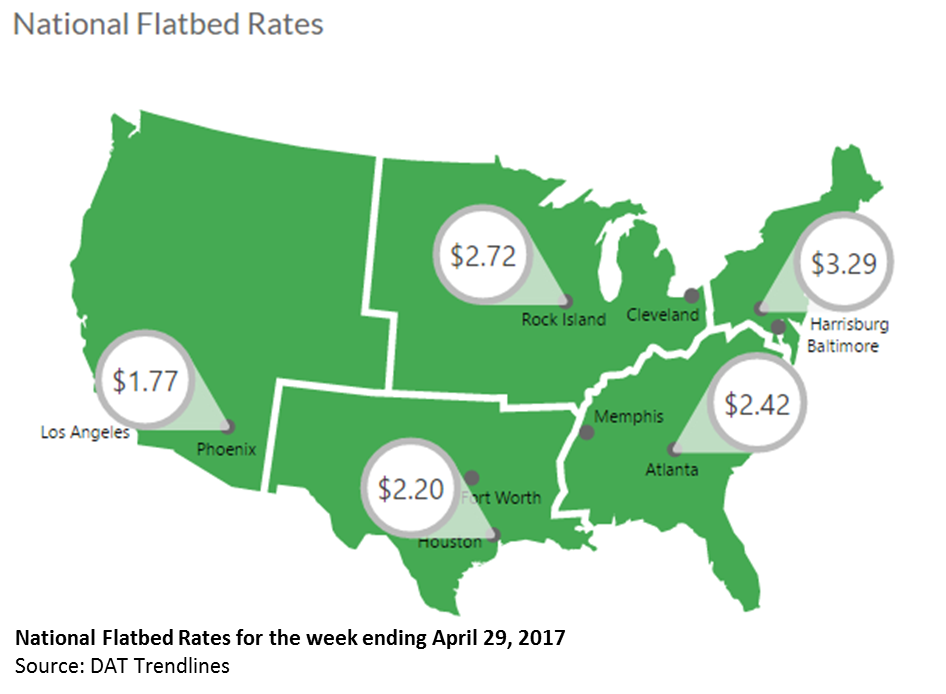
If you look at the geographical chart from DAT Trendlines below you can see the variation in rates across the country. Rates are higher in the Midwest and Eastern U.S.
Diesel fuel rates have been relatively steady this year at a national average of $2.56/gallon as of May 8, 2016. Diesel prices also vary by geographical region as indicated by the Energy Information Administration chart below.

The various components that affect freight costs make it difficult to project rates and availability. Watching the load-to-truck ratio is a good indicator for potential increase or decreases in shipping costs. As flatbed availability tighten in a region, prices are likely to increase.