

Market Data

May 26, 2017
Currency Update for Steel Trading Nations
Written by Peter Wright
Please see the end of this report for an explanation of data sources.
![]() On May 22 Arun Chopra of Fusion Point Capital wrote: “The dollar has been on a 2 year plus uptrend. When the dollar broke out we saw oil and all commodities collapse. An important long term trend line has broken, having implications across the markets. Global ‘coordinated jawboning’ appears to be having an impact. The dollar is arguably one of the most important assets with respect to asset prices in the entire financial markets. It drives relative currency values, commodity prices, and even corporate earnings. It impacts inflation, and most importantly global deflation. My view up until the last few weeks had been that the dollar was in a sustainable longer term bull market, both technically and fundamentally. Things appear to be changing. Since the dollar bull market that began in 2014, we’ve naturally seen oil prices and a variety of related markets show significant weakness. We’ve also seen the fed for the most part look the other way.”
On May 22 Arun Chopra of Fusion Point Capital wrote: “The dollar has been on a 2 year plus uptrend. When the dollar broke out we saw oil and all commodities collapse. An important long term trend line has broken, having implications across the markets. Global ‘coordinated jawboning’ appears to be having an impact. The dollar is arguably one of the most important assets with respect to asset prices in the entire financial markets. It drives relative currency values, commodity prices, and even corporate earnings. It impacts inflation, and most importantly global deflation. My view up until the last few weeks had been that the dollar was in a sustainable longer term bull market, both technically and fundamentally. Things appear to be changing. Since the dollar bull market that began in 2014, we’ve naturally seen oil prices and a variety of related markets show significant weakness. We’ve also seen the fed for the most part look the other way.”
The Broad Index value of the US $ is reported several days in arrears by the Federal Reserve, the latest value published was dated May 12th (Figure 1).
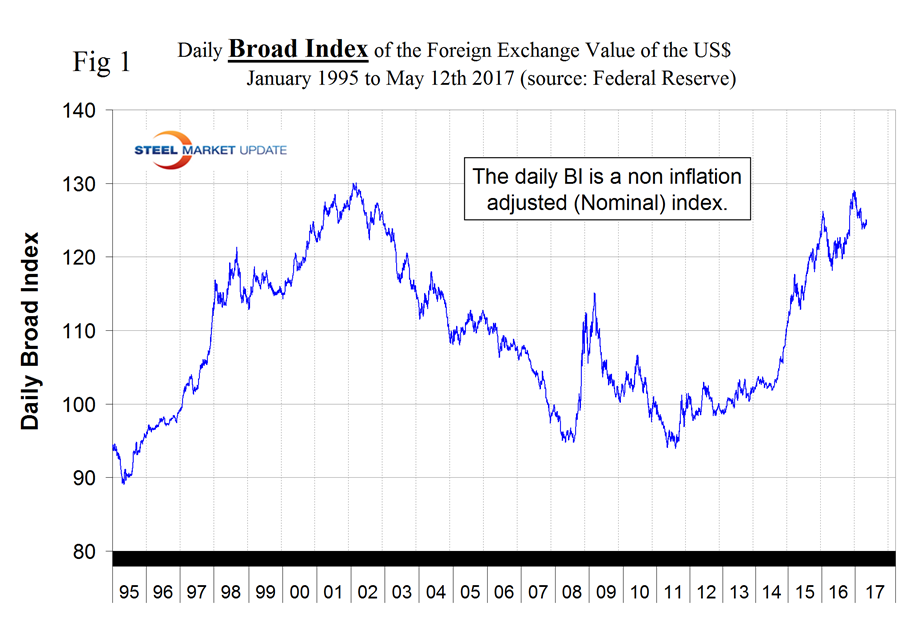
The dollar had a recent peak of 128.963 on January 3rd which was the highest value since May 4th 2004, almost 15 years. Traders anticipate interest rate differentials and have become much less hawkish on the dollar. Since January 3rd the dollar has weakened to 124.36 a decline of 3.6 percent but in month prior to May 12th there was a 0.4 percent recovery.
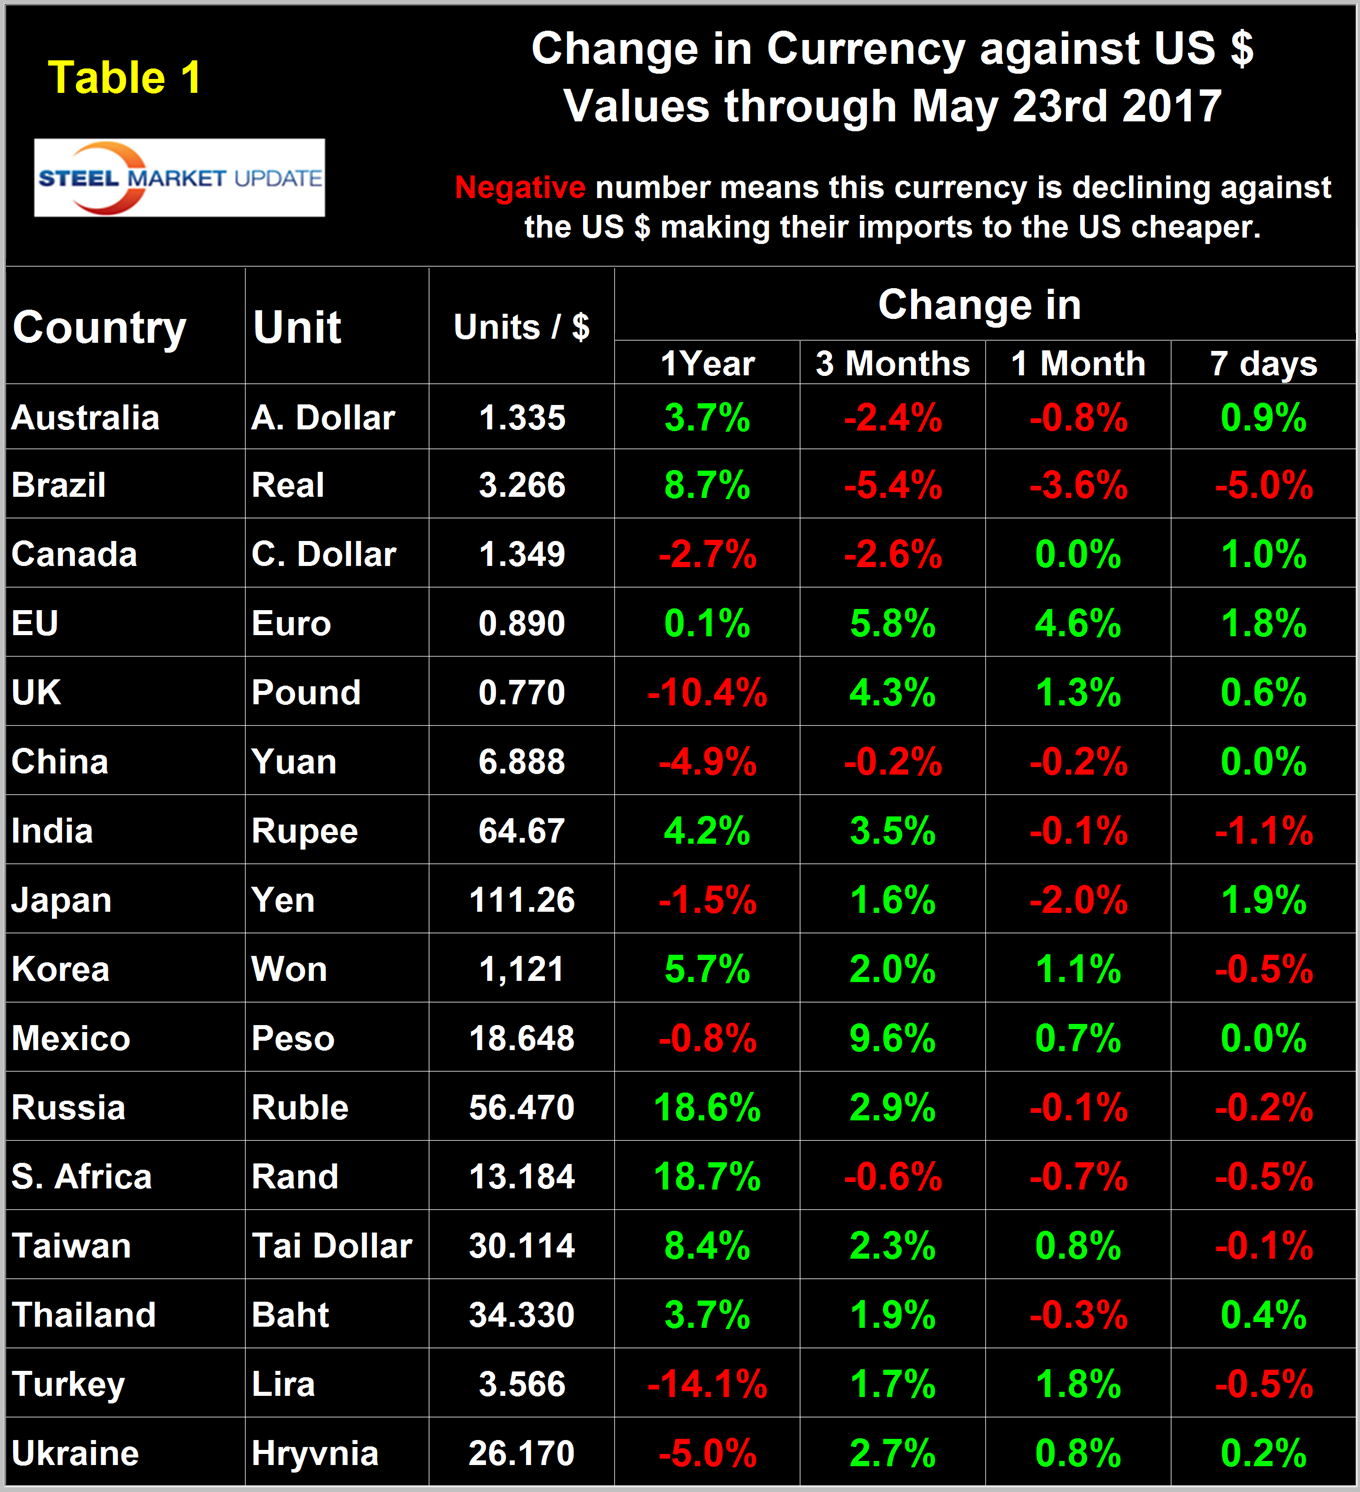
Each month we publish an update of Table 1 which even though it shows the change in value in four different time frames is still a bit of a snapshot of the value of the major sixteen steel and iron ore trading nations. Snapshots are something we try to avoid in all our data presentations because direction is everything.
We are now taking a supplemental look as shown in Figure 2.
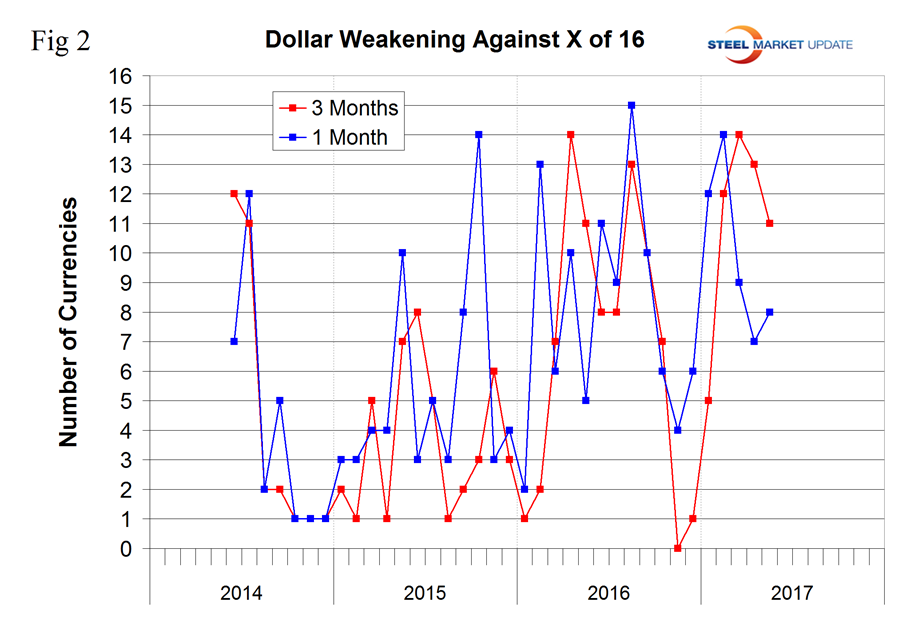
This shows that since our last update on April 26th, the currency market has been fairly quiet, at least in terms of the steel trading nations. In the last month the $ weakened against 8 of the 16 and in the last three months it weakened against 11 of the 16. Table 1 is color coded to indicate strengthening of the dollar in red and weakening in green. We regard strengthening of the US Dollar as negative and weakening as positive because the effect on the trade balance of all commodities and also of the total national trade deficit.
In each of these reports we comment on a few of the 16 steel trading currencies listed in Table 1. Charts for each of the 16 currencies are available through May 23rd for any premium subscriber who requests them. We also include writings from experts who we regard as credible to explain some of the currency moves that we are experiencing.
The Brazilian Real
The Brazilian Real has declined by 5.9 percent in the last seven days and after a strong appreciation in 2016 is back to where it was on January 2nd. (Figure 3).
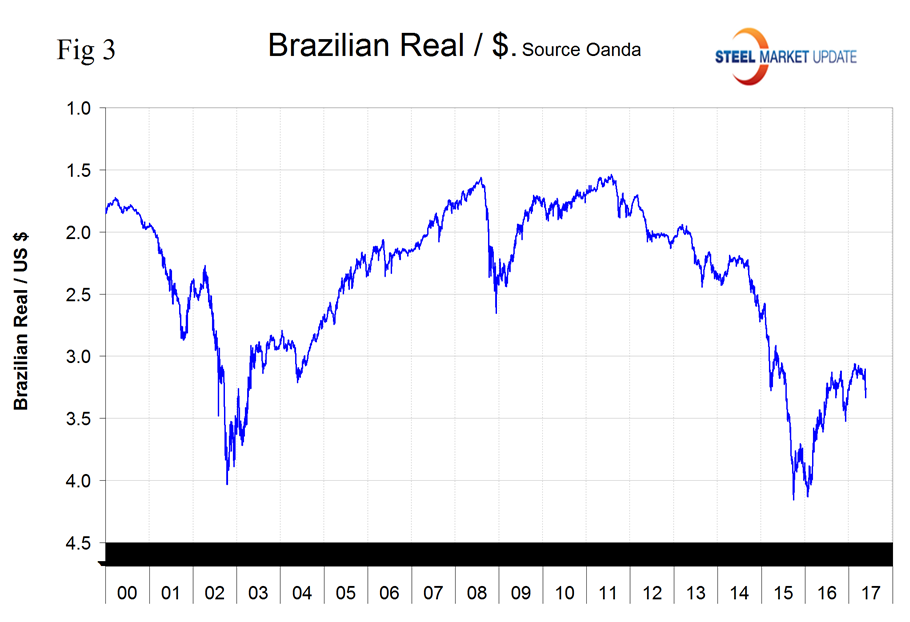
Reuters wrote the following on May 19th. Brazil’s worst-ever recession intensified unexpectedly in the final quarter of 2016, data showed on Tuesday, frustrating hopes for signs of a recovery and stepping up pressure on President Michel Temer and the central bank to do more to promote growth. Brazil’s gross domestic product contracted by 3.6 percent last year, statistics agency IBGE said, following a 3.8 percent drop in 2015. The nation’s two-year downturn is the longest and deepest on record for Latin America’s biggest nation. The economic contraction worsened in the fourth quarter, with a steeper-than-expected decline of 0.9 percent, following a 0.7 percent drop in the previous three months. Investment tumbled 10.2 percent in 2016, in a sharp drop that is partly blamed by economists on Brazil’s chronically high interest rates. The central bank started to cut its benchmark rate from a decade-high of 14.25 percent in October and is expected to take it to single digits this year.
The Australian Dollar
On May 23rd the Ausie was worth 0.749 US $ and had declined 2.4 percent in 3 months with a recovery of 0.9 percent in seven days (Figure 4).
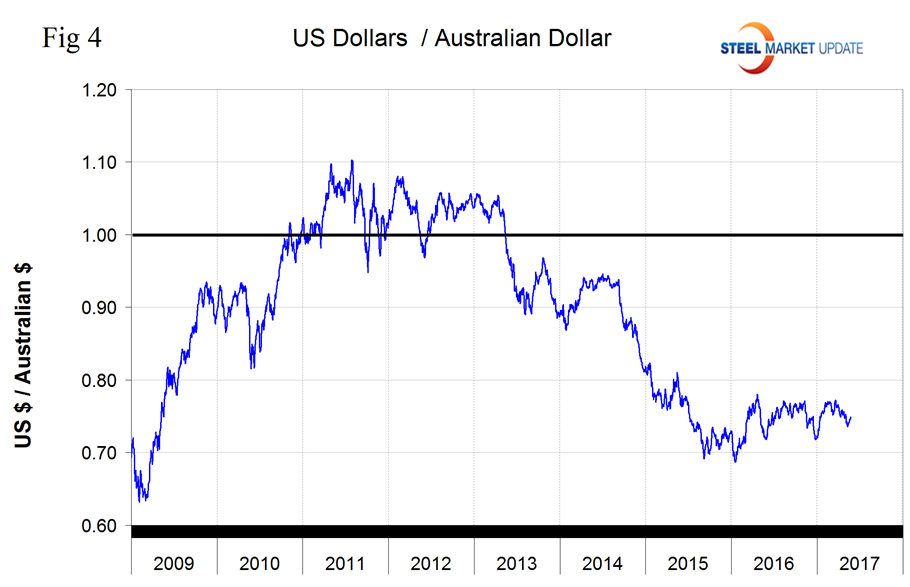
On May 22nd Dean Popplewell wrote: “There could be tactical buying ahead of the OPEC meeting as the knock-on effect of the rising oil prices will likely underpin commodities in general. Whether this ends up little more than 15 minutes of fame type trade will greatly depend on OPEC. Also, the Aussie could get some support if US political concerns turn into a broader US dollar sell off. If oil prices rise as a result of the May 25th OPEC meeting there could be tactical buying of the Australian dollar. All in all, too many questions and not enough answers in the Aussie trade which should keep current ranges in place.”
The Euro
On May 23rd the Euro was worth 1.1231 US dollars. It has appreciated by 5.8 percent in the last three months of which 1.8 percent occurred in the last seven days. There has been an accelerating appreciation in the course of 2017 (Figure 5).
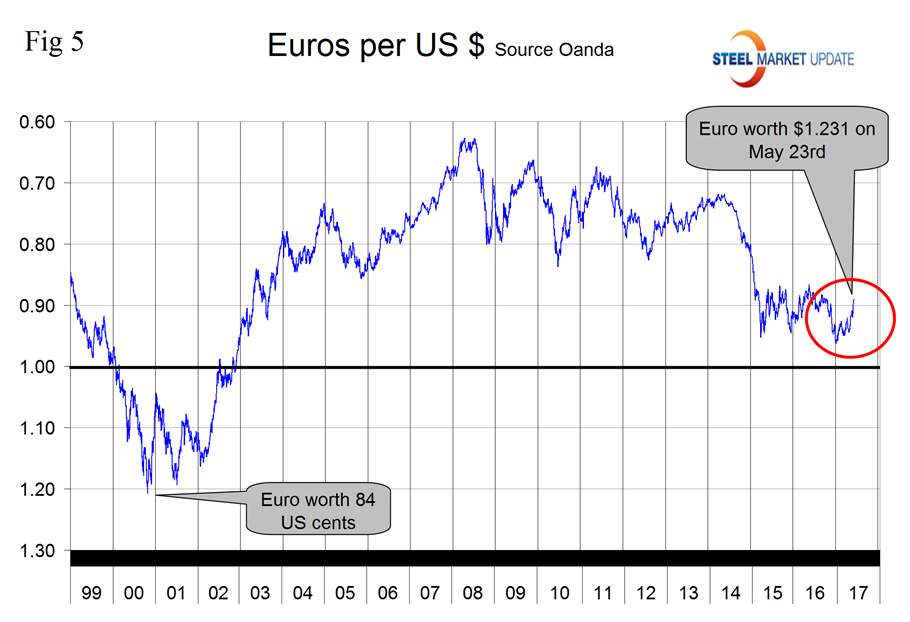
Growth in the Eurozone will be slightly stronger this year than previously forecast, the European Commission said, adding that some risks to the outlook have eased following the defeat of populist parties in France and the Netherlands. The institution sees the 19-nation economy expanding 1.7 percent this year – up from 1.6 percent forecast in February – and growing 1.8 percent in 2018.
On May 17th investing.com wrote, “Demand for the euro continued to be underpinned as investors shifted their attention back to the outlook for monetary policy. Concerns over political risks receded after centrist Emmanuel Macron was elected France’s president over far-right nationalist Marine Le Pen. Data released on Tuesday last week confirmed that the euro area economy grew by 0.5 percent in the first quarter, fueling speculation over how soon the European Central Bank could scale back its stimulus program. Another report showed that German economic sentiment continued to improve in May, hitting its highest since July 2015.”
The Japanese Yen
In the last three months the Yen has appreciated by 1.6 percent, all of which occurred in the last seven days (Figure 6).
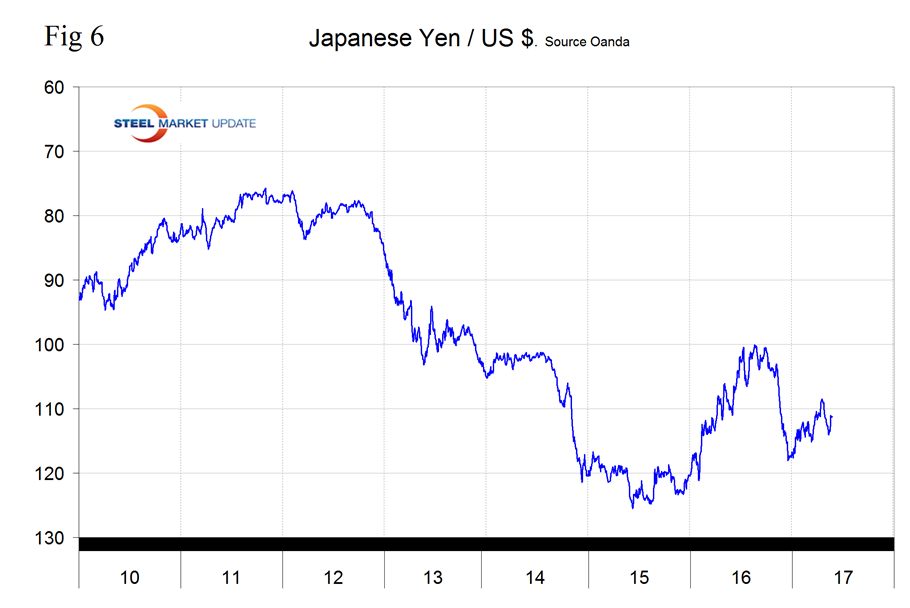
On May 19th D.H. Taylor wrote: “I think it is almost futile to think that Japanese interest rates are ever going to outpace any major economy in the world. I do not believe that at any time there will be some kind of normalization in Japan. They have a negative population growth with an increasing debt burden leading to stagnant economic growth. Money will continue to pour out of Japan looking for a higher interest rate to invest, continuing to degrade Japan’s economic outlook. The JPY will edge lower over time against the USD.”
On April 1st 2017 the Japanese government was the first of a major economic nation to recognize Bitcoin. Japan has a market highly accepting of innovative technologies. This acceptance by the world’s third largest economy is a huge boon to cryptocurrencies. Russia is also attempting to legitimize, as it would help the government crack-down on money laundering.
Explanation of Data Sources: The broad index is published by the Federal Reserve on both a daily and monthly basis. It is a weighted average of the foreign exchange values of the U.S. dollar against the currencies of a large group of major U.S. trading partners. The index weights, which change over time, are derived from U.S. export shares and from U.S. and foreign import shares. The data are noon buying rates in New York for cable transfers payable in the listed currencies. At SMU we use the historical exchange rates published in the Oanda Forex trading platform to track the currency value of the US $ against that of sixteen steel trading nations. Oanda operates within the guidelines of six major regulatory authorities around the world and provides access to over 70 currency pairs. Approximately $4 trillion US $ are traded every day on foreign exchange markets.


