

Market Data

June 28, 2017
Currency Update for Steel Trading Nations
Written by Peter Wright
Please see the end of this report for an explanation of data sources.
The analysis of currency trends is a highly technical undertaking; therefore we at SMU rely on the opinions of experts for much of our commentary.
![]()
As expected, the Fed raised its policy rate range by 25 basis points on June 14. This was a bit of a non-event with little commentary in the financial press. Max Loh, a special situations investment advisor, wrote the following on June 20: “There are some signs USD strength might be returning. In the recent Fed meeting in June, the Fed raised rates as largely expected, but that was not the part of the meeting the markets were focusing on. The markets were watching for what the Fed had to say about its plan to normalize its balance sheet, and the Fed for the first time provided details on how it planned to go about the normalization process, slated to begin in September this year. On top of that hawkish move, the Fed stated it planned to raise rates one more time this year (largely expected), and also played down the significance of soft inflation figures. Overall, the Fed struck a relatively hawkish note, which gave a boost to the USD Index after the meeting.”
The RMB Group had this to say: “While the dollar has not entered bear market territory yet, recent weakness could signal a change in the fundamental picture. What fascinates us most is that, with the exception of a brief run to new highs in the first week of 2017, the greenback has essentially been moving sideways for the past two years despite its huge interest rate advantages over Europe and Japan. As the Fed raises rates these advantages could grow. But the dollar doesn’t seem to care. Markets that move in a direction opposite those suggested by underlying economic fundamentals are either mispriced or acting as a precursor to a change in those fundamentals. While the dollar has not entered bear market territory yet, recent weakness could signal a change in the fundamental picture. With a fully priced stock market and the isolationist wing of the White House in ascendance, the U.S. is in danger of losing ground to Europe and emerging markets in the fight for global capital. This could reduce the bullish pull of its high relative interest rates–and perhaps negate them altogether.”
Said Andrew Hecht on June 9: “The technical path of least resistance for the currency of the United States has been lower since the January highs. The economic prospects in Europe are improving, and the political situation of the Union has stabilized in the wake of the French election. In the United States, the Trump administration has been under fire since inauguration day. The president has had his hands full when it comes to fulfilling pledges made on the campaign trail. All signs are pointing lower for the dollar, and the one thing to remember about currencies is that they tend to trend in the same direction for long periods. The dollar rallied by 27 percent in 10months from May 2014 through March 2015. It then consolidated from March 2015 through November 2016, a 20-month period. The rally that took the dollar to the highest level since 2002 quickly ran out of steam in January, and now the greenback is searching for a bottom, which is proving elusive.”
The Broad Index value of the U.S. dollar is reported several days in arrears by the Federal Reserve; the latest value published was dated June 16 (Figure 1).
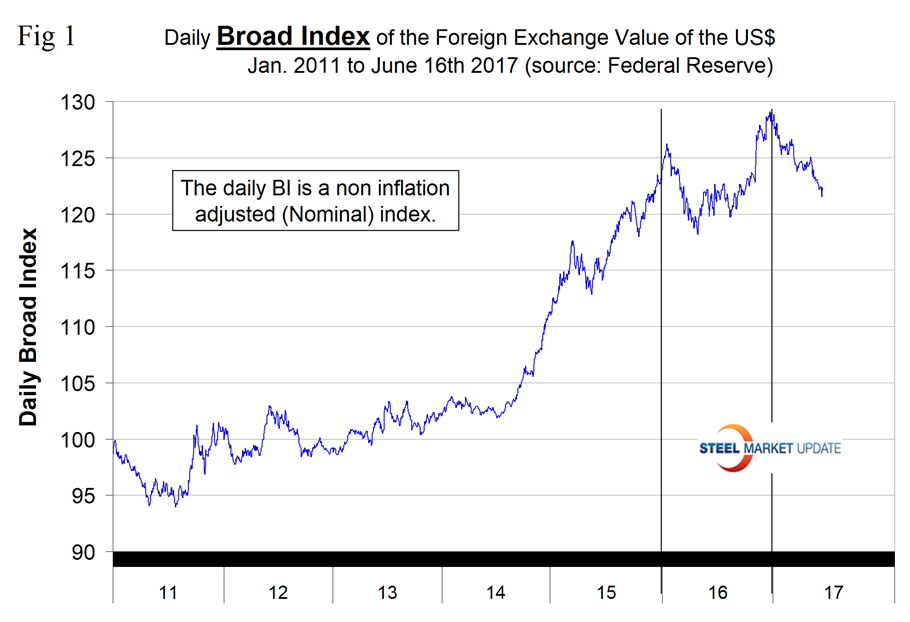
The dollar had a recent peak of 128.963 on January 3, which was the highest value since June 4, 2004, almost 15 years ago. Traders anticipate interest rate differentials and have become much less hawkish on the dollar. Since January 3 the dollar has weakened to 122.11, a decline of 5.3 percent. This was the lowest value since October 5 last year.
Each month we publish an update of Table 1. Even though it shows the change in value in four different time frames, it is still a bit of a snapshot of the value of the 16 major steel and iron ore trading nations.
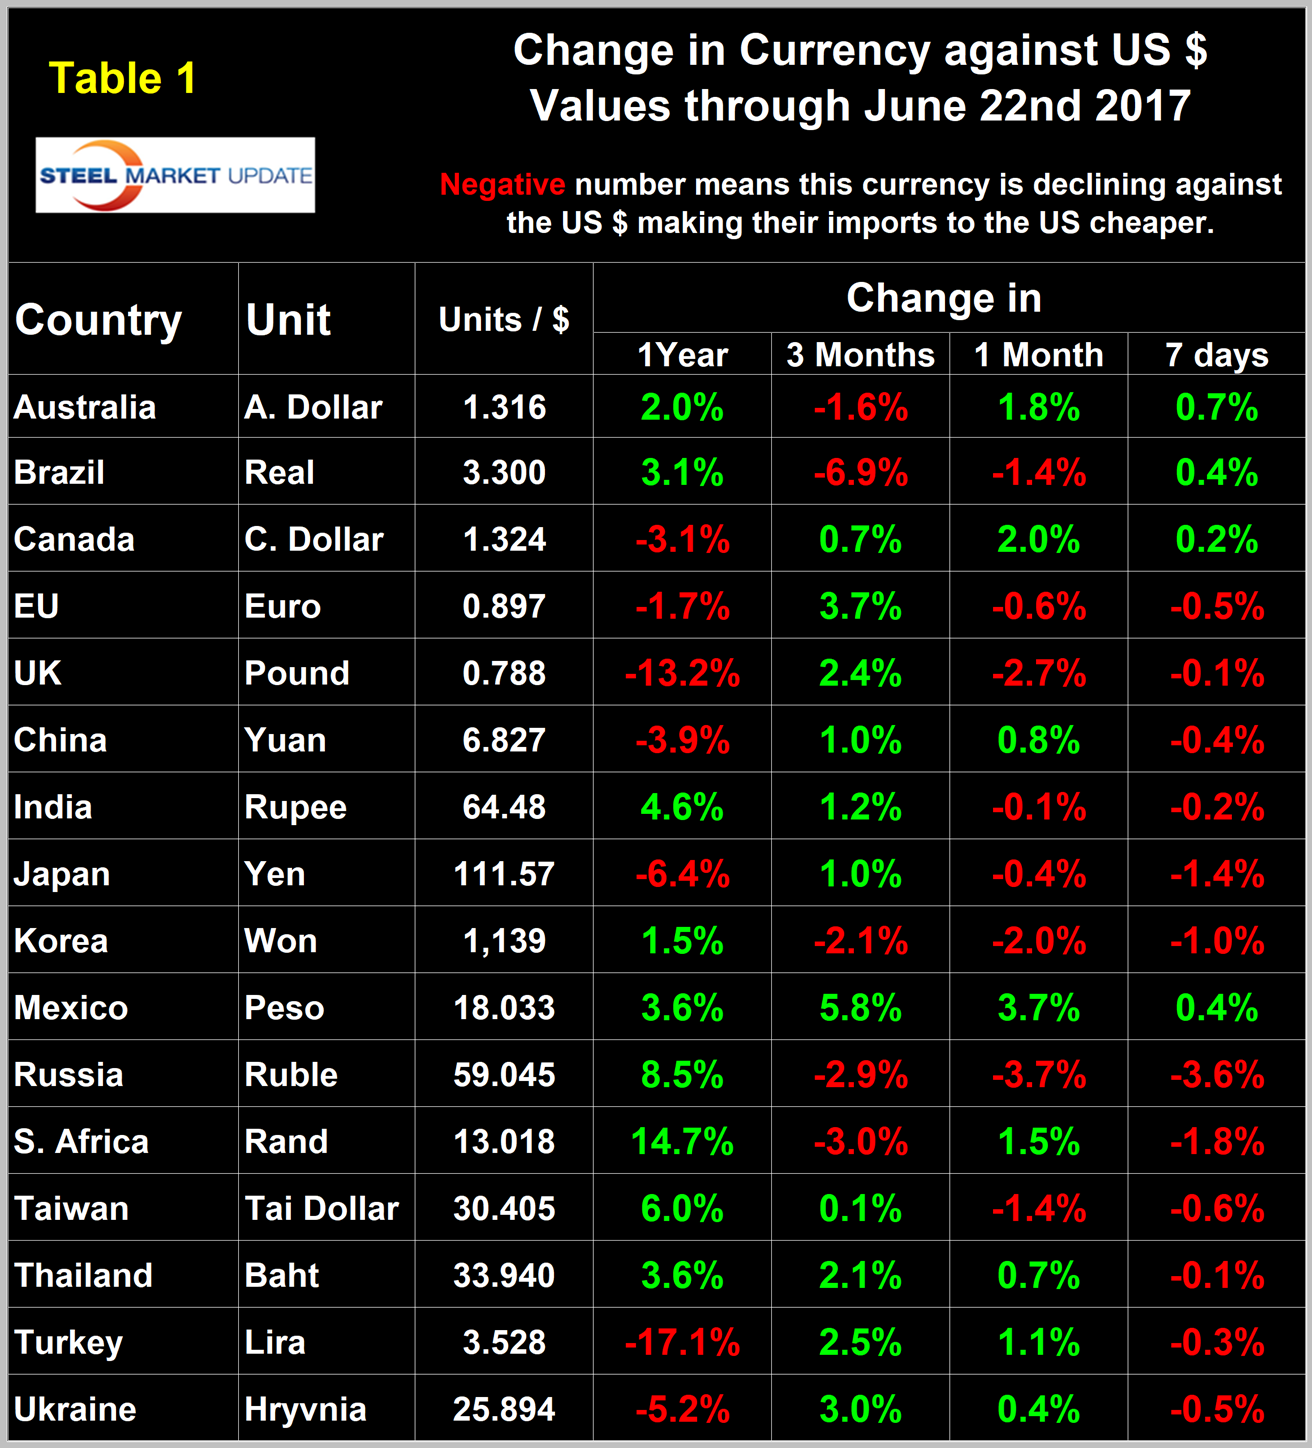
Snapshots are something we try to avoid in all our data presentations because direction is everything. We are now taking a supplemental look as shown in Figure 2.
This shows that since our last update on May 23 the currency market has been quiet, at least in terms of the steel trading nations. In both May and June, the dollar weakened against 8 of the 16 in one month and against 11 of the 16 in three months. Table 1 is color coded to indicate strengthening of the dollar in red and weakening in green. We regard strengthening of the U.S. dollar as negative and weakening as positive because of the effect on the trade balance of all commodities and also of the total national trade deficit.
In each of these reports, we comment on a few of the 16 steel trading currencies listed in Table 1. Charts for each of the 16 currencies are available through June 22 for any premium subscriber who requests them. We also include writings from experts whom we regard as credible to explain some of the currency moves that we are experiencing.
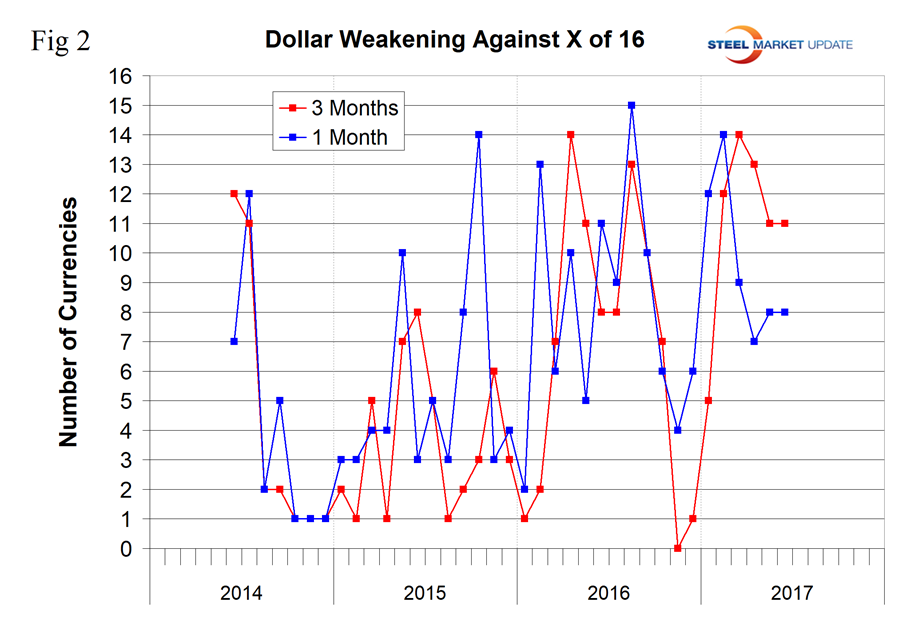
The Mexican Peso has strengthened against the U.S. dollar by 5.8 percent in three months, by 3.7 percent in 30 days and by an astonishing 21 percent since January 11 (Figure 3).
The Mexican peso has recovered all its losses vs. the greenback since President Trump was elected, discounting the worst fears of a trade war between the U.S. and its southern neighbor. A series of rate hikes by Mexico’s central bank has added to the rally, as well as a win by President Nieto’s PRI party in the election for governor of the country’s largest state.
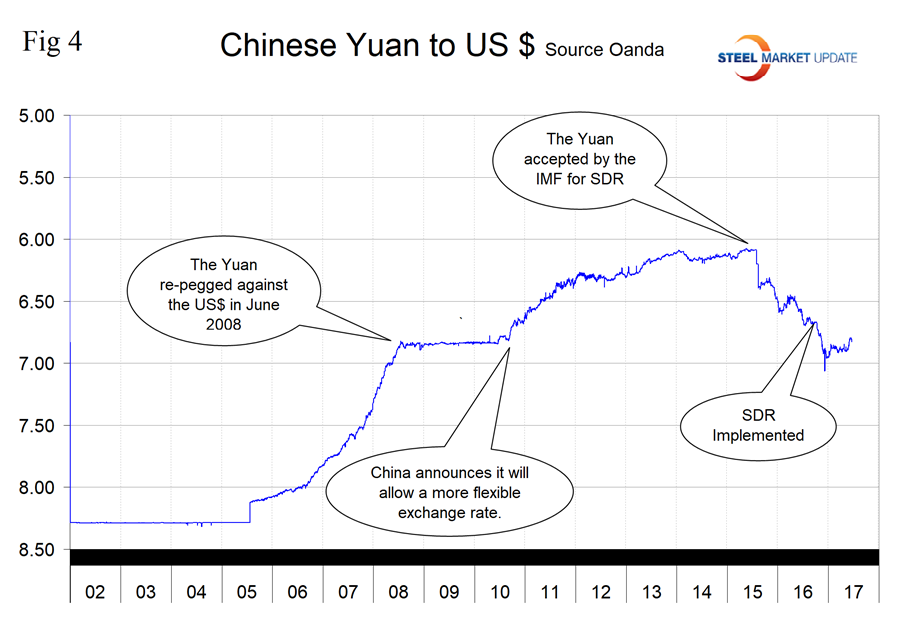
The Chinese Yuan has appreciated slightly this year after it dived to its lowest value in almost 10 years on December 6 last year. The Yuan has appreciated by 1.0 percent in three months and by 0.8 percent in thirty days (Figure 4).
The Euro: On June 22, the Euro was worth 1.1146 U.S. dollars. It has appreciated by 3.7 percent in the last three months and had depreciated by 0.6 percent in 30 days. There has been an accelerating appreciation in the course of 2017 (Figure 5).
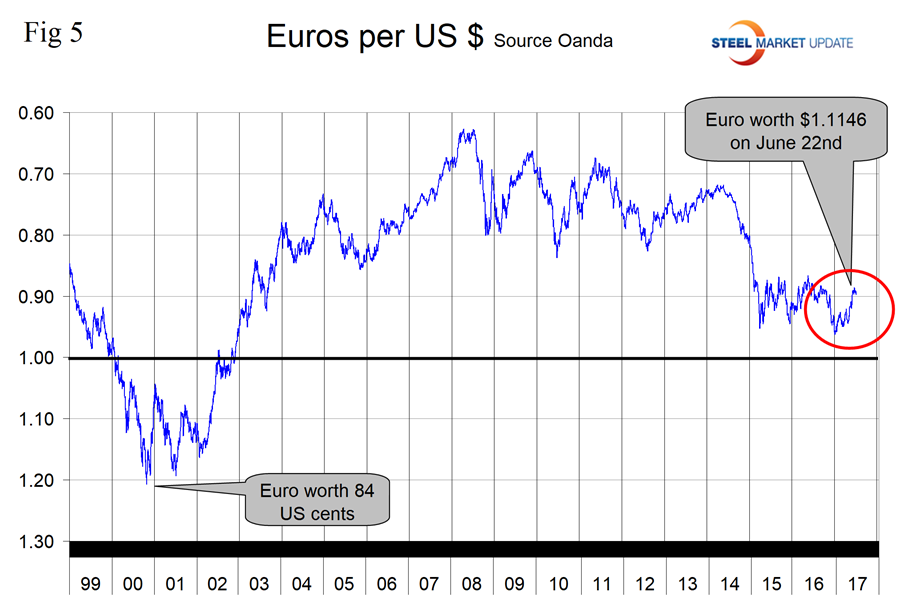
Andrew Hecht wrote on June 7: “2016 through early 2017 was a terrible period for the Euro currency. The Brexit vote one year ago threatened the very existence of the European Union, and elections in 2017 could have dealt additional blows to the Union and the Euro currency. Additionally, a series of terrorist attacks in France, Belgium and Germany fueled nationalist movements in the nations and the chances for a rejection of the European Union’s immigration and economic policies. However, the status quo pro-EU factions prevailed in the Netherlands and France, and now the Euro is making a big comeback from the depths of despair. The Euro has rallied from the lowest level since 2002 at 1.03675 in December 2016 to highs of $1.1294 recently. The dollar is now at the lowest level of the year, and the Euro is flirting with highs. Technical resistance for the Euro is at $1.1317, and above there $1.16305 and $1.1718 stand as levels to watch. Recent comments from the European Central Bank President, Mario Draghi, imply that quantitative easing could be ending in 2017 and that interest rates may soon rise from negative forty basis points. When QE ended in the U.S. in 2014, and the Fed started talking about interest rate hikes, the dollar took off to the upside. The final test for the Euro will be the German election in September, but the odds favor a fourth term for Chancellor Angela Merkel, which will be another validation of the status quo for the EU. The trajectory of the Euro currently supports a lower dollar. Perhaps the one issue that weighs on Europe aside from the constant threat of terrorism is economic uncertainty in Italy.
The Japanese Yen: In the last three months the Yen has appreciated by 1.0 percent, but had declined by 0.6 percent in the last 30 days. The Yen is up by 6.8 percent since November 9, Figure 6.
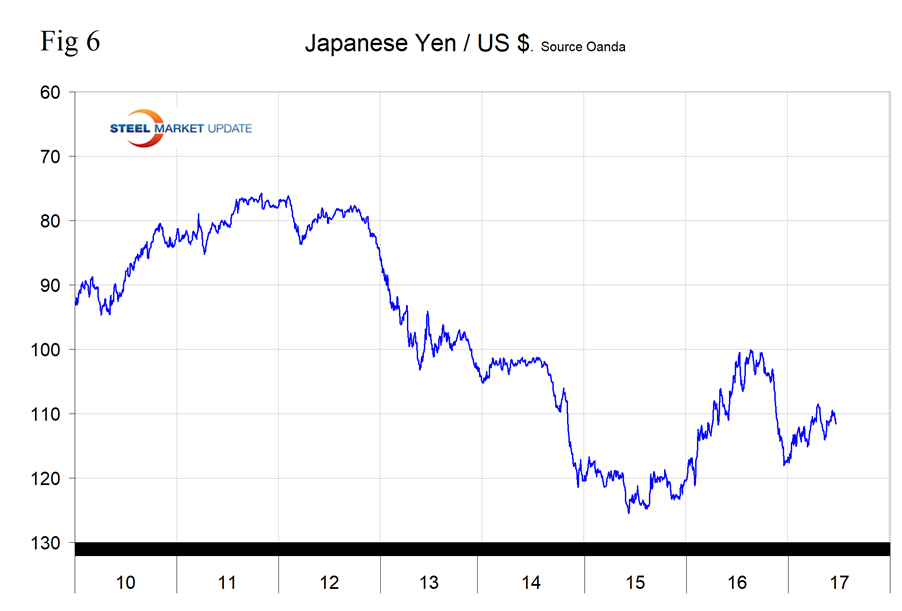
The Bank of Japan kept its negative interest rates on hold in its June review, pledging to keep asset purchases around the current target of ¥80T ($727M) and sounding more upbeat on the economy. “Private consumption has increased resilience against a background of steady improvement in the employment and income situation,” the BOJ said in a statement.
The Korean Won has depreciated by 2.1 percent in the last three months, almost all of which occurred in the last 30 days. On June 22 it took 1,139 Won to buy a U.S. dollar (Figure 7).
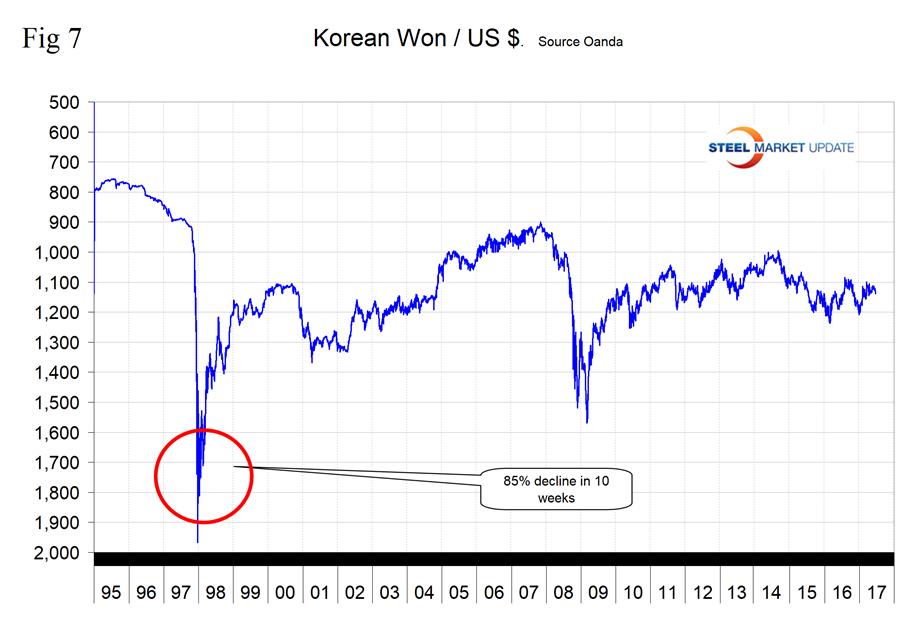
Korea presently is in fourth place as an importer of steel to the U.S. after Canada, Brazil and Russia, in that order. In these summaries, we like to include information from experts, but in the case of Korea we never see commentary in the sources that we peruse.
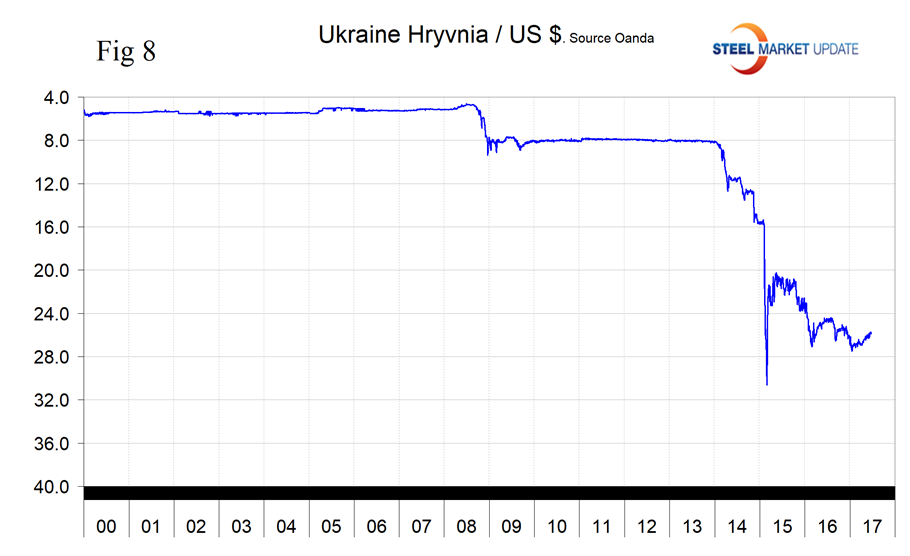
The Ukrainian Hryvnia: As with Korea, we never see anything published about this currency either, but it is included in Table 1 because Ukraine is a serious player in the global steel market. As an importer of steel to the U.S., Ukraine is currently in 17th place. As a global exporter of HRC, Ukraine is in 7th place after China, Japan, South Korea, Russia, Taiwan and the EU, in that order. On June 22, it took 25.89 Hryvnias to buy one U.S. dollar. The Hryvnia has appreciated by 3.0 percent in the last three months (Figure 8).
Explanation of Data Sources: The broad index is published by the Federal Reserve on both a daily and monthly basis. It is a weighted average of the foreign exchange values of the U.S. dollar against the currencies of a large group of major U.S. trading partners. The index weights, which change over time, are derived from U.S. export shares and from U.S. and foreign import shares. The data are noon buying rates in New York for cable transfers payable in the listed currencies. At SMU, we use the historical exchange rates published in the Oanda Forex trading platform to track the currency value of the U.S. dollar against that of 16 steel trading nations. Oanda operates within the guidelines of six major regulatory authorities around the world and provides access to over 70 currency pairs. Approximately $4 trillion U.S. dollars are traded every day on foreign exchange markets.


