Analysis

July 24, 2017
Auto Assembly Moves to Mexico, Vehicle Sales Slow
Written by Peter Wright
Light vehicle sales are slowing and Mexico continues to take production share from the U.S.
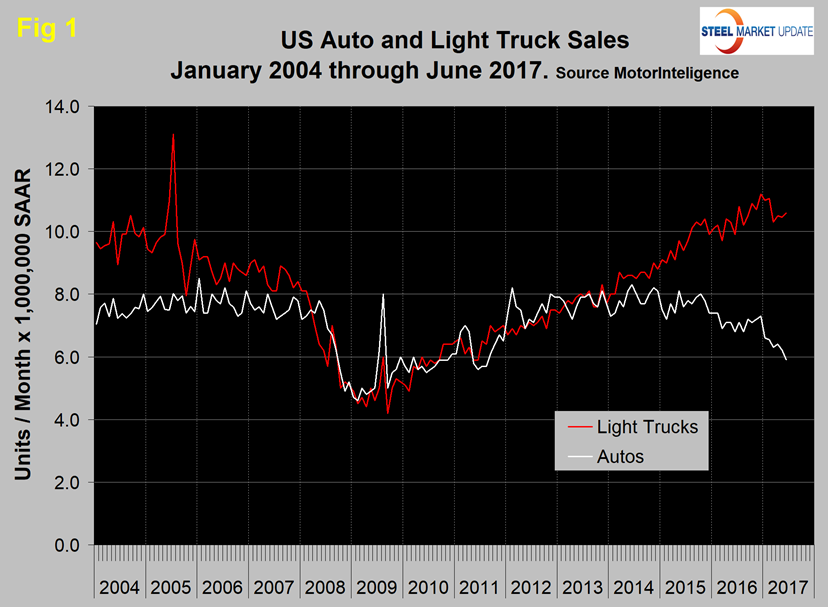
Vehicle sales in the U.S. averaged 17.0 million units at a seasonally adjusted annual rate (SAAR) in the first six months of 2017, down from 18.1 million in Q4 2016. March through June monthly sales were each below 17.0 million units SAAR for the first time since June last year. In June, light truck sales increased from 10.46 million in May to 10.59 million units, but autos declined from 6.20 to 5.91 million.
Figure 1 shows auto and light truck sales since January 2004.
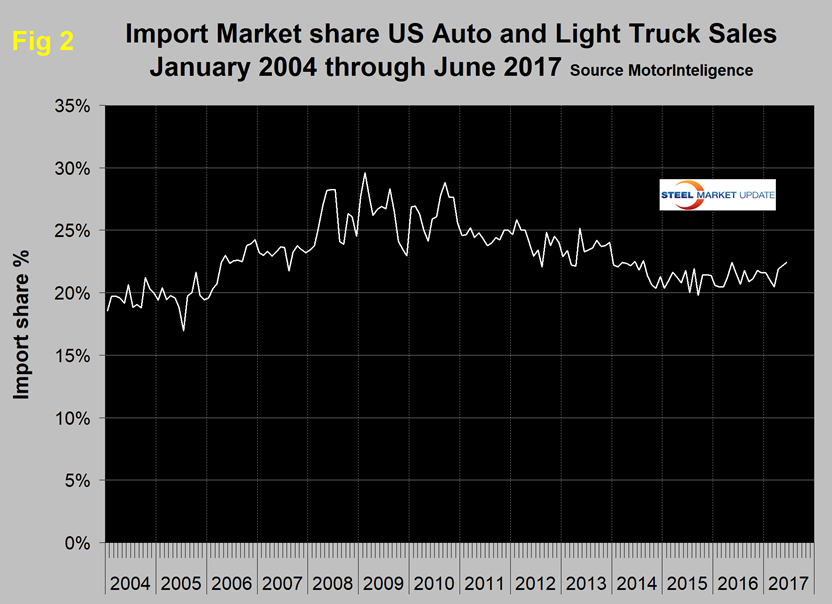
Import market share at 22.4 percent in June has changed little in the last 18 months as shown in Figure 2.
Economy.com had this to say: “After three consecutive months of sales below a 17-million unit seasonally-adjusted annualized rate, U.S. vehicle sales again fell below this threshold, coming in at 16.51 million units SAAR in June. This represents a 1.7 percent decline in the year-ago pace. Although crossover sales are strong, other vehicle segments, especially sedans, are somewhat lackluster and a drag on overall sales. Meanwhile, incentive spending jumped even higher in June as inventories increased.”
Total light vehicle (LV) production in NAFTA in June hit an annual rate of 18.519 million units, down from 18.890 million in May. On average since 2004, June’s production has been up by 3.0 percent from May. This year production was down by 2.0 percent, therefore weaker than normal (Figure 3).
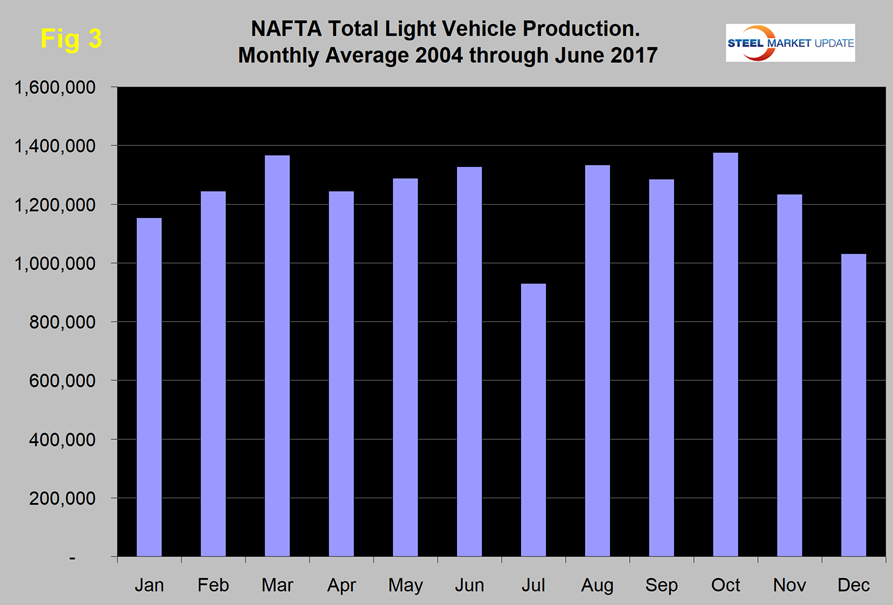
We can expect production to decline strongly in July when manufacturers take their maintenance and re-tooling shutdowns. Note: production numbers are not seasonally adjusted; the sales data reported above are seasonally adjusted.
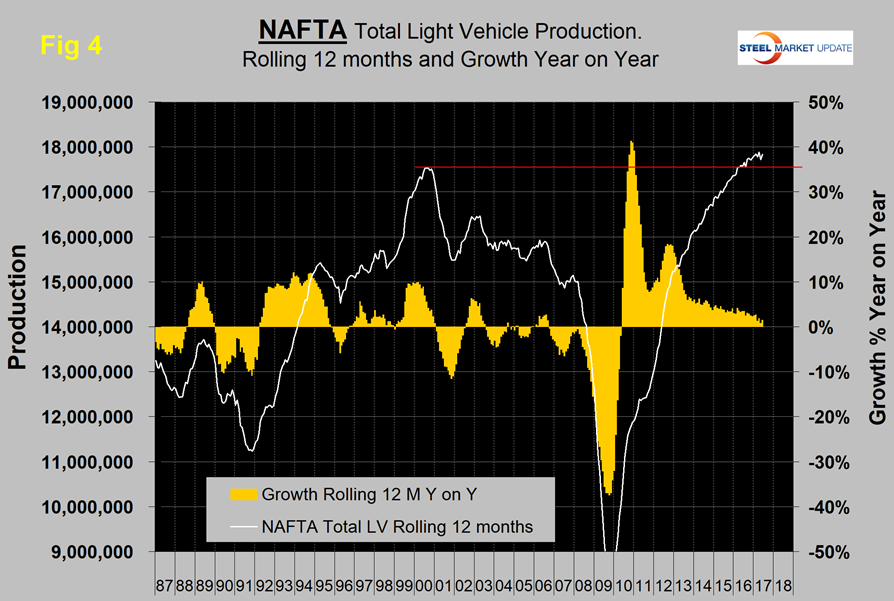
On a rolling 12 months basis y/y through June, LV production in NAFTA increased by 1.5 percent, which was up from the 0.8 percent achieved in 12 months through May. There has been a very gradual slowdown in growth for the last three years as indicated by the brown bars in Figure 4; however, production has been higher than the previous all-time high every month since early 2016.
We repeat here what we reported last month and will keep on saying: from the U.S. point of view, the news is not good. It now seems irrefutable that we are in the midst of a huge shift in assembly volume of both autos and light trucks from the U.S. to Mexico with Canada on the sideline. On a rolling 12 months basis y / y, total light vehicle production in the U.S. declined by 2.0 percent, Canada declined by 2.7 percent, but Mexico grew by 11.7 percent. The comparison is even starker for the U.S. comparing the latest three months y / y when the U.S. was down by 7.1 percent, Canada was down by 2.1 percent and Mexico was up by 11.6 percent (Table 1).
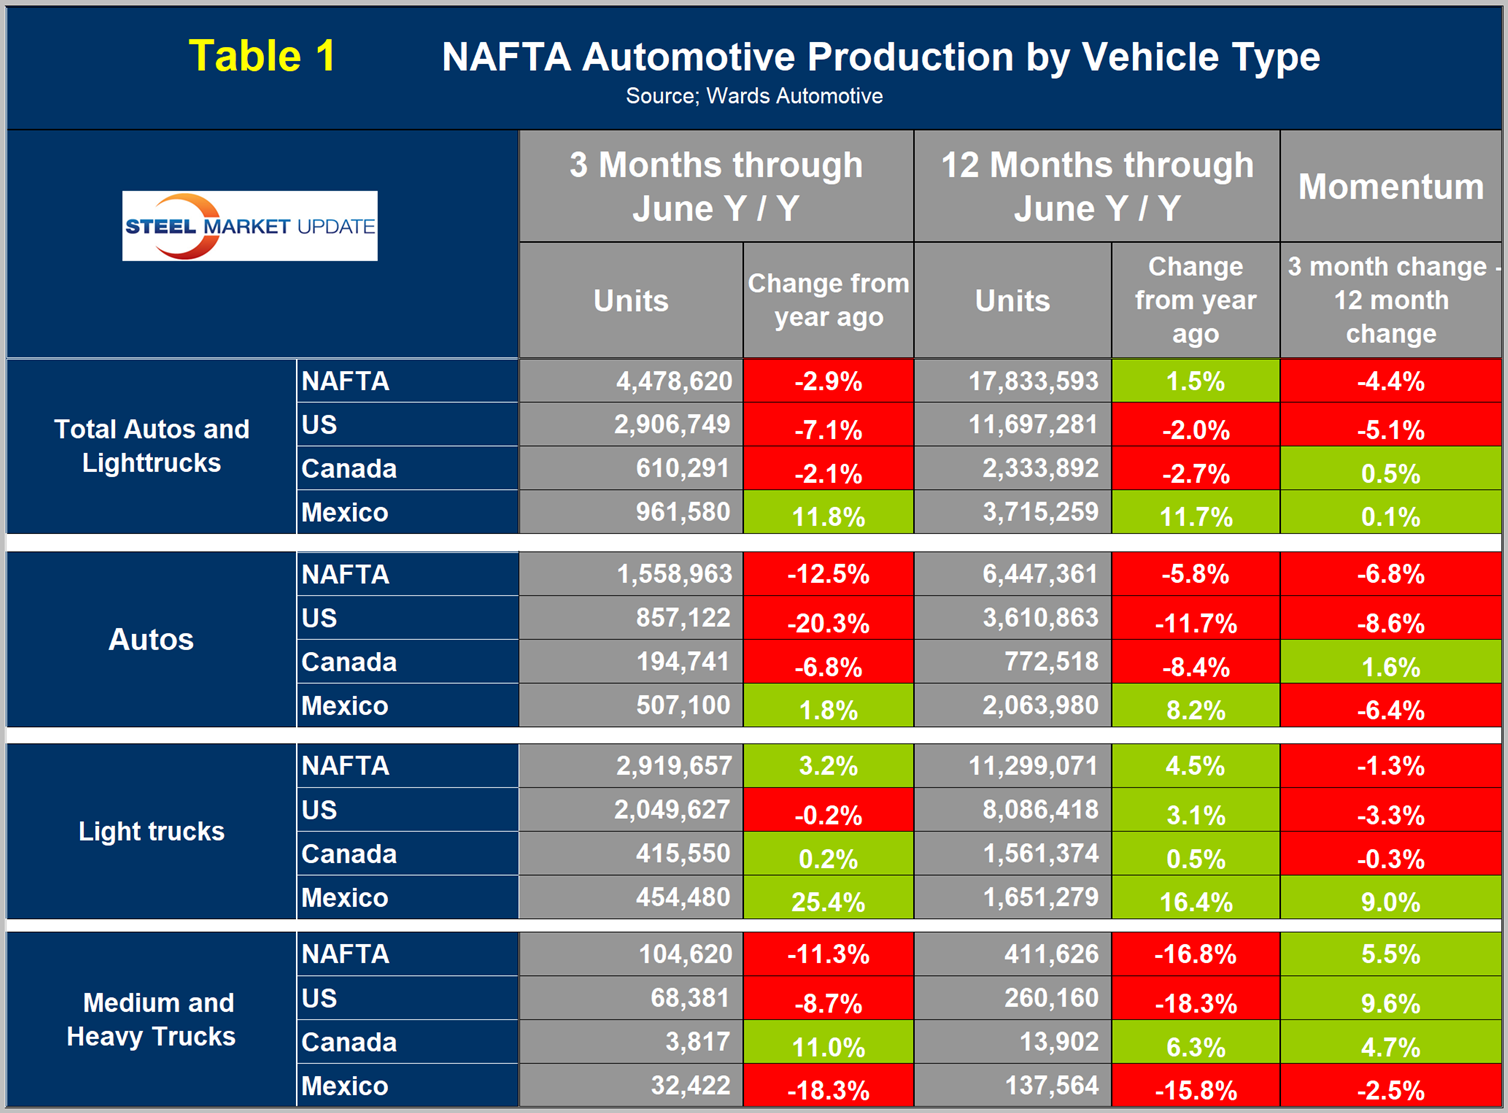
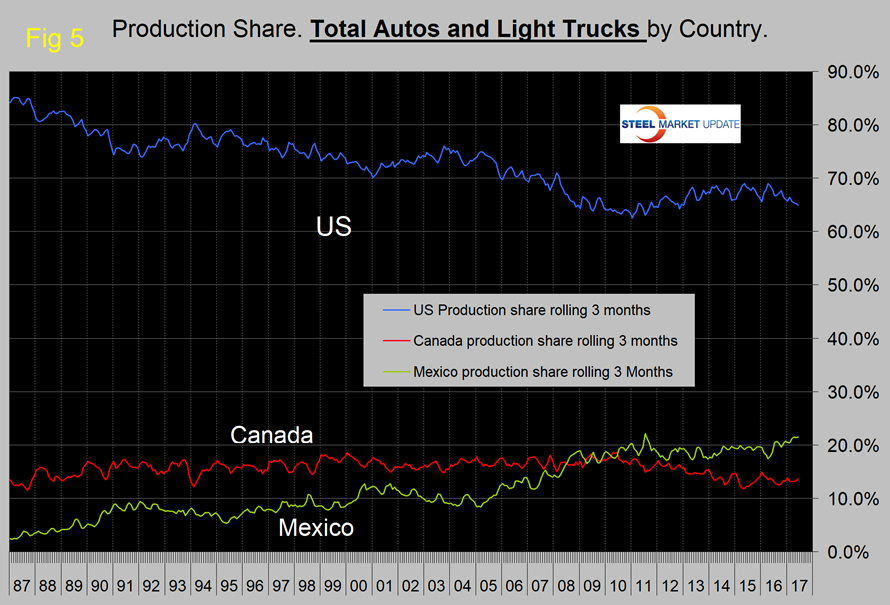
This means that the shift south of the border is accelerating and is being driven by both autos and light trucks. Autos in Mexico were up by 1.8 percent in three months y / y as Canada was down by 6.8 percent and the U.S. was down by 20.3 percent. In the case of light trucks, the U.S. was down by 0.2 percent, Canada was up by 0.2 percent and Mexico grew by a whopping 25.4 percent. U.S. production share had a recent peak of 69.0 percent in April last year and since then has fallen to 64.9 percent in June this year. Mexican production share has increased from 17.4 percent to 21.5 percent during the same period, while Canada has been relatively unchanged, increasing from 13.5 percent to 13.6 percent. Over the longer term, Mexico surpassed Canada’s share in 2010 and the gap has been widening ever since (Figure 5).
The Mexican production target for 2020 is 5.0 million units, according to Eduardo Solis, president of the Mexican Automotive Industry Association. This would be up from an average of 3.553 million in the 18 months since January 2016. The Associated Press reported in June that Ford will move production of the Focus from the U.S. to China starting in 2019, then import it back into the U.S. This is a change from the original plan that was to move production to Mexico. Ford said its decision won’t cost any American jobs because the plant in Michigan will be re-tooled to produce pickups and SUVs.
Figures 6, 7 and 8 show total LV production by country with y/y growth rates as the brown bars. The red line on each shows the change in production since Q2 2006. Note the scales are the same to give true comparability and that Mexican growth has surged in 2017.
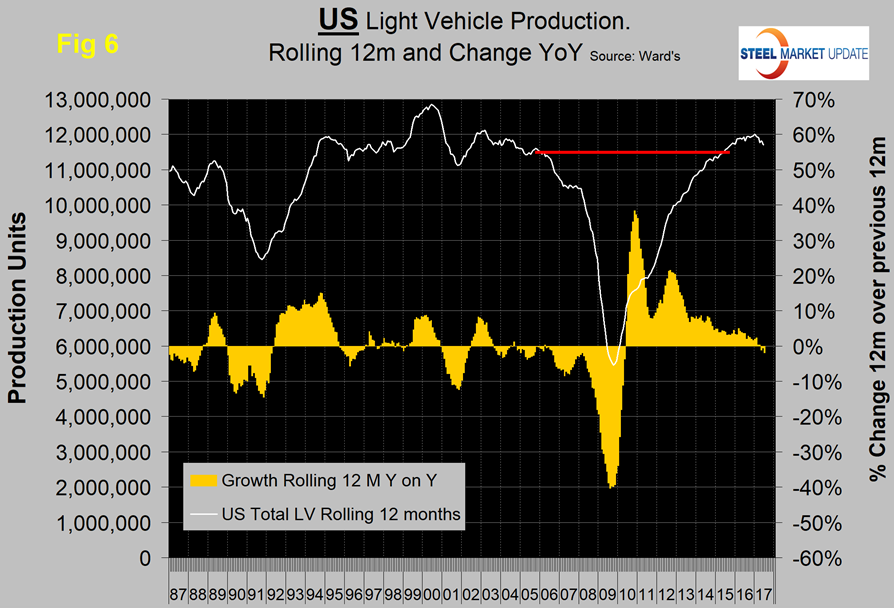
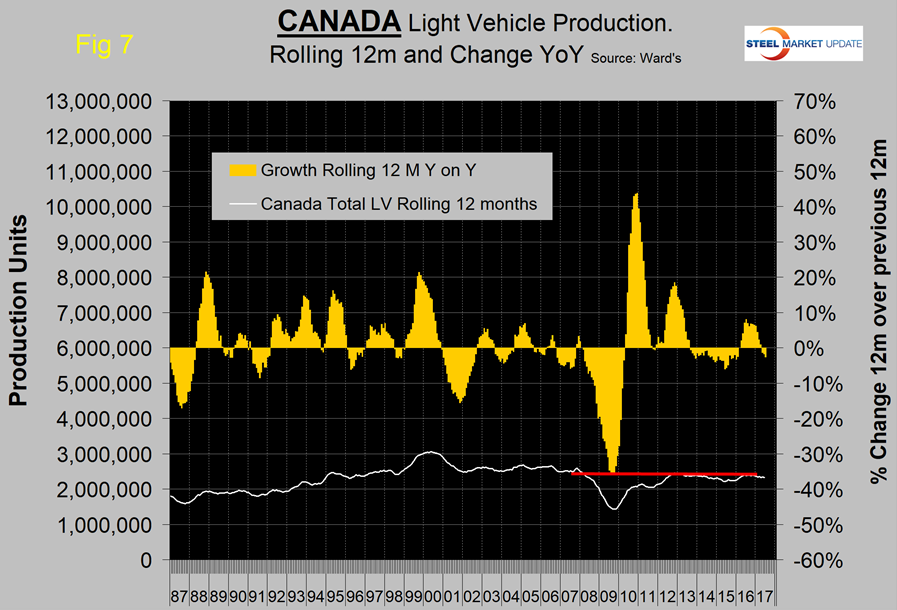
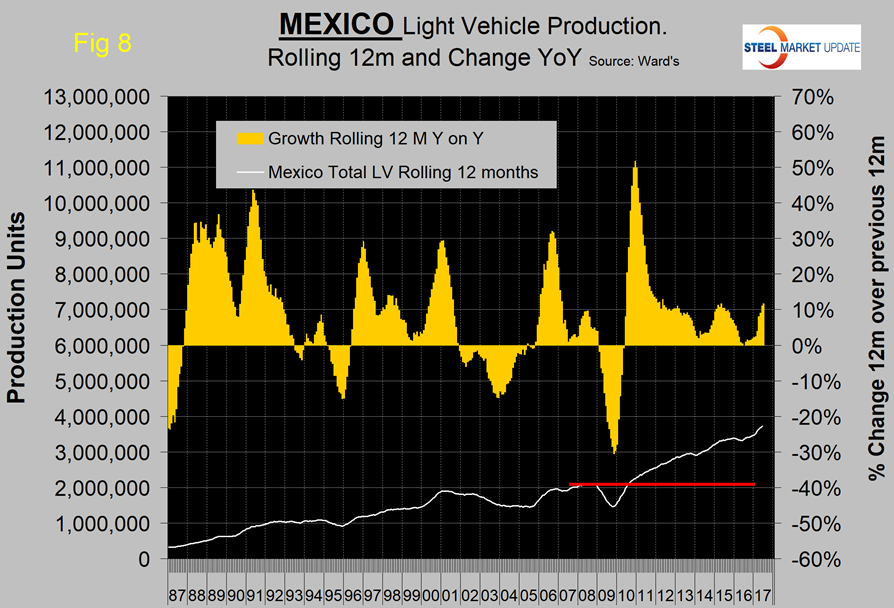
Figure 9 shows that the percentage of autos in the light vehicle mix has been declining for all three countries since 2012, driven by consumer buying preferences, which in turn are heavily influenced by gas prices.
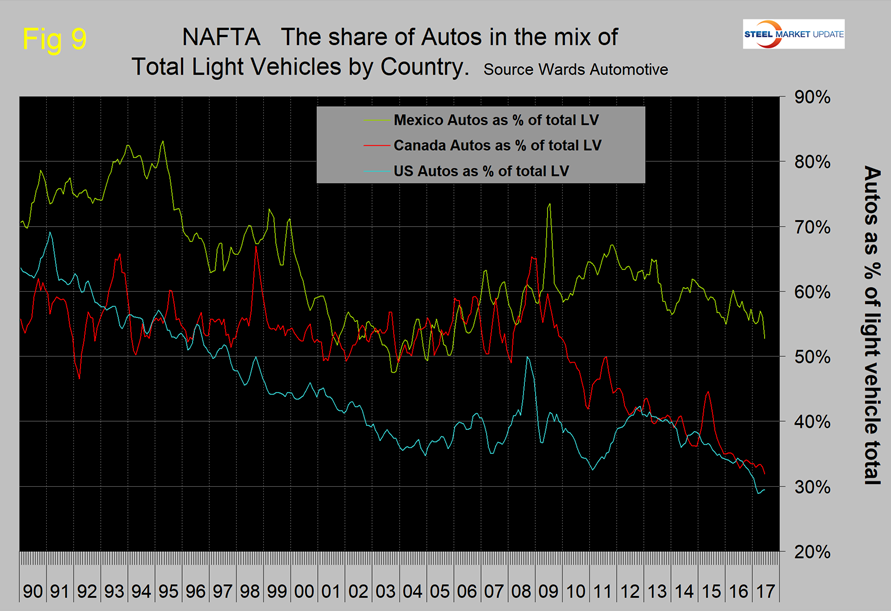
SUVs and crossovers are classified as light trucks, which is the main driver of the shift in mix. The change in preference for light trucks tends to favor the U.S. and Canada over Mexico because the mix of light vehicle production capacity is different by country. The percentage of autos in the Mexican mix in the last three months was 52.7 percent, but only 29.5 percent in the U.S. and 31.9 percent in Canada. February through June was the first time for the auto percentage in the U.S. mix to fall below 30 since our data stream began in January 1990. Mexico has staked out a higher relative assembly capacity in autos, which suggests that the data could turn really ugly from the U.S. point of view when gas prices eventually rebound.
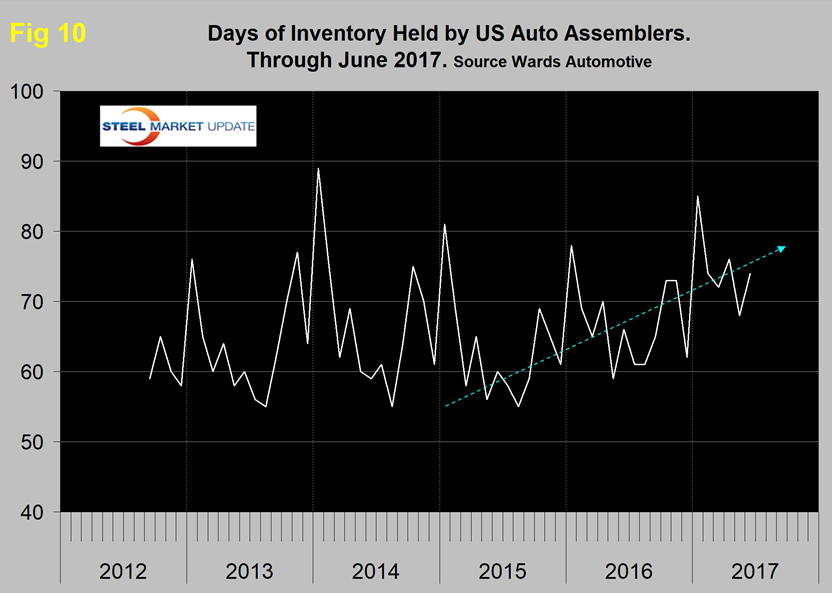
Ward’s Automotive reported this week that total light vehicle inventories in the U.S. were 74 days at the end of June, which was up from 68 days at the end of May. Month over month, FCA’s (Fiat Chrysler Automotive) inventory rose from 66 to 71 days, GM was up 4 to 105 days and Ford was up 8 to 71 days. Figure 10 shows that inventory days of sales in the U.S. has exhibited an increasing trend since Q2 2015.
The SMU data file contains more detail than can be shown here in this condensed report. Readers can obtain copies of additional time-based performance results on request if they wish to dig deeper. Available are graphs of auto, light truck, medium and heavy truck production. Also, growth rates and production share by country.