

Analysis

September 20, 2017
Auto’s Shift South is Accelerating
Written by Peter Wright
The Mexican share of light truck assemblies in NAFTA is expanding rapidly at the expense of the United States.
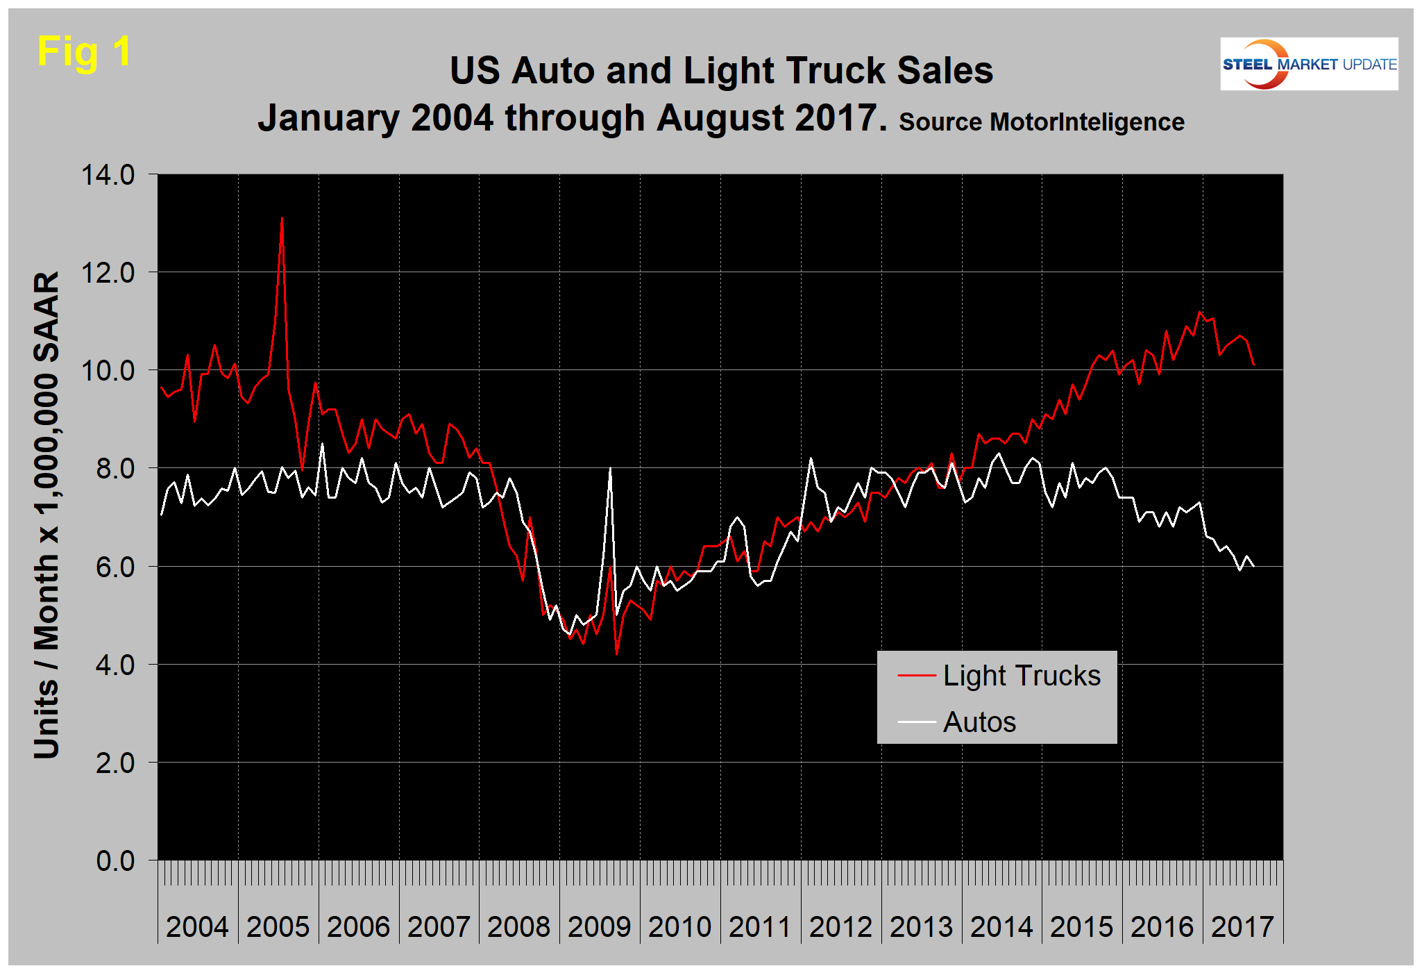
Economy.com reported that U.S. new-vehicle sales dropped nearly 6.3 percent in August, reaching their lowest level at a seasonally-adjusted annualized rate since February 2014. August marks the eighth consecutive month in which sales were lower on a year-ago basis. Both light-truck and car sales fell.
Vehicle sales had been expected to log a year-over-year increase in August for the first time this year until Hurricane Harvey walloped metro Houston late in the month. Edmunds estimates that Harvey wiped out 2 percent of the month’s new-vehicle sales, but the damage to the existing stock of vehicles in Houston was likely much greater. Cox Automotive suggests that 300,000 to 500,000 vehicles were lost or damaged in the Houston area alone, where the vehicle ownership rate is one of the highest in the country at 94 percent. This could amount to nearly $5 billion in value lost, making Harvey the costliest storm ever in terms of vehicle damage.
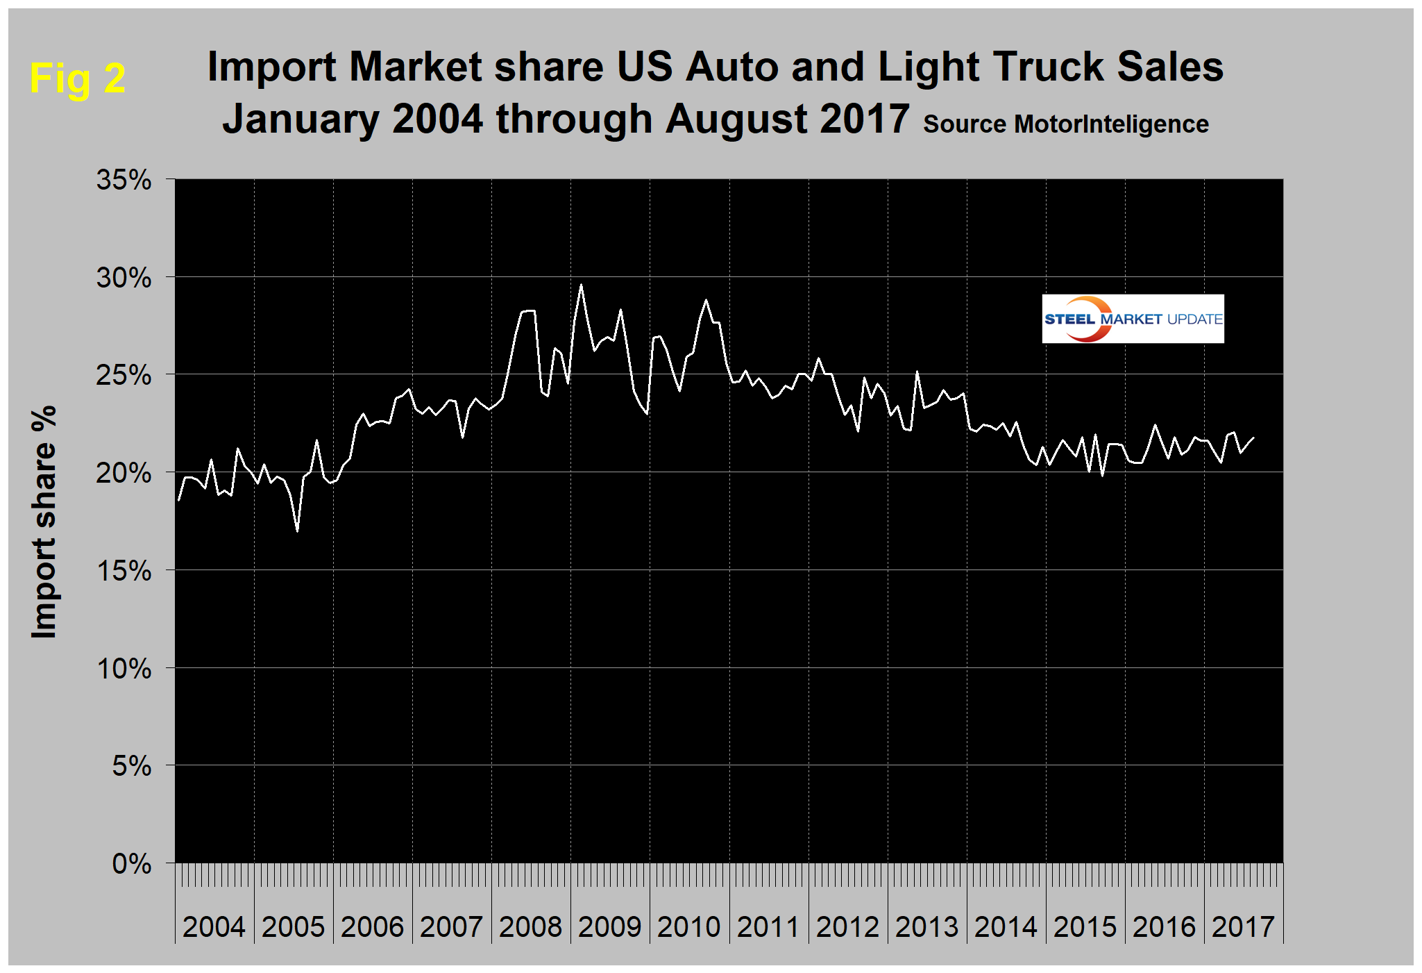
Figure 1 shows auto and light truck sales since January 2004. Import market share at 21.4 percent in August has changed little in the last 18 months as shown in Figure 2.
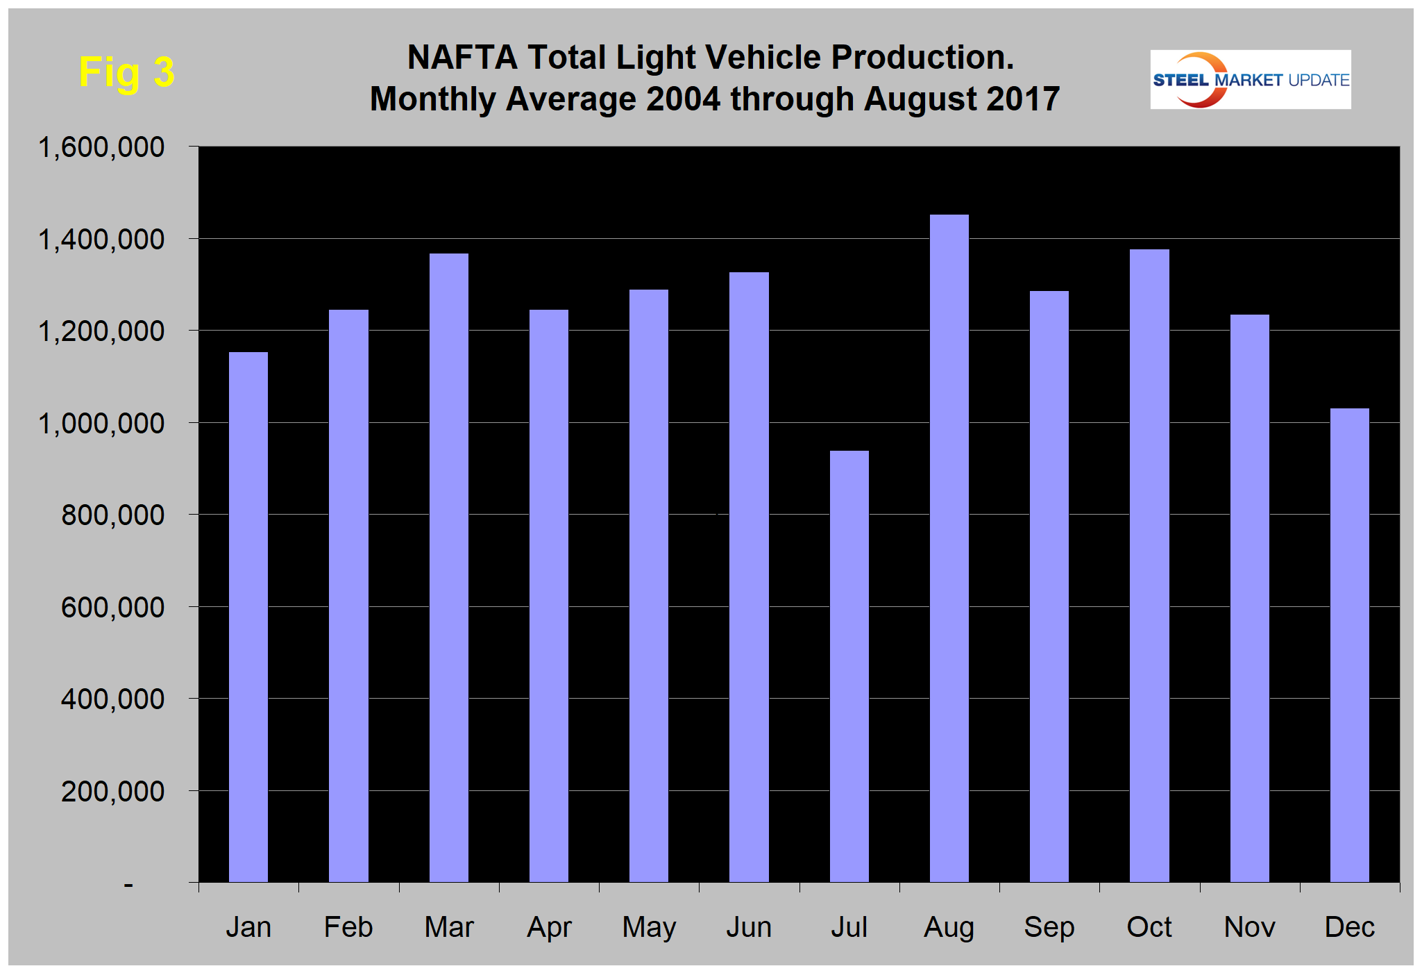
NAFTA Vehicle Assemblies: Total light vehicle production in NAFTA in August hit an annual rate of 18.407 million units, up from 12.694 million in July, which was when the re-tooling outages occurred. On average since 2004, August’s production has been up by 54.6 percent from July. This year production was up by 45 percent, therefore weaker than normal (Figure 3). This was the fourth straight month in which production was lower than expected from historical projections. Year to date through August, production was down by 13.9 percent from the same period in 2016.
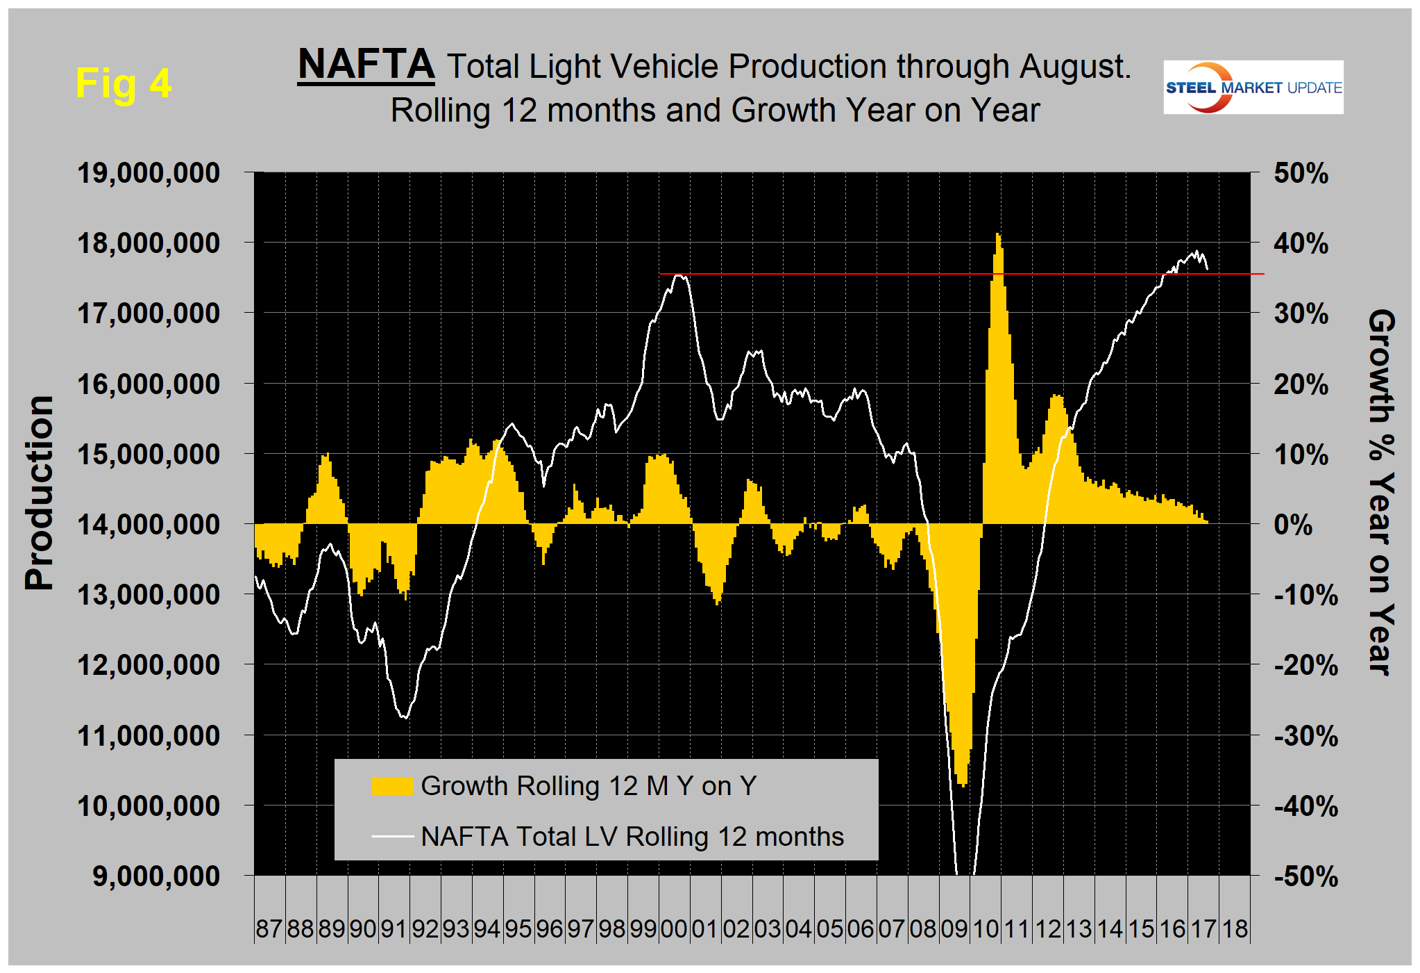
Note, these production numbers are not seasonally adjusted; the sales data reported above are seasonally adjusted. Another consideration to note is that auto assemblies in NAFTA are a complex mix of parts and subassemblies moving both ways between nations and particularly across the southern border. We are reporting on the point of final assembly and have no data to assess how the trade in parts affects the total value mix between nations.
On a rolling 12-months basis year over year through August, light vehicle production in NAFTA increased by 0.4 percent, which was almost the same as the 0.5 percent in 12 months through July. There has been a very gradual slowdown in growth for the last three years as indicated by the brown bars in Figure 4. Production has been higher than the previous all-time high every month since early 2016, but it looks as though that is about to change.
Like a broken record, we repeat here what we have been reporting for a while—from the U.S. point of view the news is not good. It now seems irrefutable that we are in the midst of a huge shift in assembly volume of both autos and light trucks from the U.S. to Mexico with Canada on the sideline. On a rolling 12-months basis year over year, total light vehicle production in the U.S. declined by 4.4 percent. Canada also declined by 4.4 percent, but Mexico increased by 10.3 percent. The comparison is worse for the U.S. comparing the latest three months year over year when the results show the U.S. down by 13.0 percent, Canada down by 8.1 percent and Mexico up by 7.0 percent (Table 1).
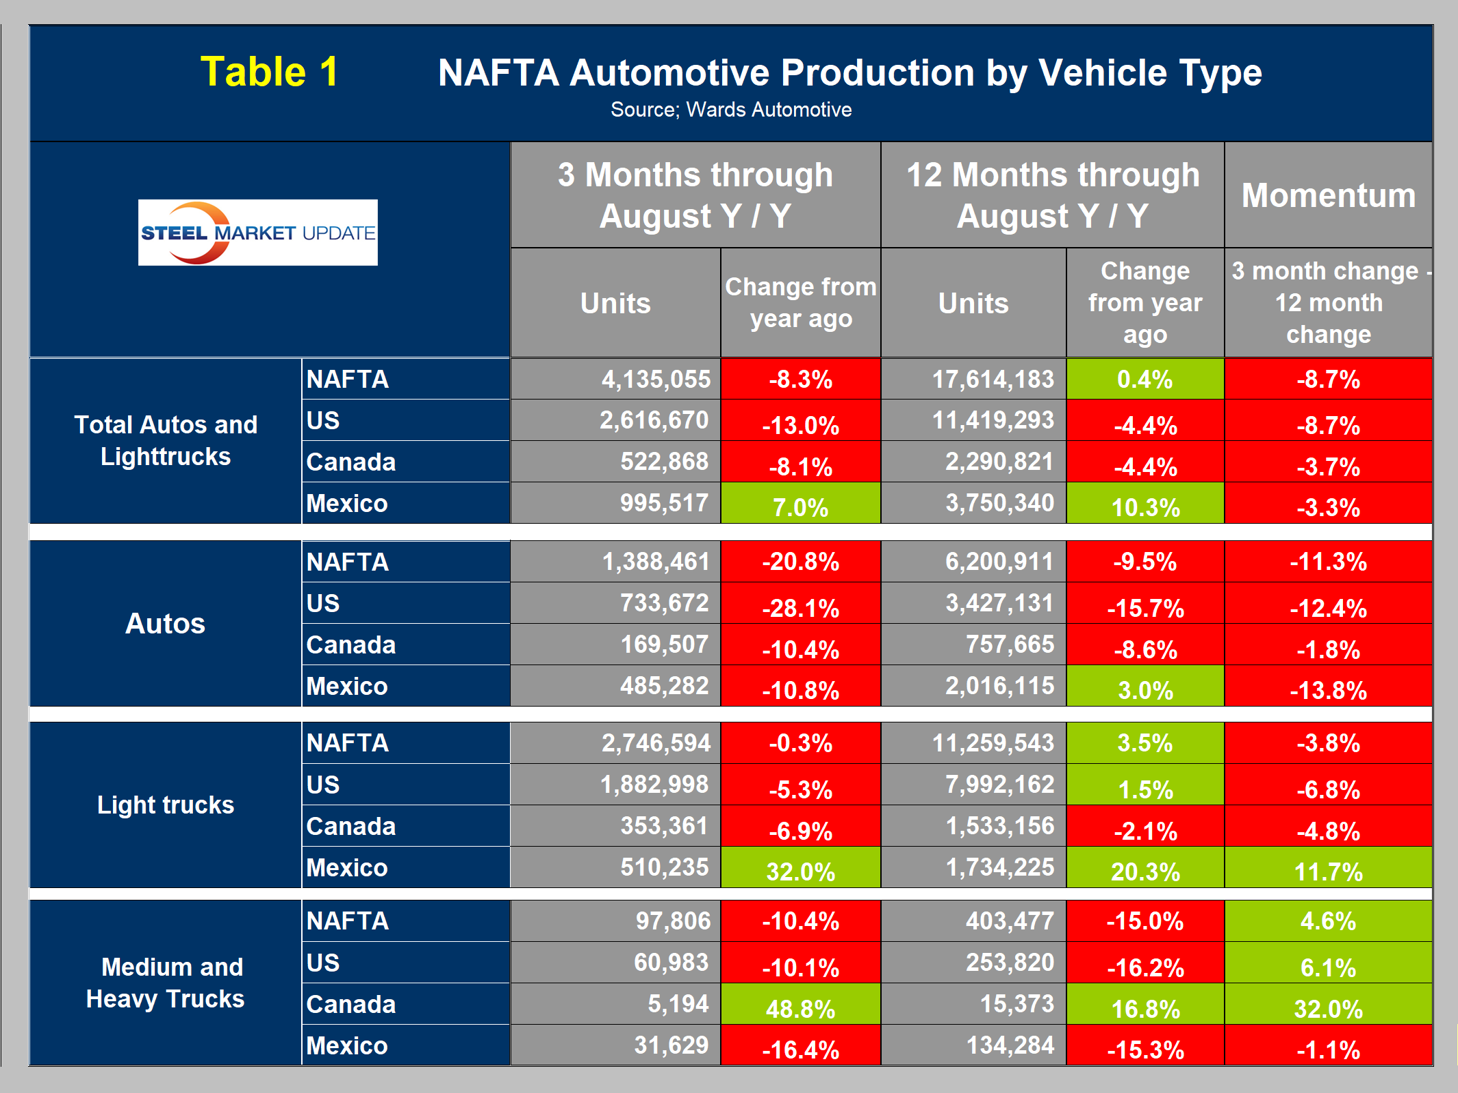
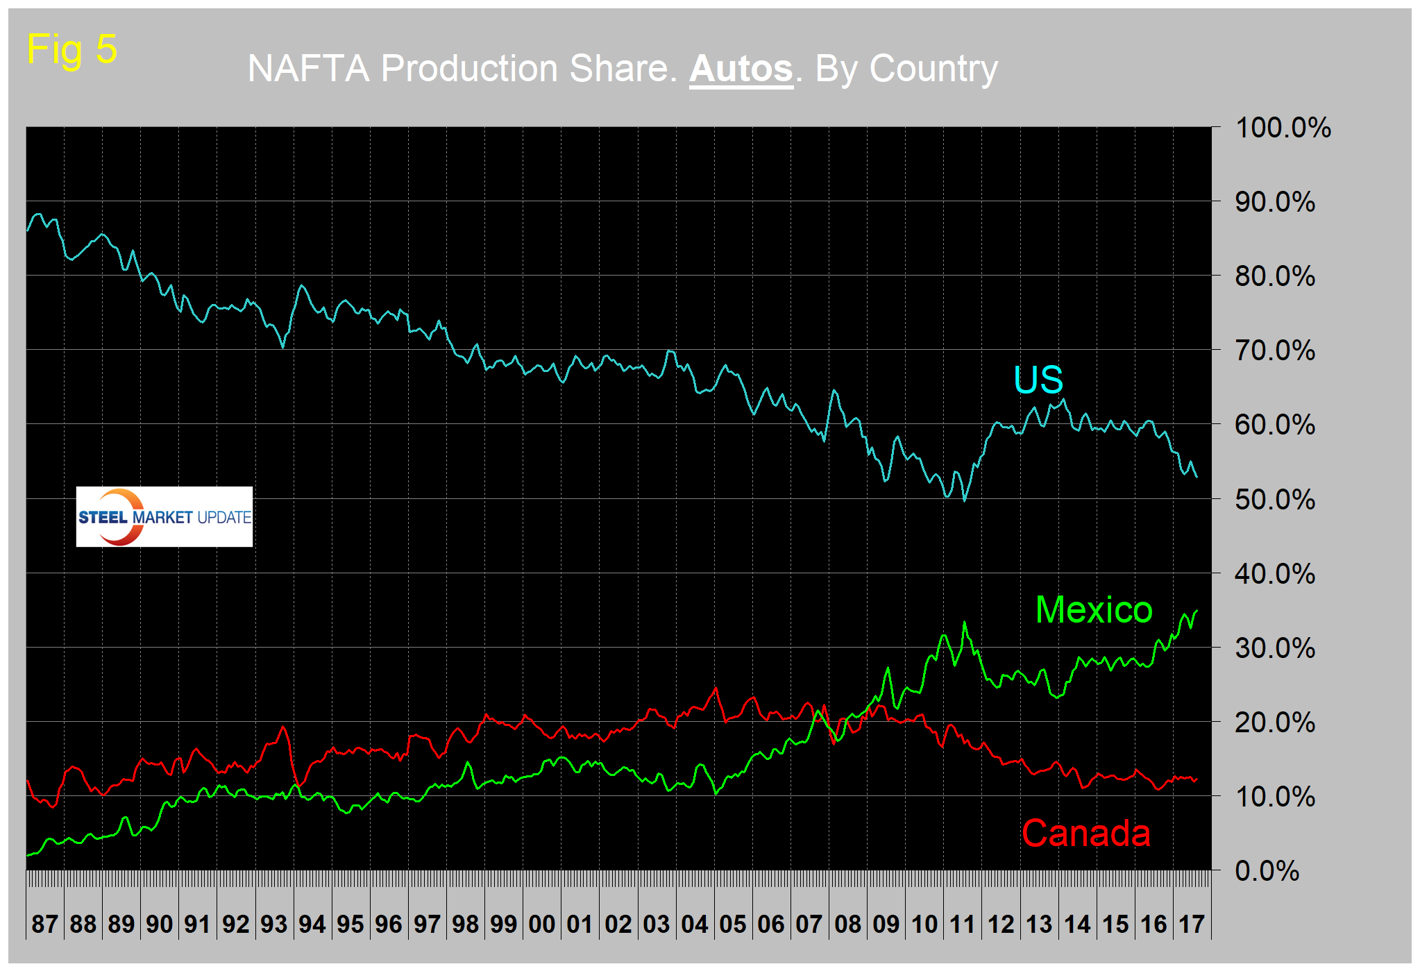
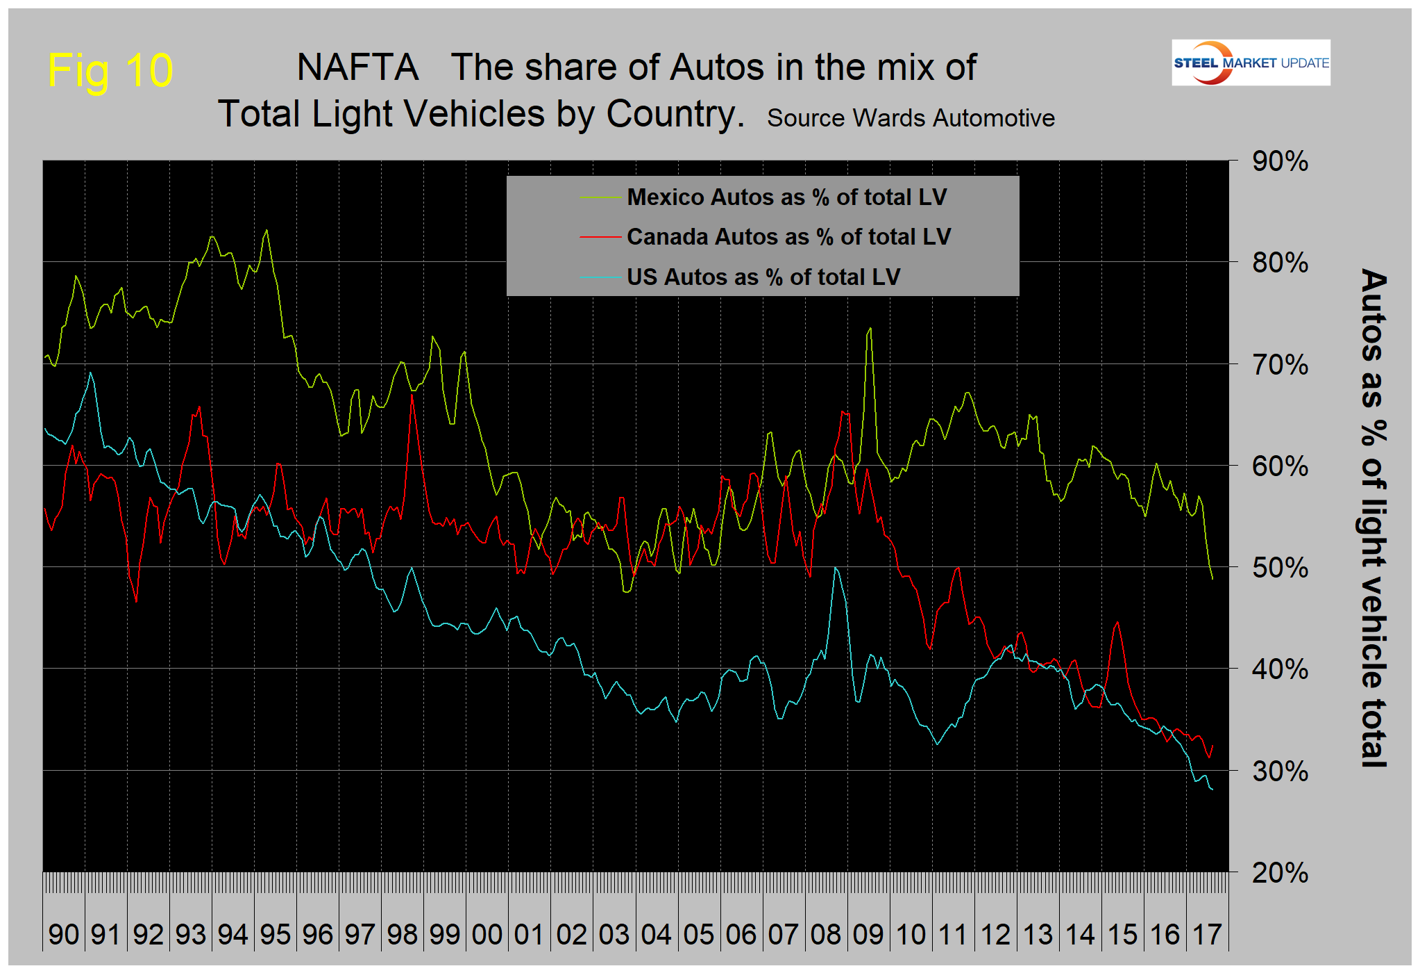
This means the shift south of the border is accelerating. This shift is most pronounced for autos as shown in Figure 5. The U.S. now has a market share of autos of 52.8 percent, Mexico has 35.0 percent and Canada has 12.2 percent.
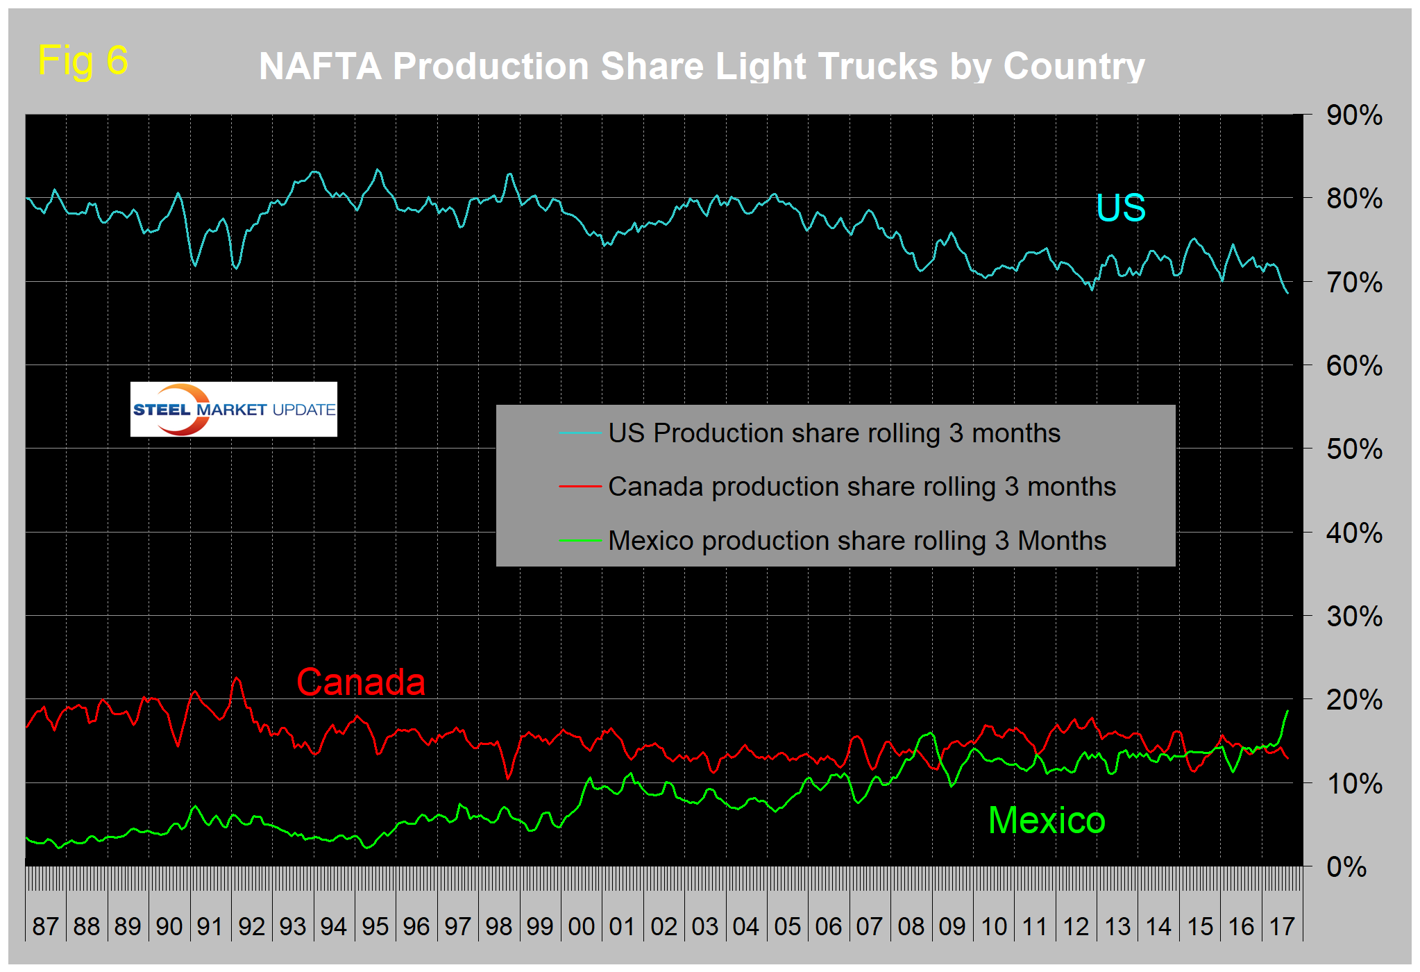
Up until this year, the U.S. market share of light trucks hadn’t changed much since mid-2009, but in 2017 there has been a sharp increase in Mexico’s share at the expense of the U.S. with Canada little changed (Figure 6). The U.S. share of light trucks is now 68.6 percent, Mexico’s is 18.6 percent and Canada’s is 12.9 percent. These are the highest ever shares for Mexico of both autos and light trucks.
In three months through August year over year, Mexico’s production of light trucks grew by 32.0 percent. The U.S. contracted by 5.3 percent and Canada contracted by 6.9 percent. The Mexican light vehicle production target for 2020 is 5.0 million units, according to Eduardo Solis, president of the Mexican Automotive Industry Association. In the 12 months through August, Mexico’s light vehicle production was 3.750 million units, up from 3.399 million in 12 months through August 2016. This means that Mexico is almost exactly tracking with Sr. Solis’ target.
Figures 7, 8 and 9 show total light vehicle production by country. The brown bars are the respective growth rates and they tell the whole story. The red line on each chart shows the change in production since Q2 2006. Note the scales are the same to give true comparability and that Mexican growth has surged in 2017.
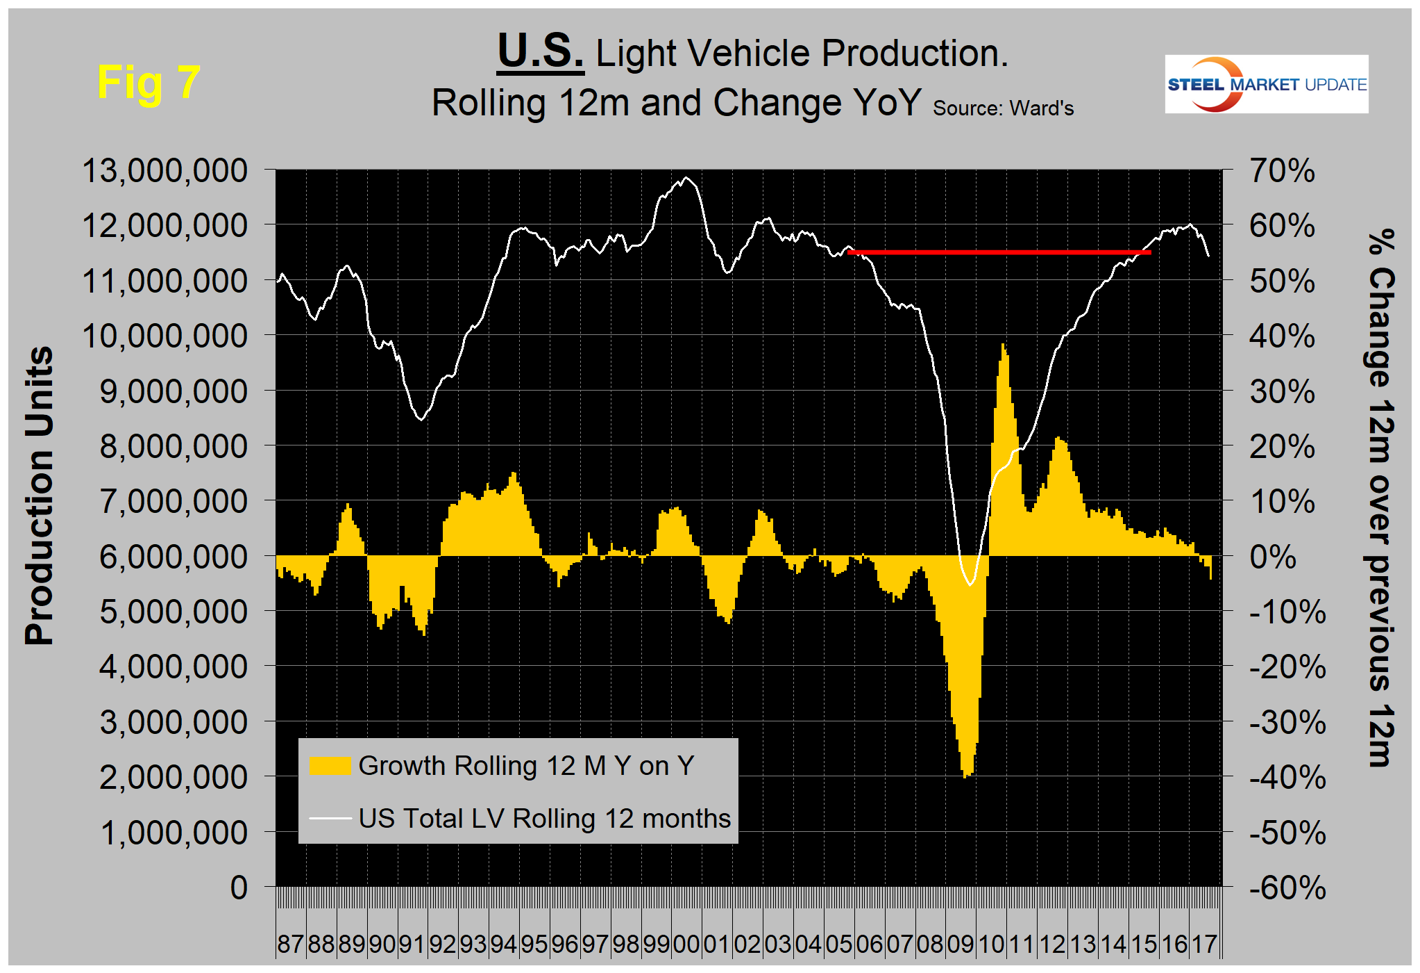
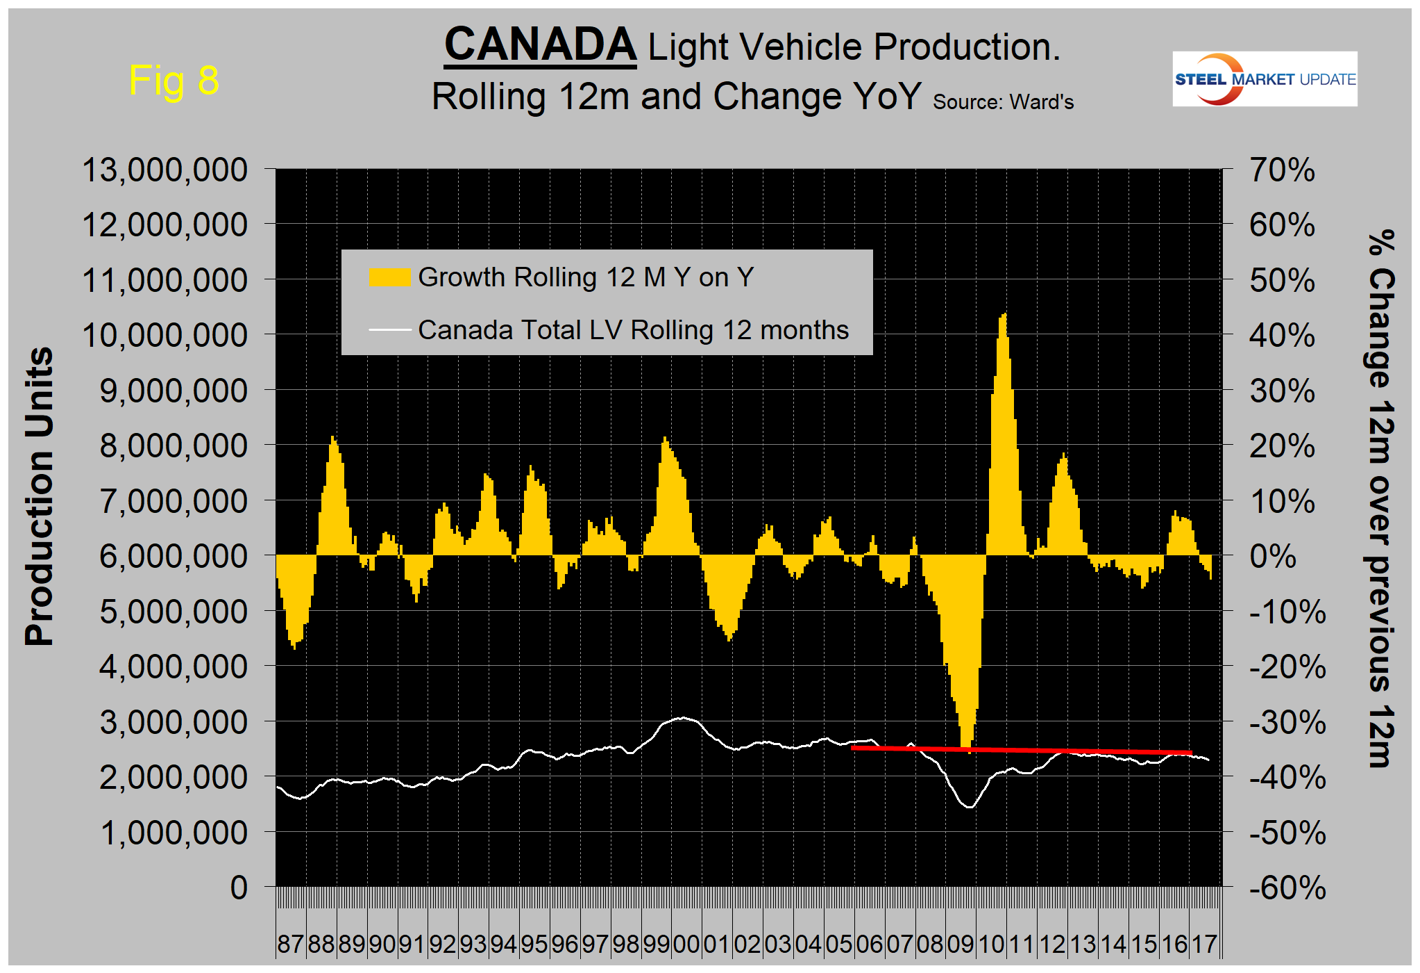
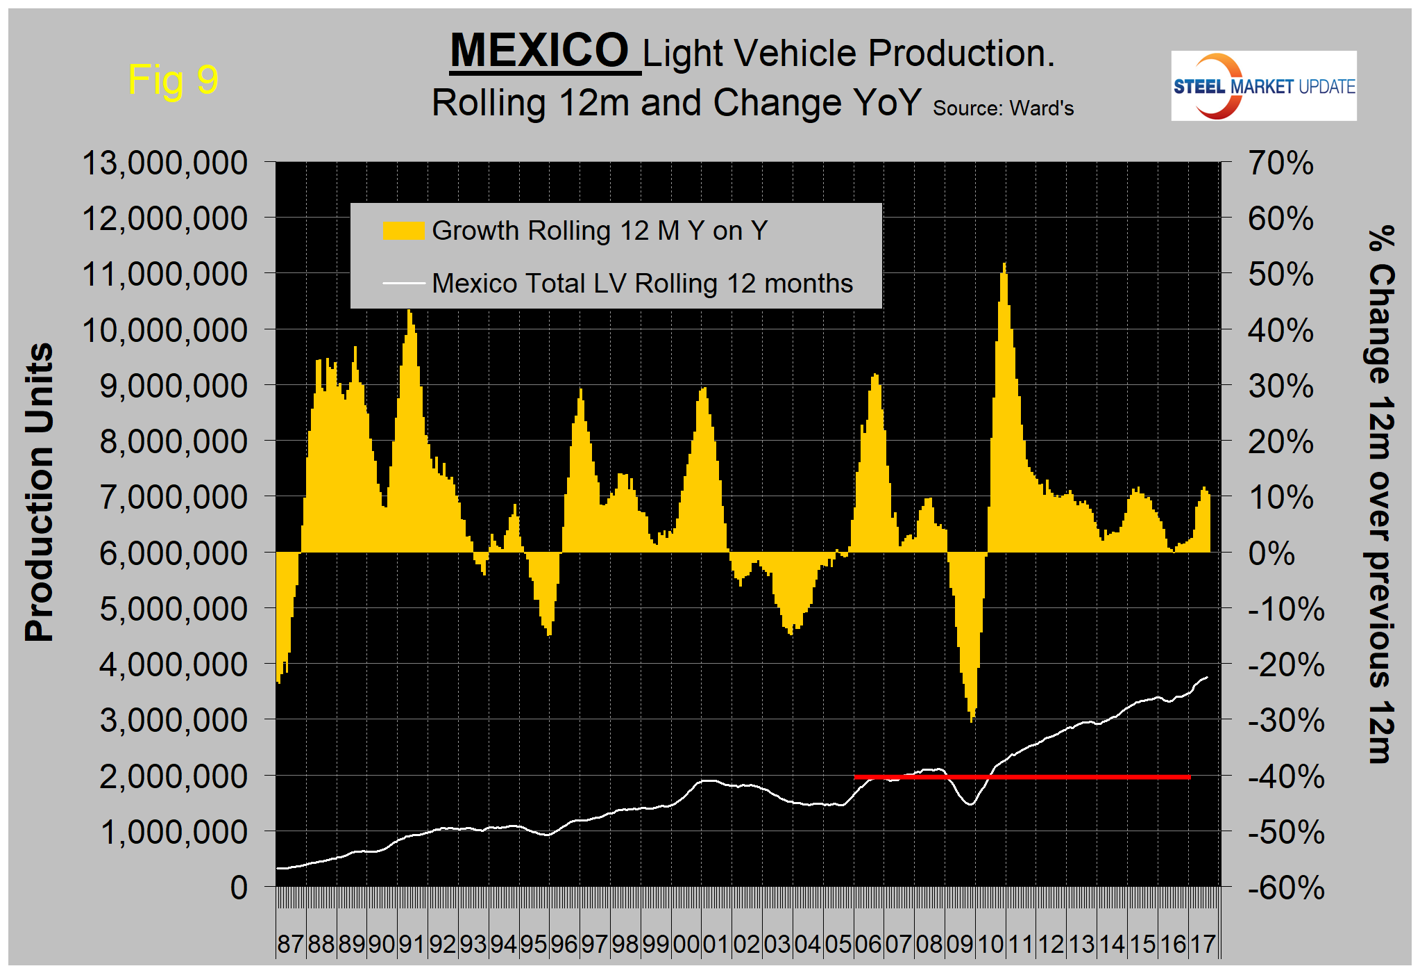
Figure 10 shows that the percentage of autos in the light vehicle mix has been declining for all three countries since 2012. In general, car sales—including four-door sedans, two-door coupes, station wagons and hatchbacks—continue to substantially underperform their SUV, crossover and pickup truck counterparts. Light trucks in the U.S. comprised about 63 percent of total sales in August, which is the highest proportion ever for the month. For example, Toyota sold 26 percent more of its RAV4 crossover model than last year. The RAV4 has displaced the Camry as Toyota’s best-selling vehicle year to date. The change in preference for light trucks has tended to favor the U.S. and Canada over Mexico since the recession because the mix of light vehicle production capacity is different by country. This is changing rapidly as Mexico had 32.0 percent growth in light trucks and a 10.8 percent contraction in autos in the three months through August year over year. In other words, “Mexico is heading to where the puck is going!” This is the lowest proportion of autos in the Mexican mix since early 2003. February through August was the first time for the auto percentage in the U.S. mix to fall below 30 percent since our data stream began in January 1990.
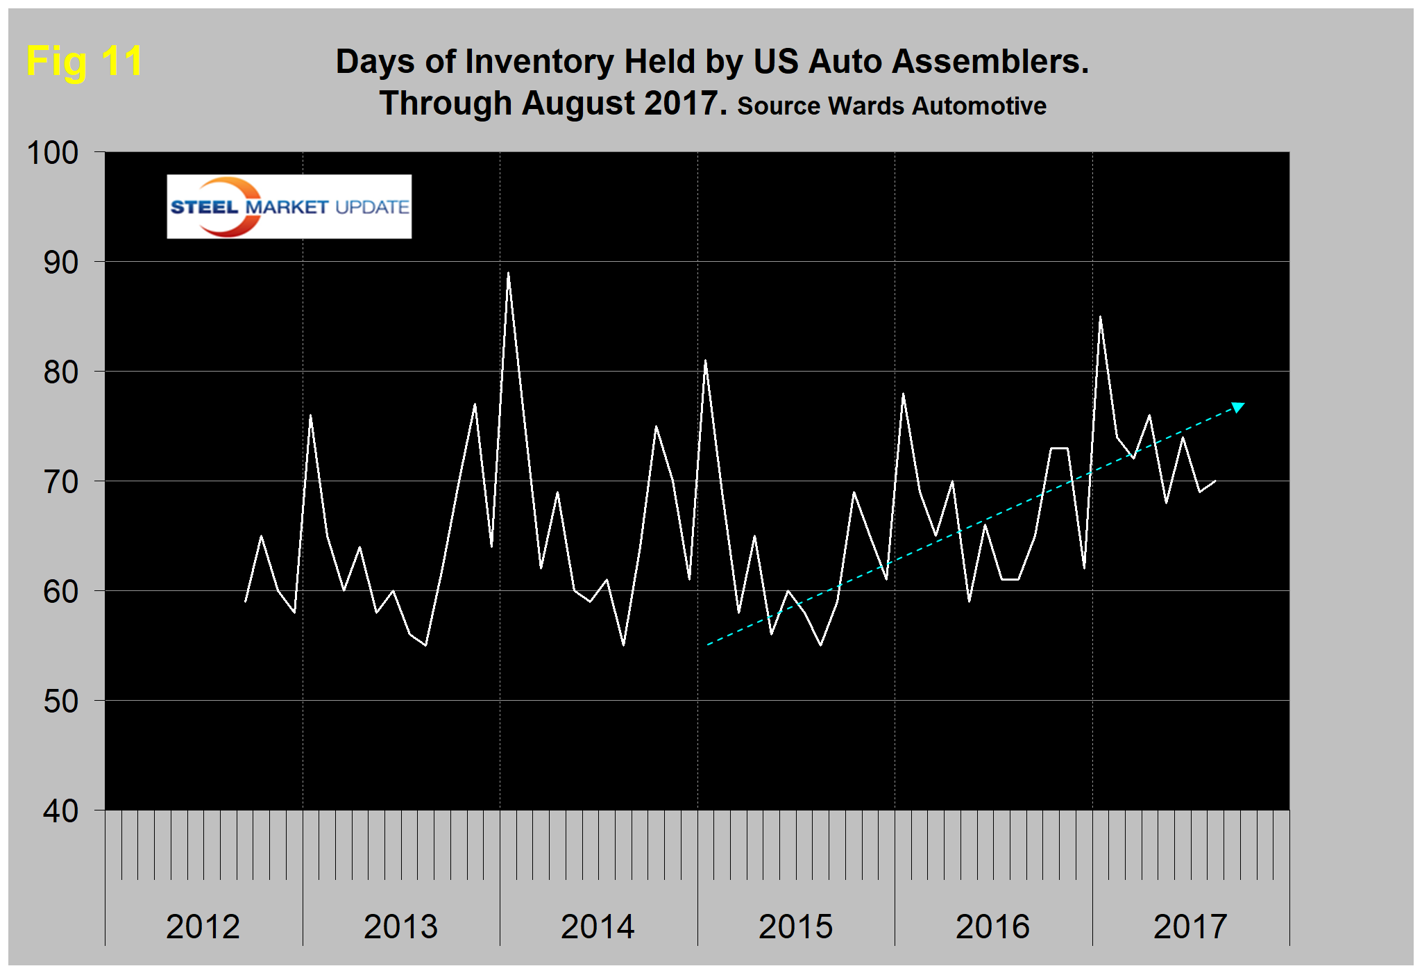
Ward’s Automotive reported this week that total light vehicle inventories in the U.S. were 70 days at the end of August, up from 69 days at the end of July. Month over month, FCA’s (Fiat Chrysler Automotive) inventory rose from 74 to 77 days, GM was down from 104 to 87 days and Ford was up 3 to 77 days. To put those results into perspective, Toyota was unchanged at 50 days. Figure 11 shows that inventory days of sales in the U.S. has exhibited an increasing trend since Q2 2015.
The SMU data file contains more detail than can be shown in this condensed report. Readers can obtain copies of additional time-based performance results on request if they wish to dig deeper. Available are graphs of auto, light truck, medium- and heavy-truck production. Also, growth rates and production share by country.


