Analysis

November 19, 2017
Auto Production: Light-Truck Sales Pick Up
Written by Peter Wright
Mexico continues to take a larger share of light vehicle assemblies from the U.S. and Canada, according to Steel Market Update’s analysis of October industry data.
U.S. Vehicle Sales
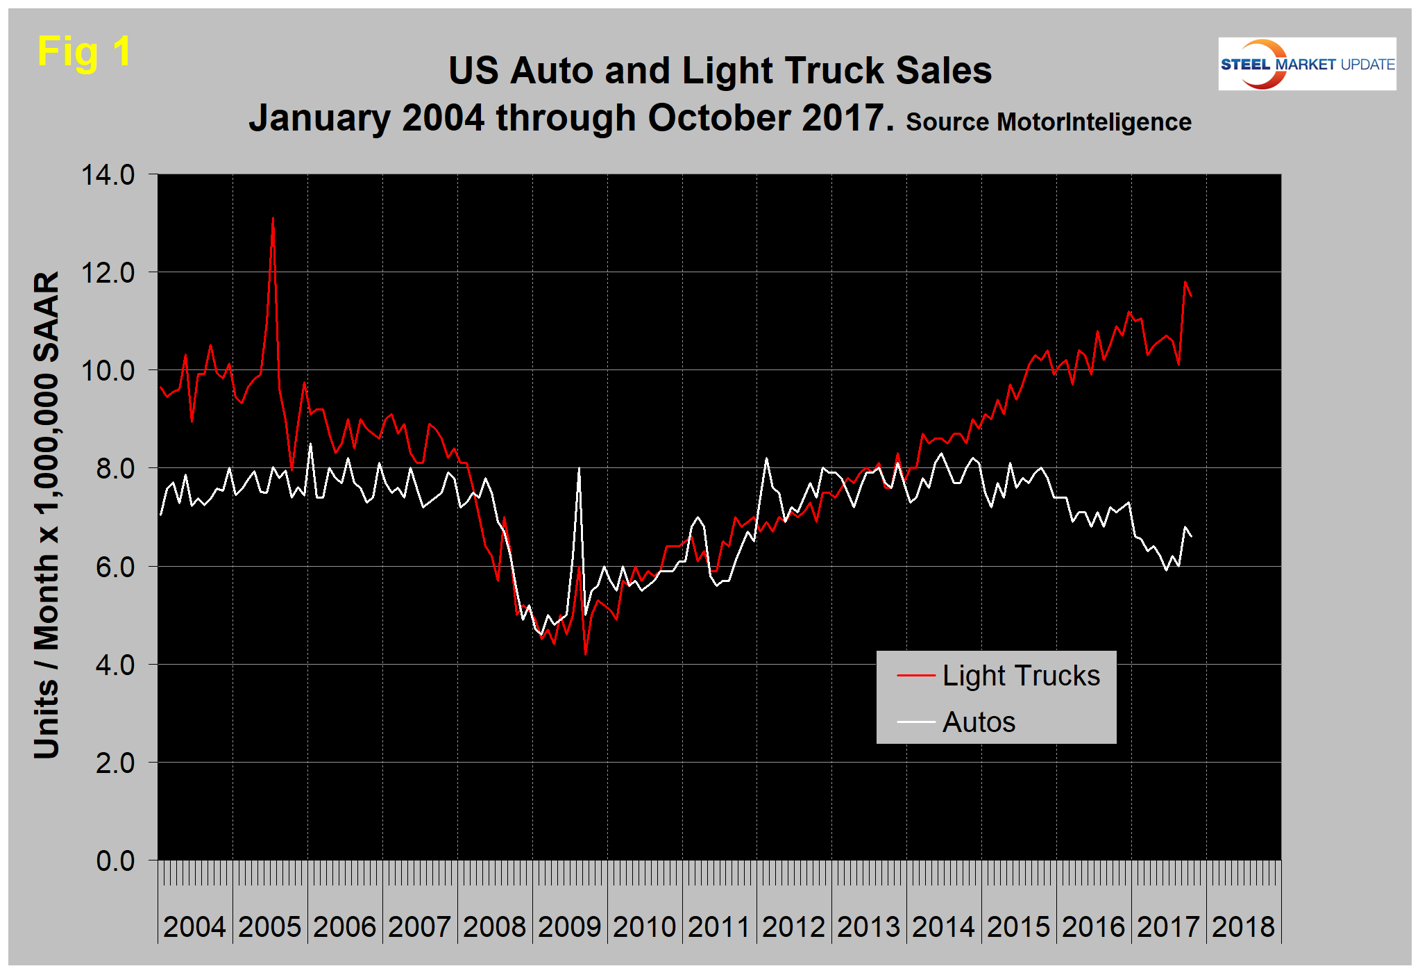
In September, sales of autos and light trucks surged to an annual rate of 18.6 million units. October fell back to 18.1 million units. Economy.com had this to say: “At a seasonally adjusted annualized rate of 18.1 million units, October new-vehicle sales retreated only 2.6 percent from the 12-year high set in September and were still 1.2 percent higher than sales in October 2016. This marks only the second time this year that sales were higher than a year earlier. Replacement vehicles and postponed purchases in the wake of Hurricane Irma helped propel sales, but vehicle damage costs were not as high as from Hurricane Harvey. Light-truck sales captured a larger share of the market than the recent historical norm. Incentive spending stayed inflated to help automakers clear existing inventories.”
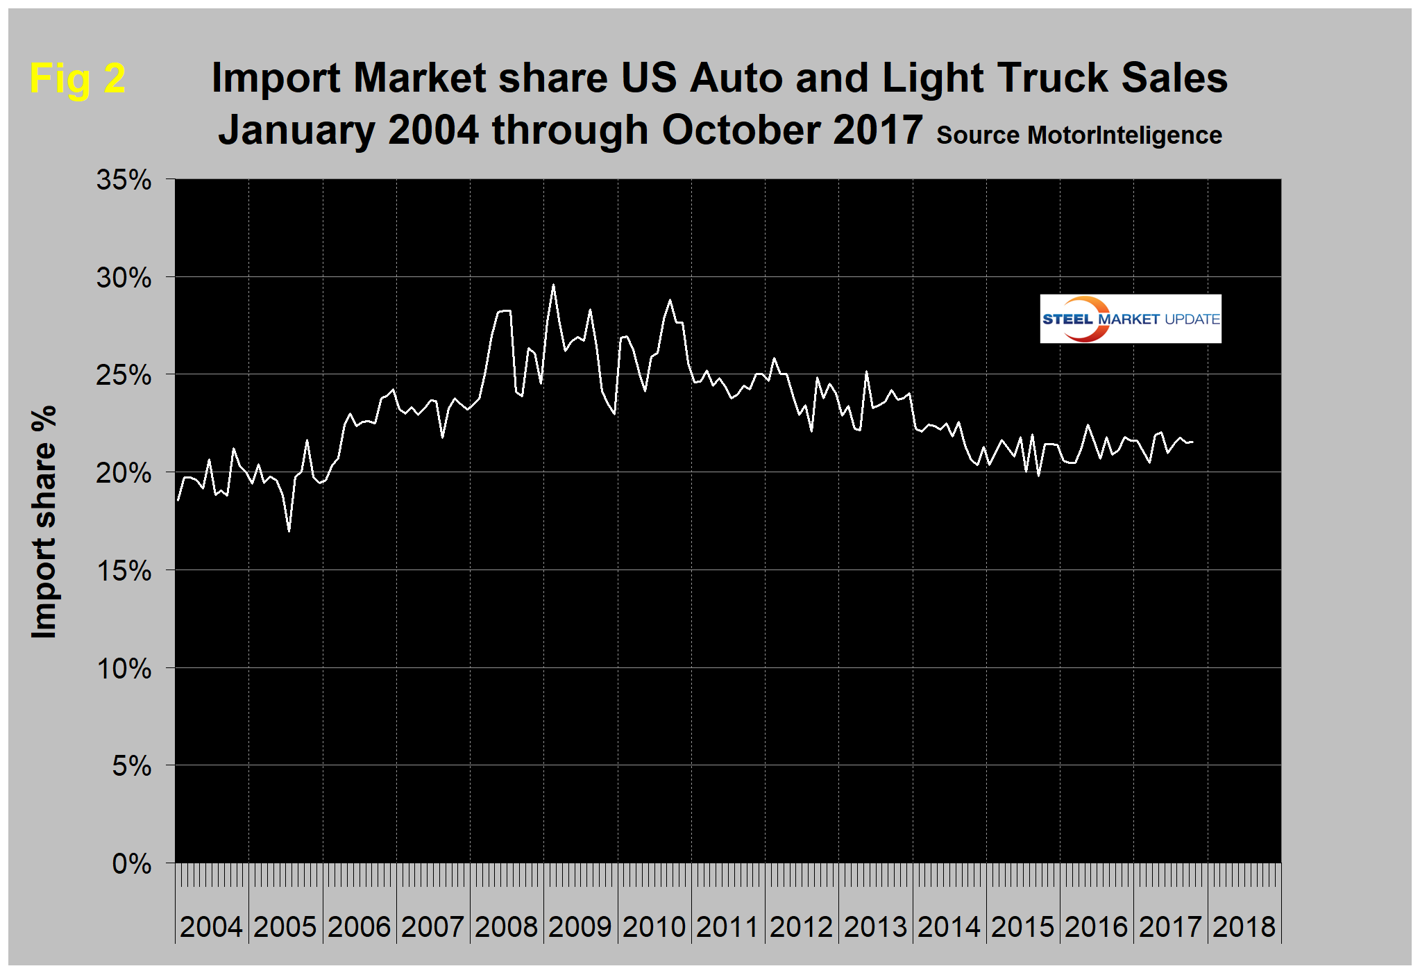
Figure 1 shows auto and light truck sales since January 2004. Import market share at 21.5 percent in October was unchanged from September and has changed little in the last 18 months as shown in Figure 2.
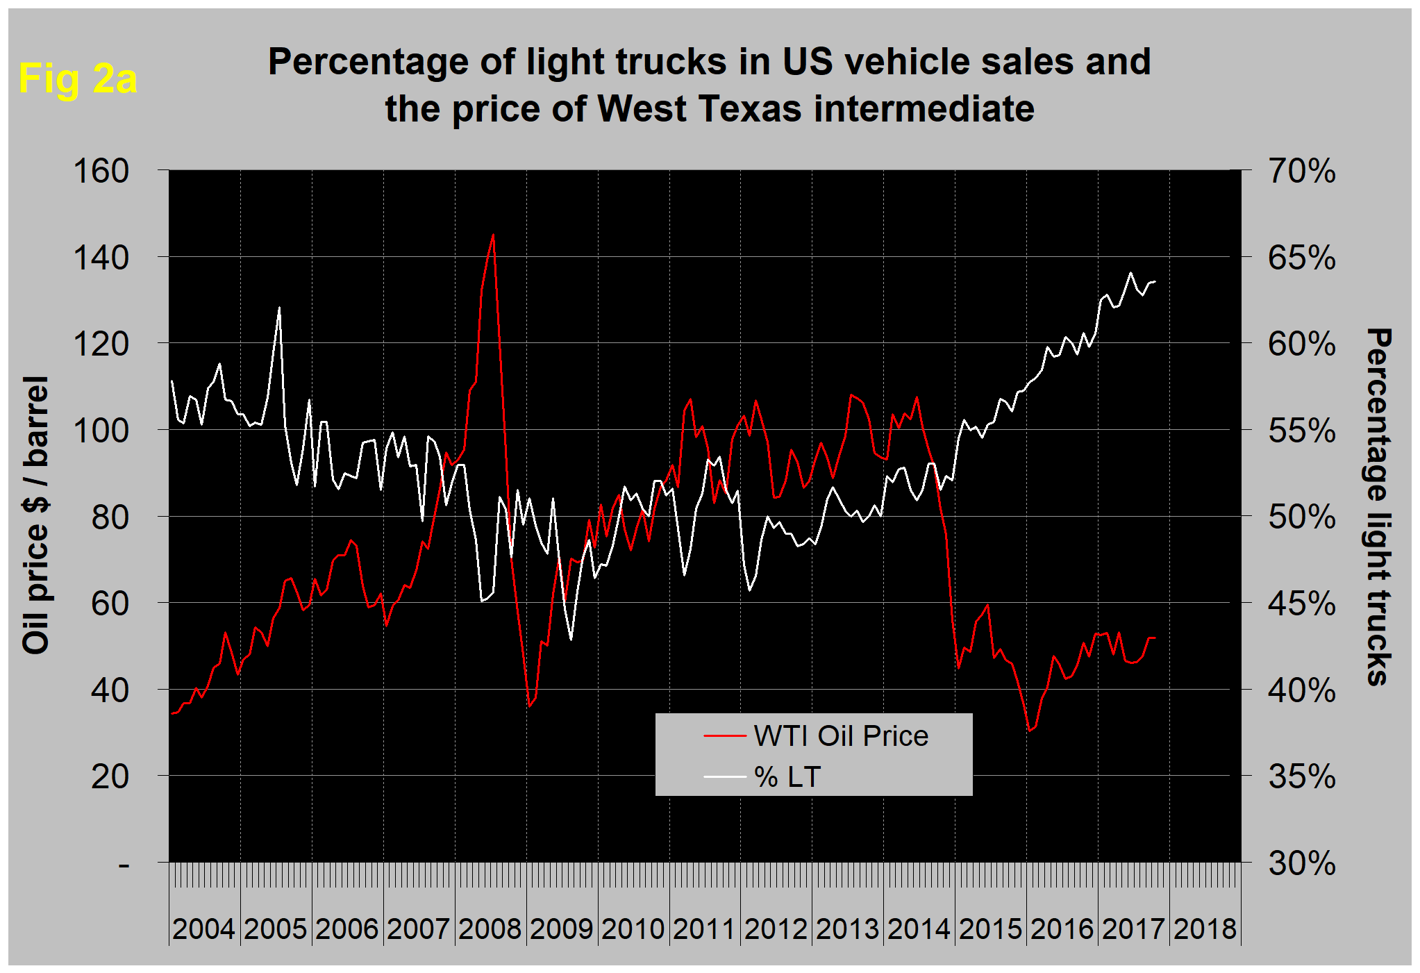
This month, we decided to see if the conventional view that lower oil prices drive the shift to light truck sales is true. Figure 2a is the result and it’s not quite as simple as might be expected. The rising price of oil from 2004 through 2008 did cause a market shift away from light trucks with momentum through mid-2009. As the price of oil recovered to the $90 per barrel range between 2011 and 2014, the portion of light trucks oscillated around the 50 percent mark with no tendency for the previous decline to be re-established. Then when oil prices crashed in the second half of 2014, the portion of light trucks took off. Our take on this is that if the price of oil goes back to $90, the portion of light trucks in the sales mix will fall somewhat from its current level of 63 percent. But we think that customer preference is now so well established that there won’t be a return to the 50 percent range.
NAFTA Vehicle Assemblies
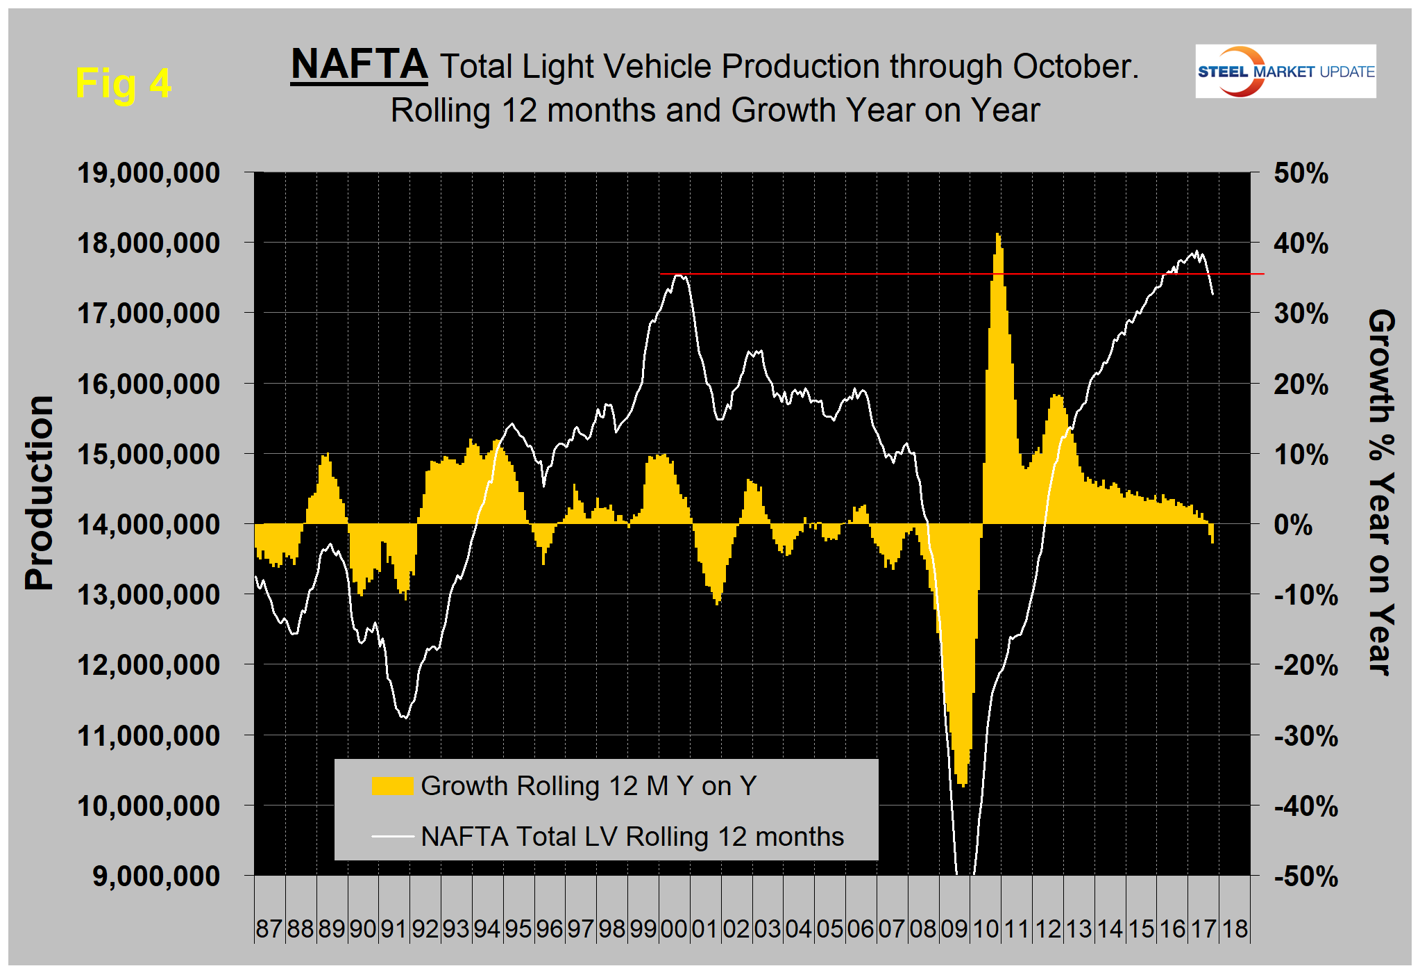
Total light vehicle (LV) production in NAFTA in October hit an annual rate of 18.1 million units, down from 18.4 million in August but up from 16.0 million in September. On average since 2004, October’s production has been up by 7.6 percent from September. This year, production was up by 13.2 percent, therefore stronger than normal (Figure 3).
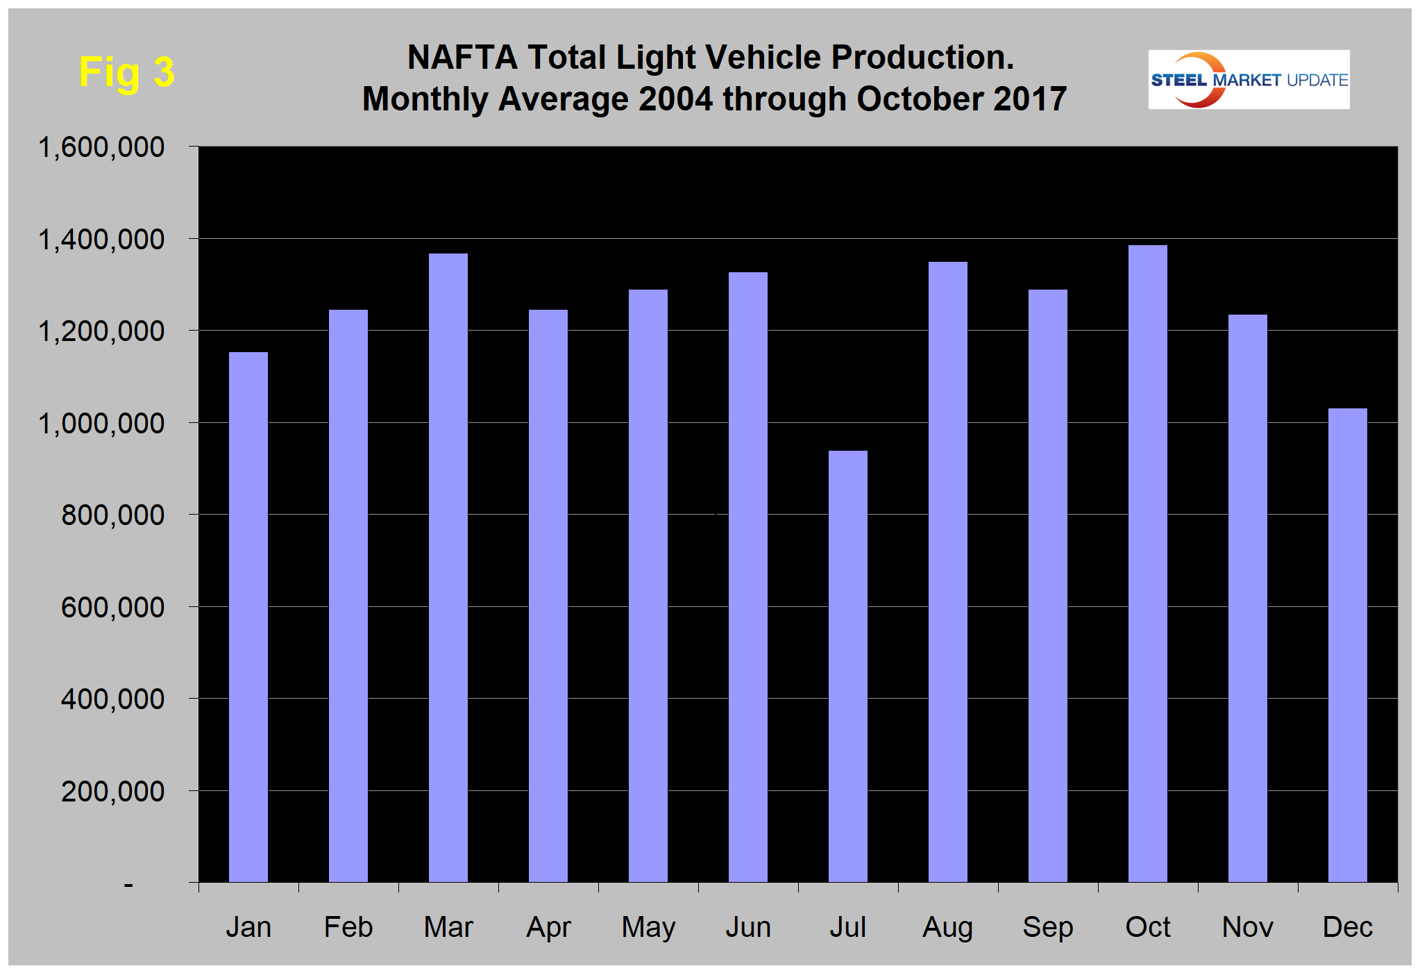
What actually happened was that production was moved from September to October this year for unknown reasons. Year to date through October 2017, production was down by 4.0 percent from the same period in 2016. Note that production numbers are not seasonally adjusted; the sales data reported above are seasonally adjusted. Another consideration to note is that auto assemblies in NAFTA are a complex mix of parts and subassemblies moving both ways between nations and particularly across the southern border. We are reporting on the point of final assembly and have no data to assess how the trade in parts affects the total value mix between nations.
On a rolling 12-months basis year over year through October, LV production in NAFTA decreased by 2.7 percent. September and October were the first months to experience a decrease since May 2010. There has been a very gradual slowdown in growth for the last three years as indicated by the brown bars in Figure 4. Up until the last three months, production was higher than the previous all-time high every month since early 2016.
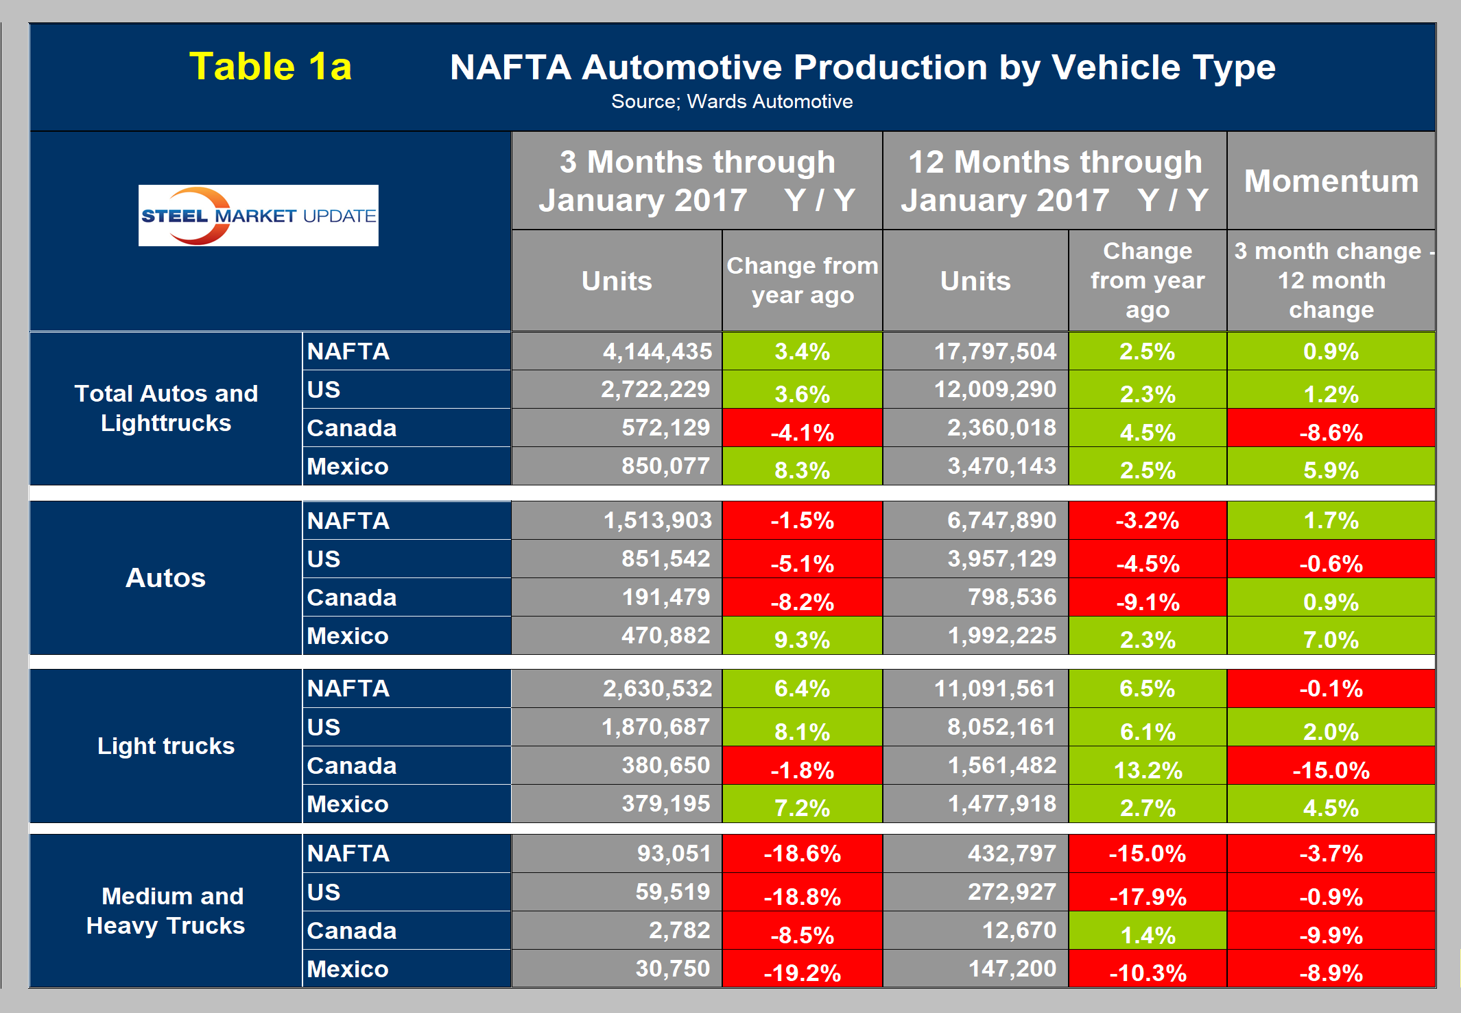
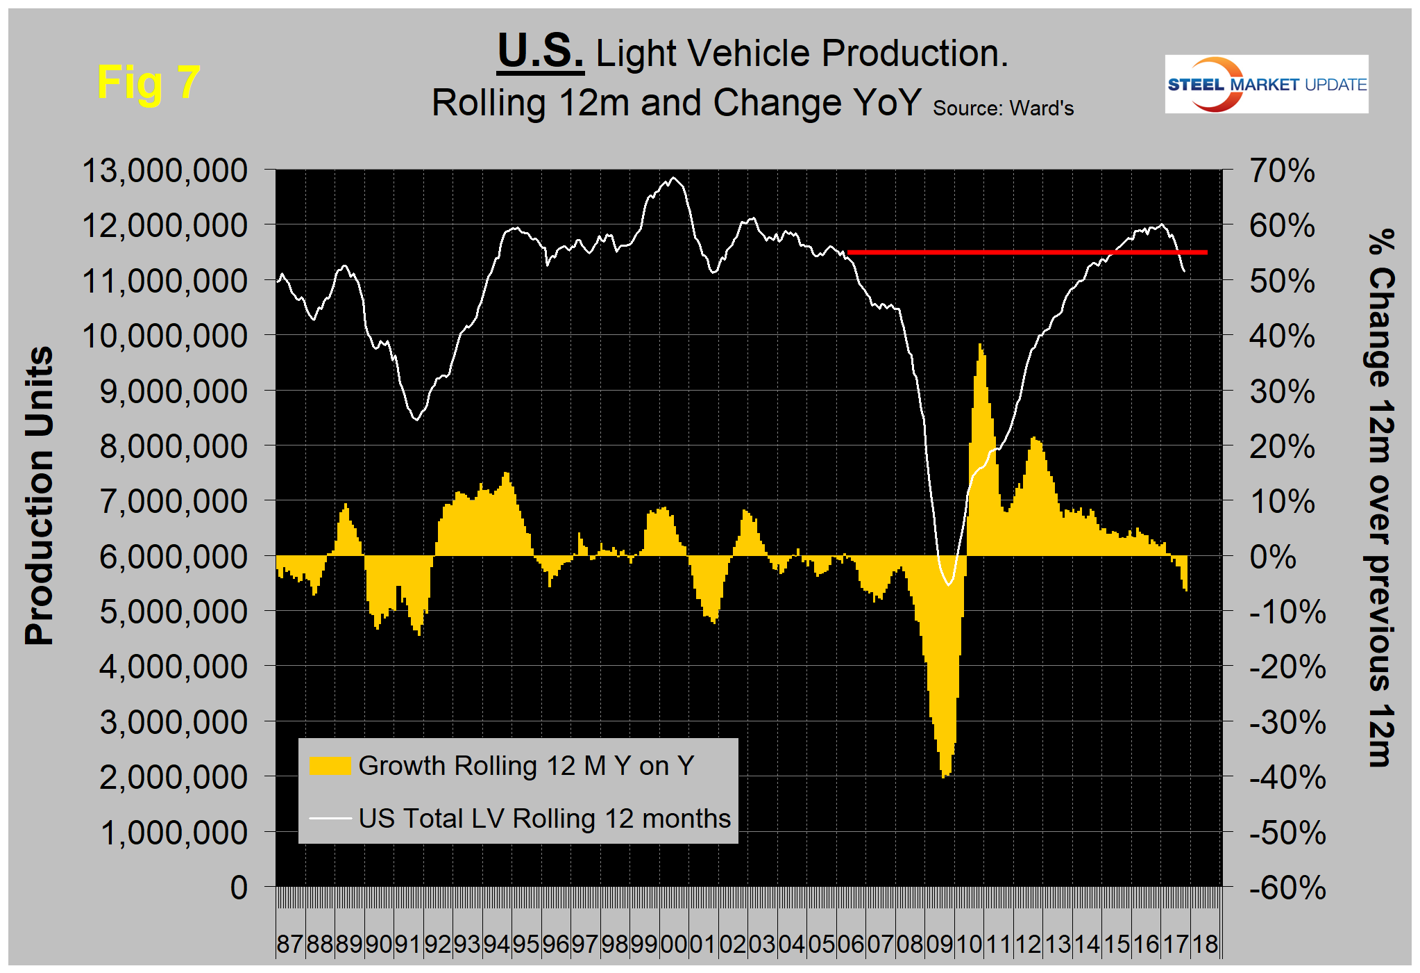
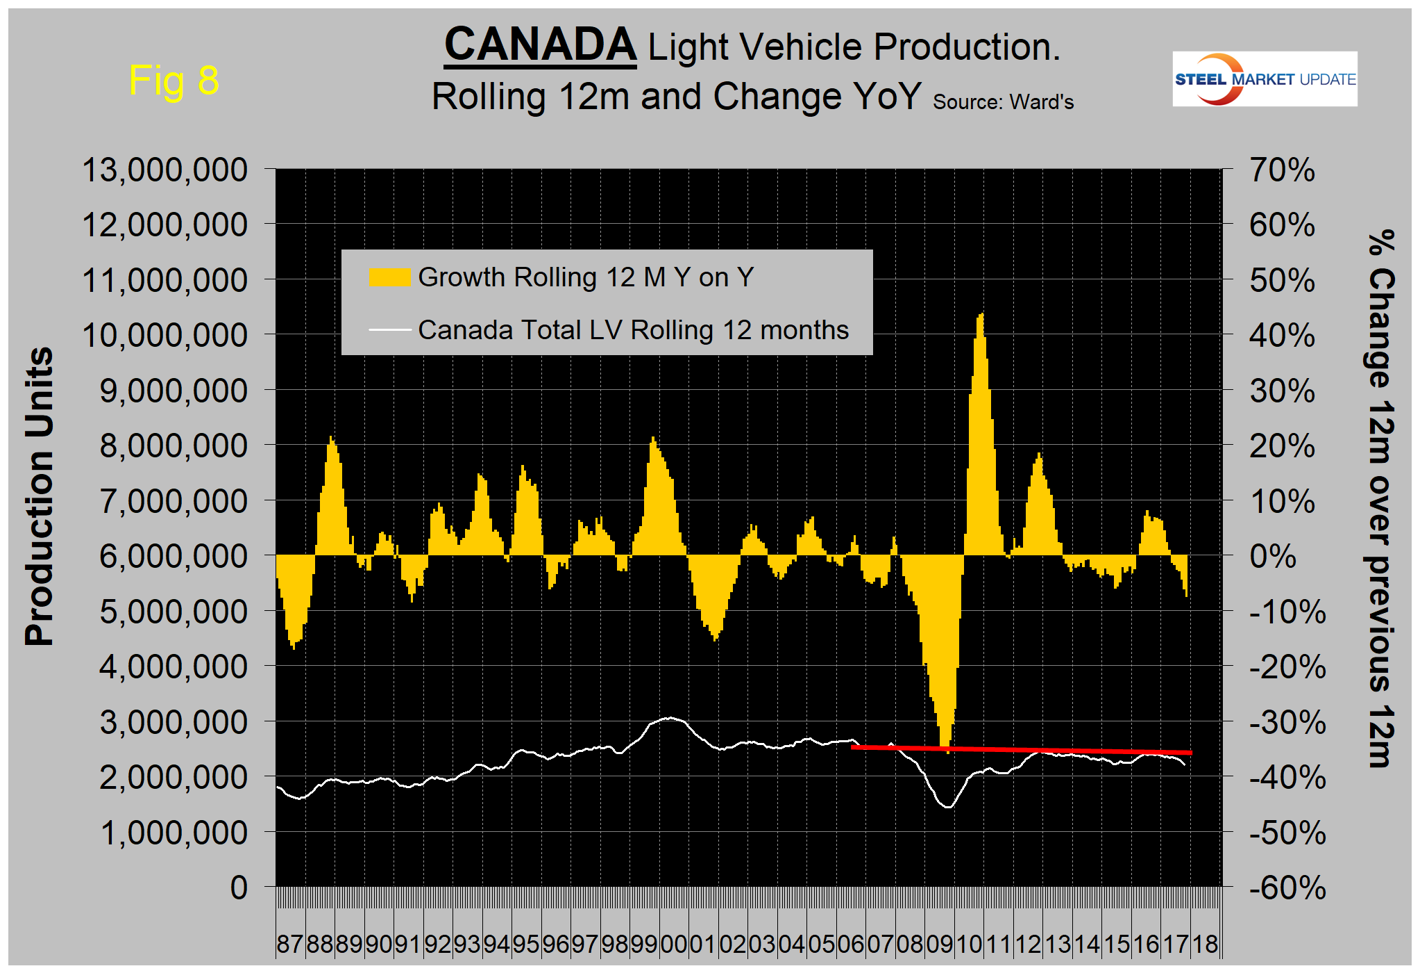
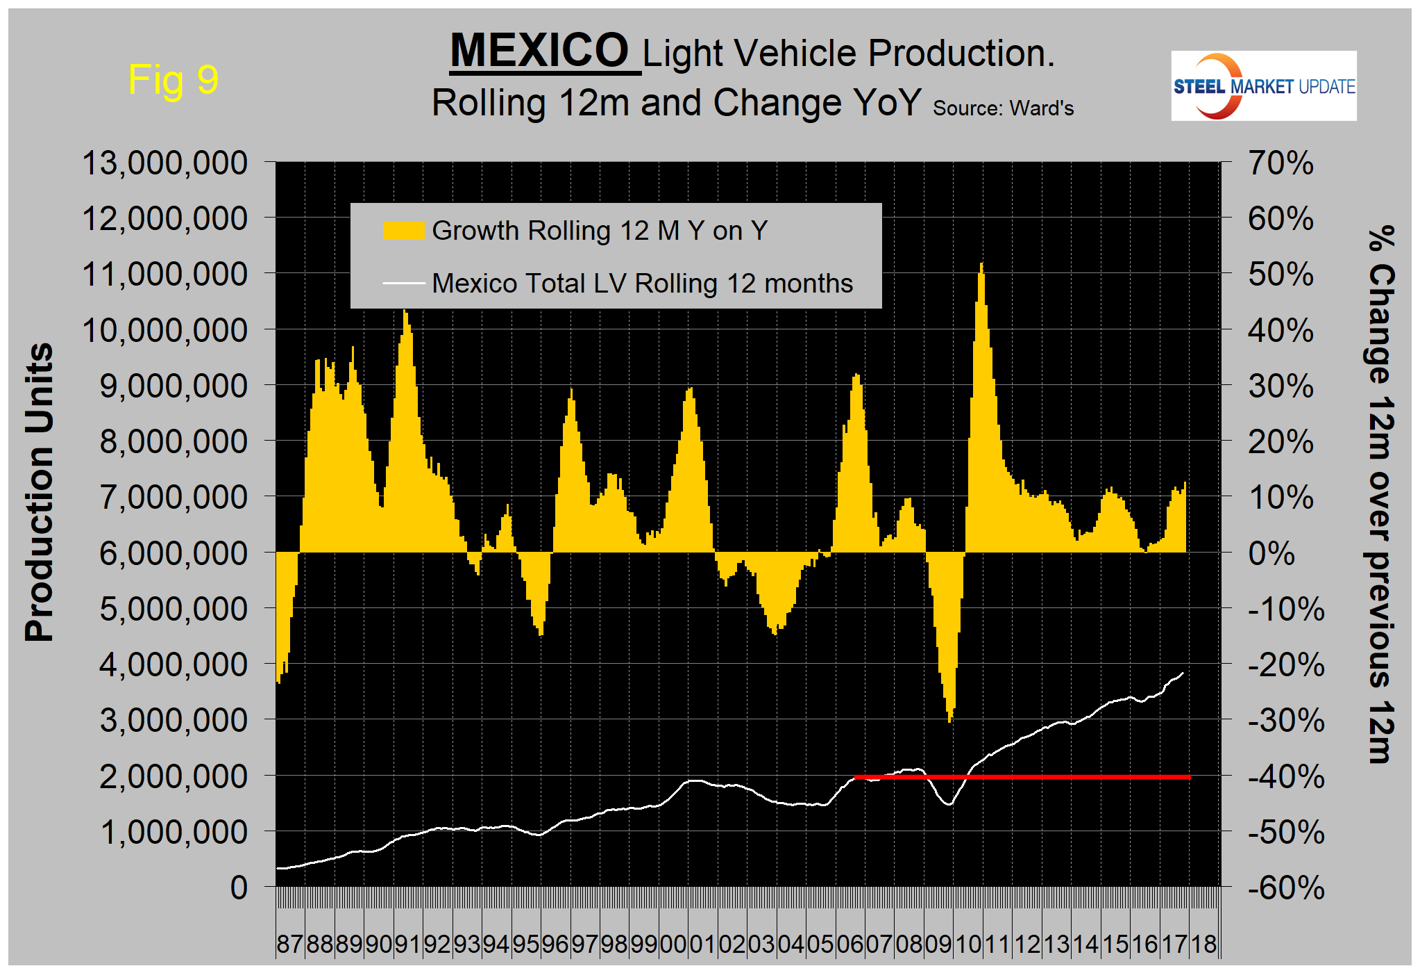
On a rolling 12-months basis year over year, total light vehicle production in the U.S. declined by 6.4 percent, Canada declined by 7.5 percent and Mexico was up by 12.5 percent. The comparison is worse for the U.S. and Canada comparing the latest three months year over year when the results are: U.S. down by 13.1 percent, Canada down by 17.4 percent and Mexico up by 11.5 percent (Table 1). For those readers who would like to get a broader understanding of what has happened in 2017, we have recreated Table 1 for January this year as Table 1a.
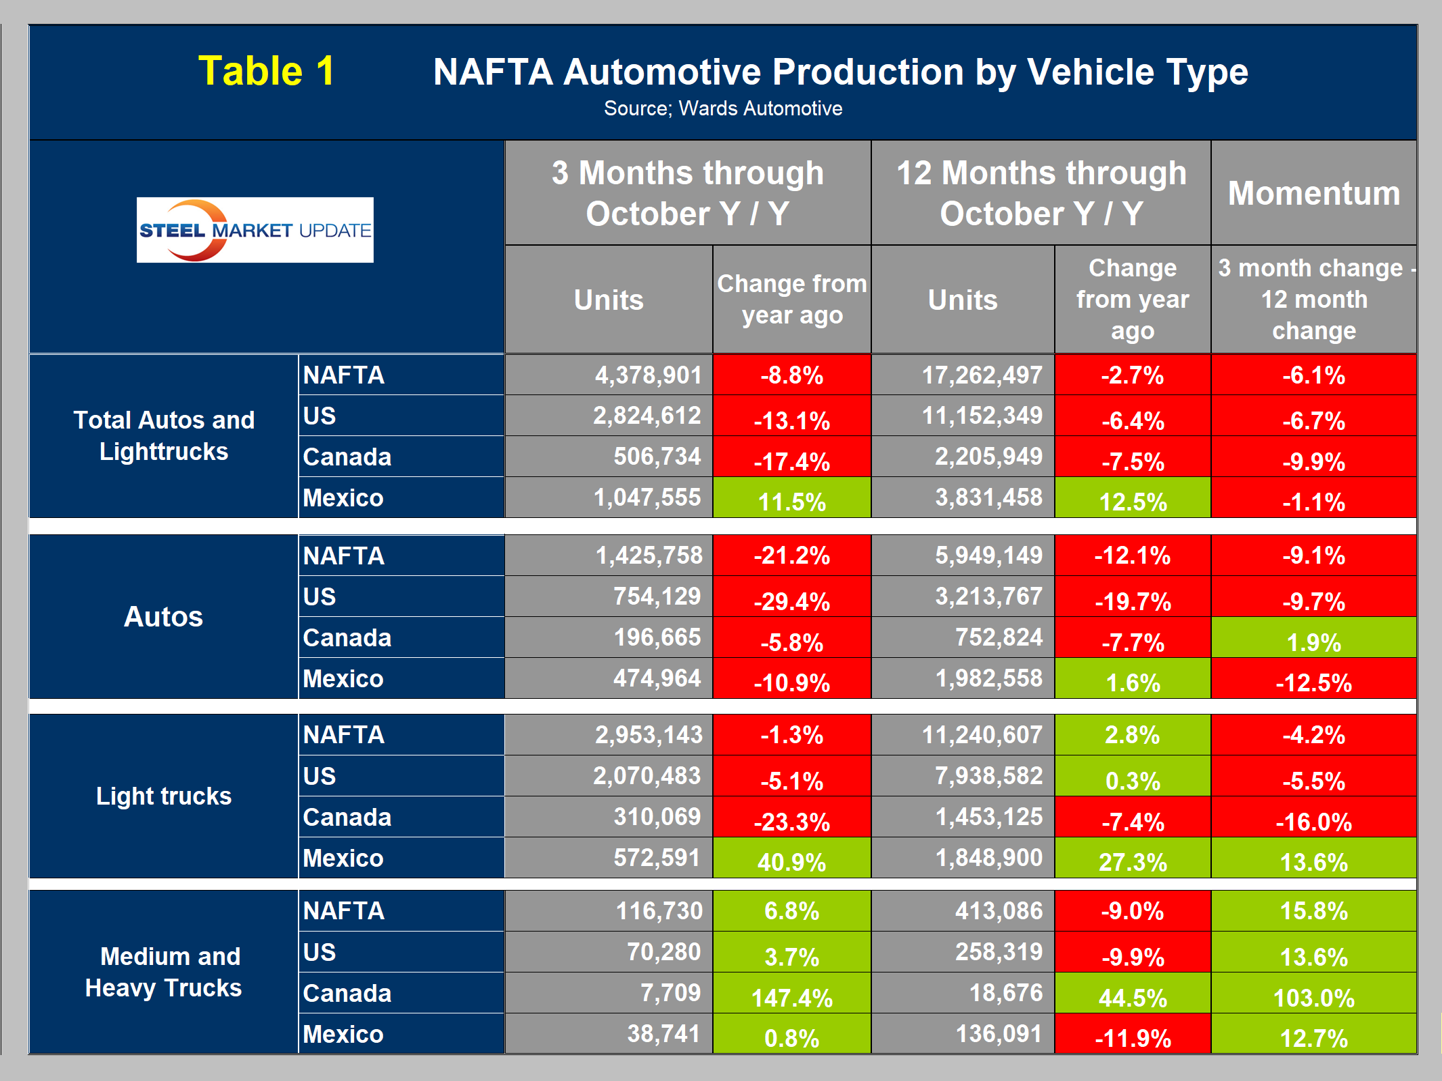
Like a broken record, we repeat here what we have been reporting for a while: from the U.S. point of view, the news is not good. We are in the midst of a huge shift in assembly volume of both autos and light trucks from both the U.S. and Canada to Mexico. The comparison of Tables 1 and 1a is particularly shocking for light trucks. The shift south of the border is illustrated in Figures 5 and 6, which show production share for autos and light trucks, respectively.
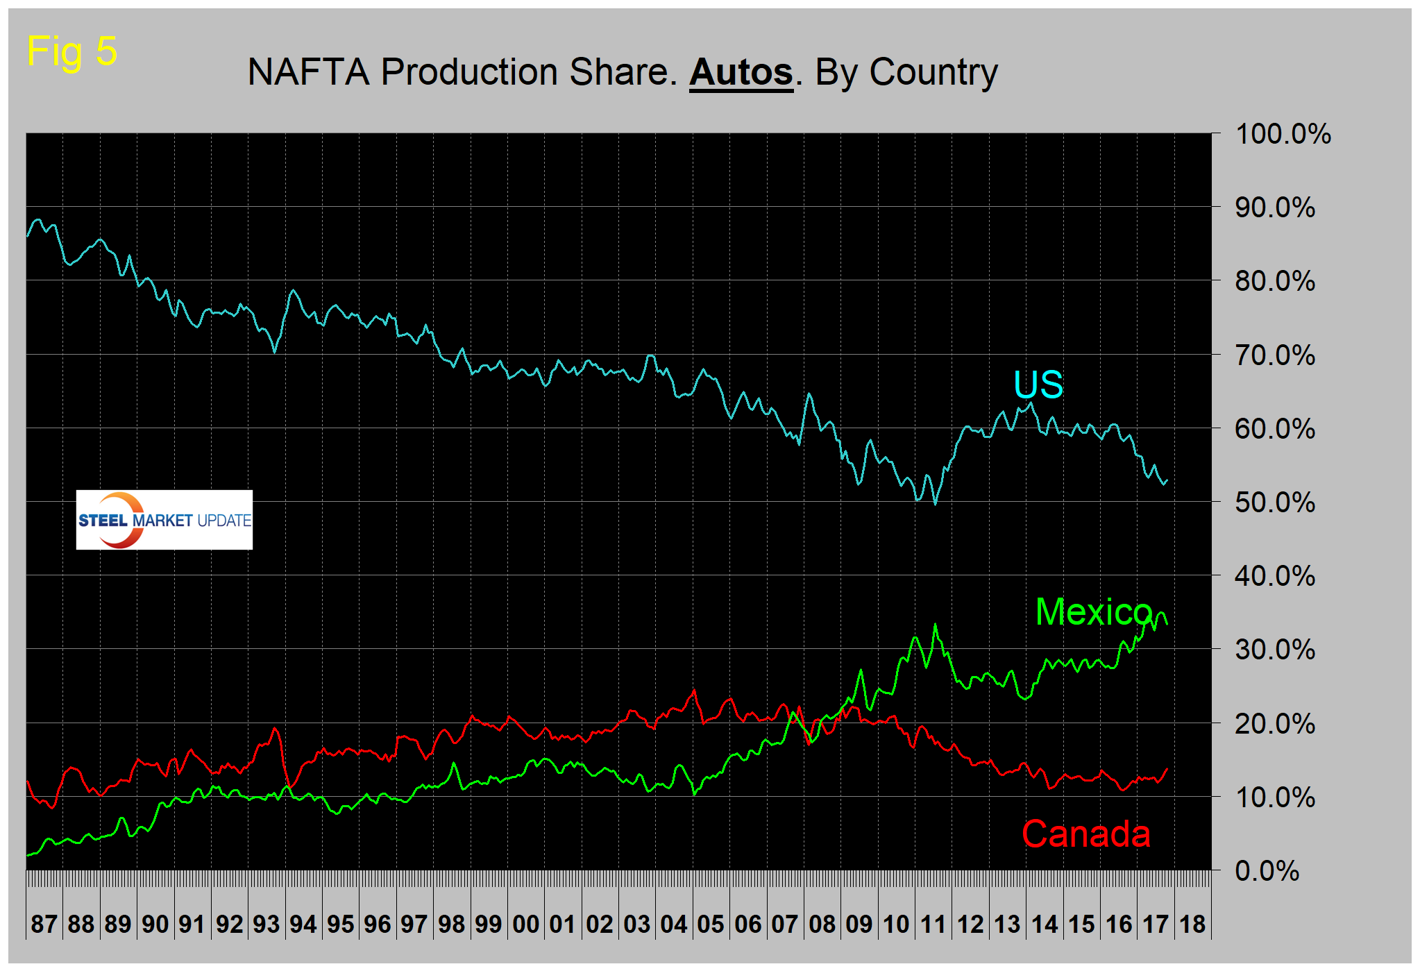
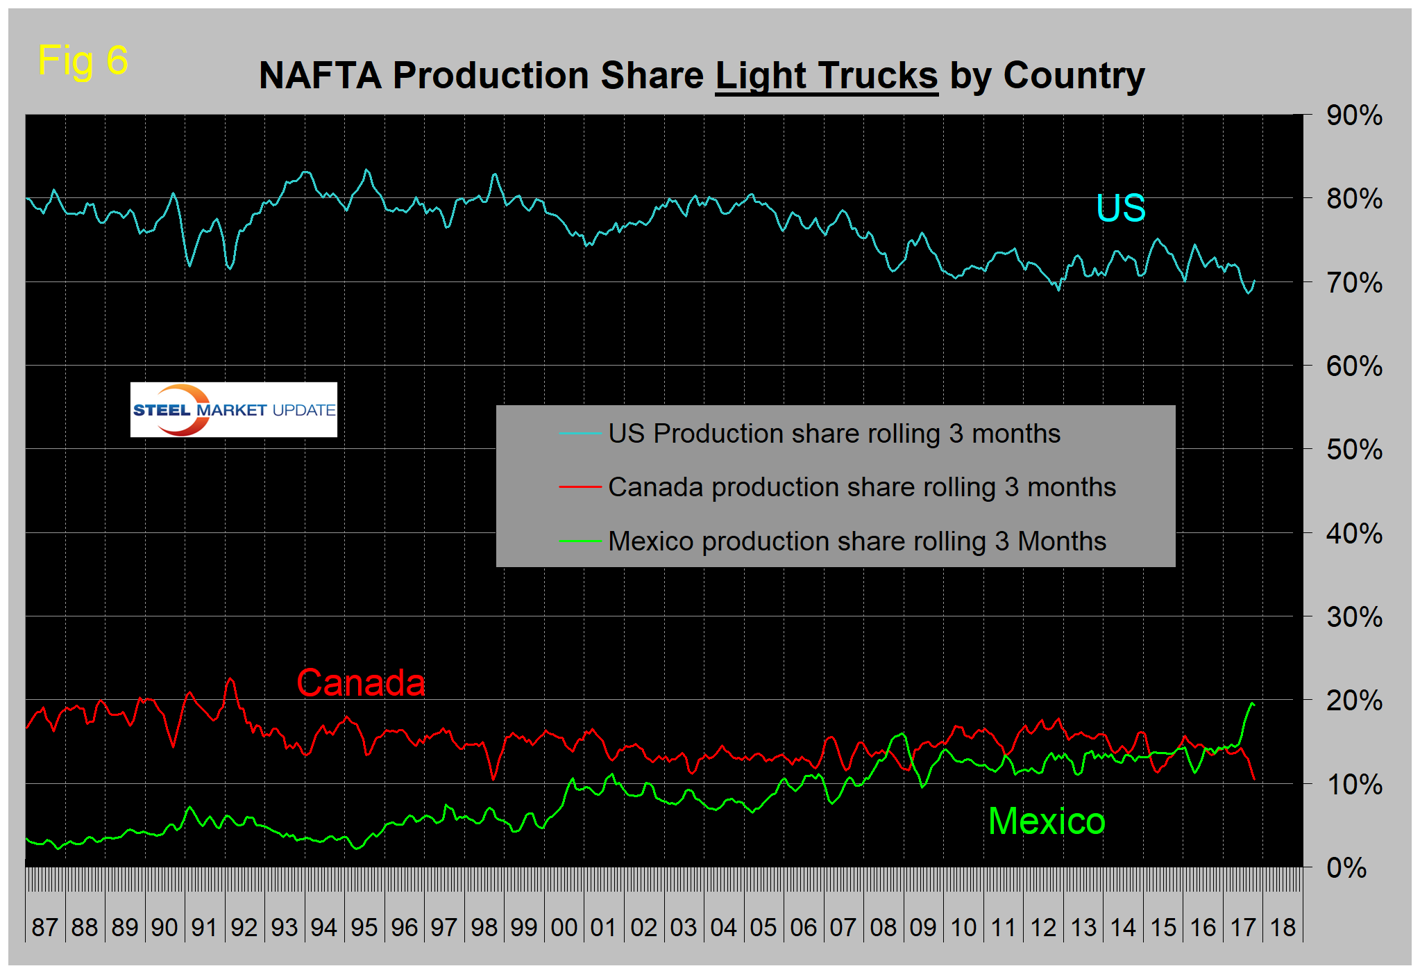
The U.S. now has a market share of autos of 52.9 percent, Mexico has 33.3 percent and Canada has 13.8 percent. Up until this year, the U.S. market share of light trucks hadn’t changed much since mid-2009, but in 2017 there has been a sharp increase in Mexico’s share at the expense of both the U.S. and Canada. The U.S. share is now 70.1 percent, Mexico’s is 19.4 percent and Canada’s is 10.5 percent. In three months through October year over year, Mexico’s production of light trucks grew by 40.9 percent. The U.S. contracted by 5.1 percent and Canada contracted by 23.3 percent. In recent months Mexico’s share of both autos and light trucks has been the highest ever. The Mexican light vehicle production target for 2020 is 5.0 million units, according to Eduardo Solis, president of the Mexican Automotive Industry Association. In the 12 months through October, Mexico’s LV production was 3.831 million units, up from 2.887 million in 12 months through October 2016.At this rate, Mexico will exceed Sr. Solis’ target.
Figures 7, 8 and 9 show total LV production by country. The brown bars are the respective growth rates, and they tell the whole story. The red line on each chart shows the change in production since Q2 2006. Note the scales are the same to give true comparability and that Mexican growth has surged in 2017. Mexico currently exports about 80 percent of its LV production. The U.S. and Canada are the top two destinations with 61.5 percent and 7 percent of the total, respectively.
Under the current NAFTA wording, at least 62.5 percent of the material in a car or light truck made in the region must come from North America to enter the marketplace tariff-free. The Trump administration has proposed raising the amount of NAFTA content in autos to 85 percent and securing 50 percent of the total for the United States. The demand to reserve the lion’s share of automotive manufacturing for the United States helped cast a pall over a fourth round of talks to revamp the 23-year-old accord underpinning $1.2 trillion in annual trilateral trade. Solis, at Mexico’s auto industry trade association, called the U.S. proposal for country-specific content rules unacceptable, saying it violated World Trade Organization rules.
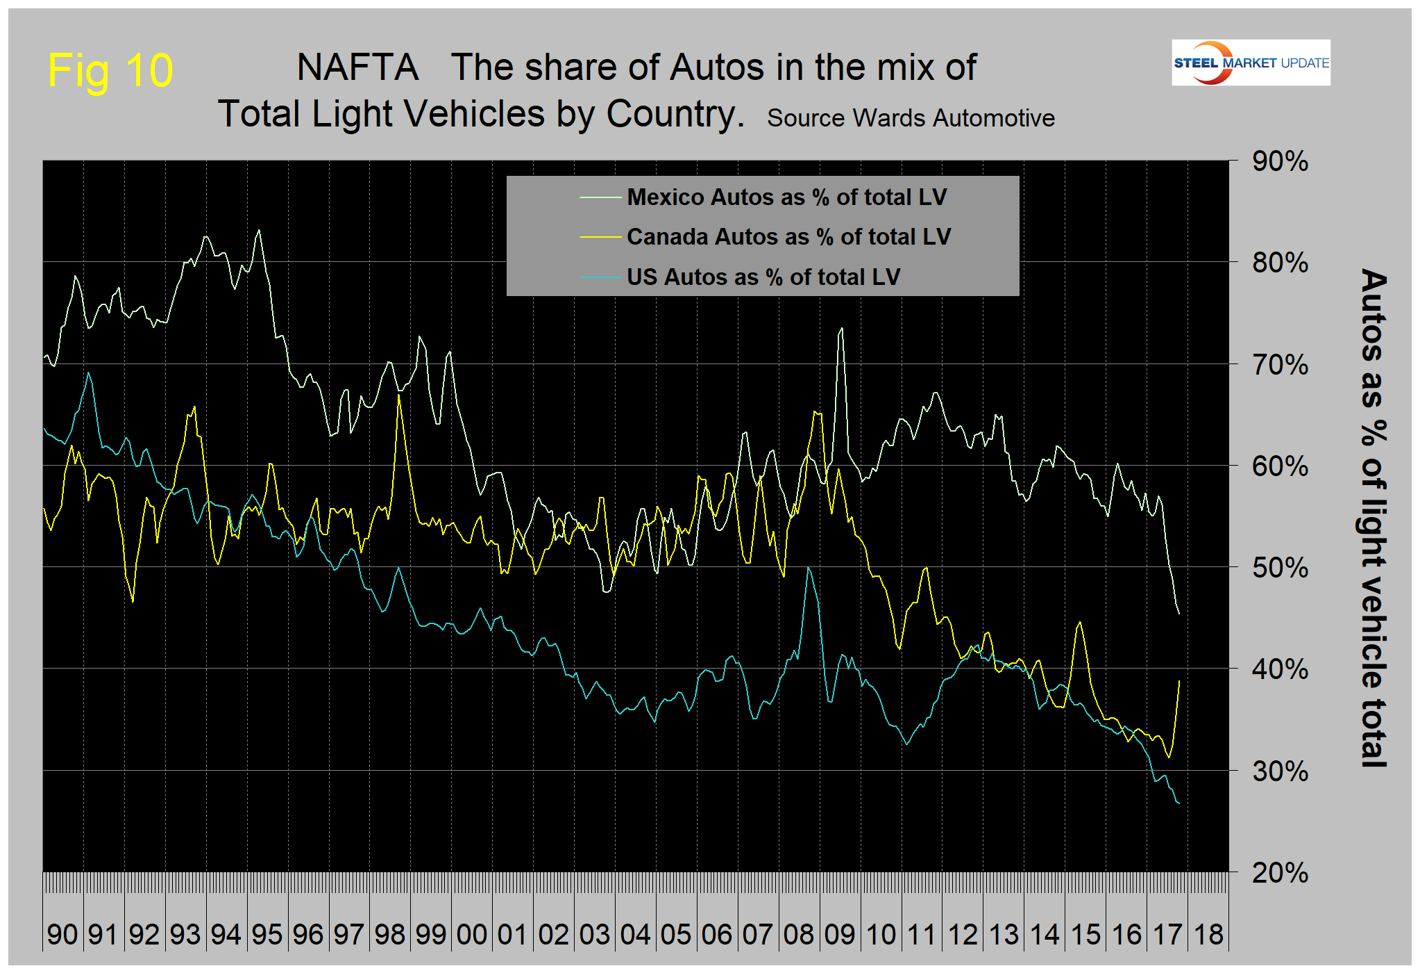
Figure 10 shows that the percentage of autos in the light vehicle mix has been declining for all three countries since 2012, though Canada has had a recent resurgence. In general, car sales—including four door sedans, two-door coupes, station wagons and hatchbacks—continue to substantially underperform their SUV, crossover, and pickup truck counterparts.
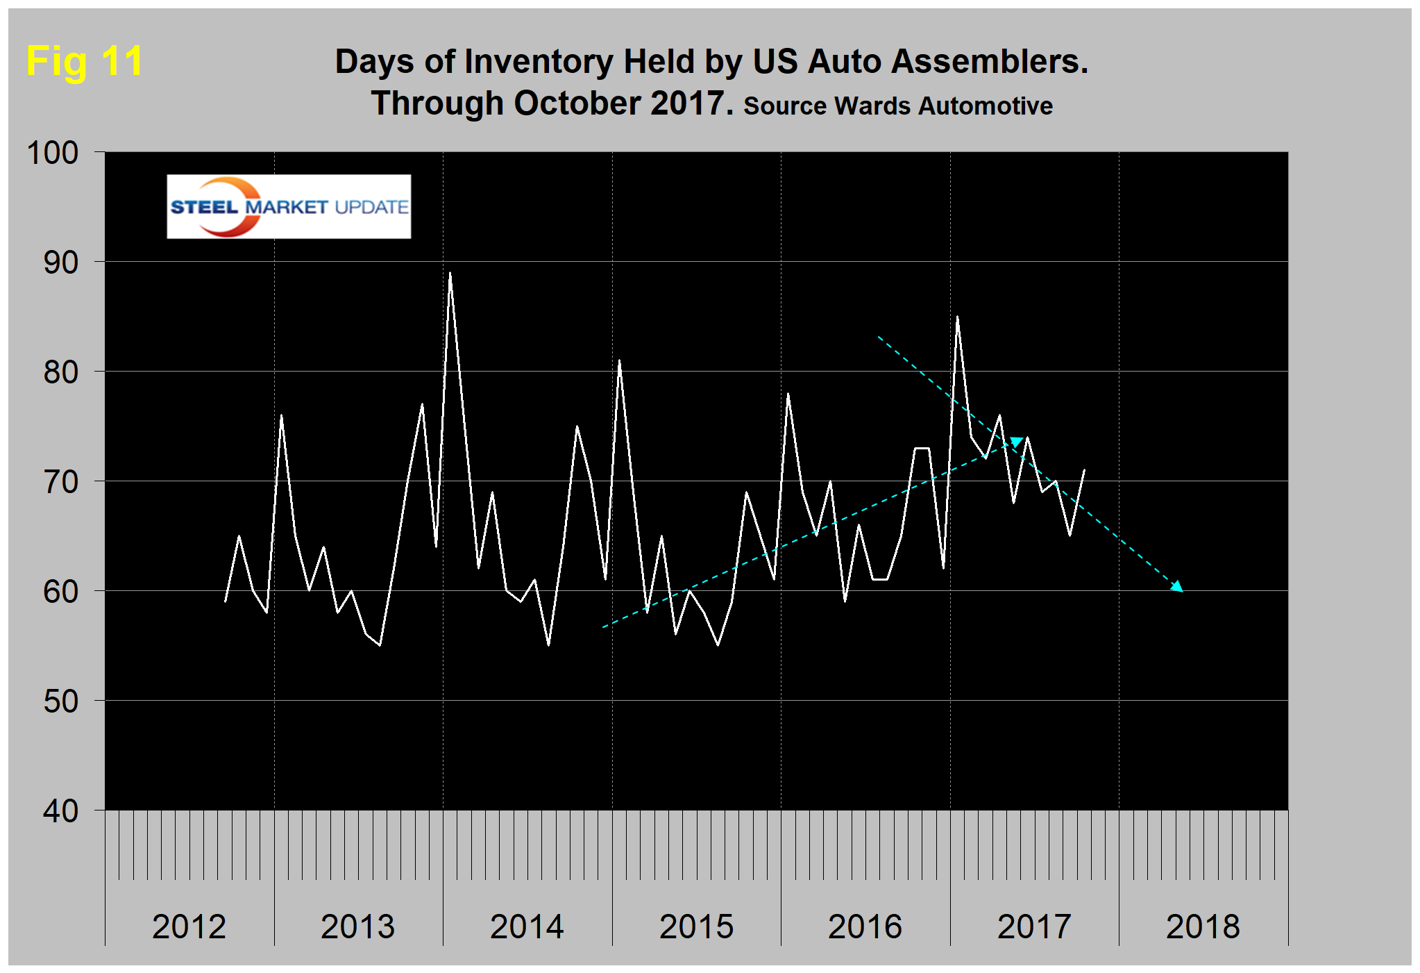
Ward’s Automotive reported this week that total light vehicle inventories in the U.S. were 71 days at the end of October, which was up from 65 days at the end of September. Month over month, FCA’s (Fiat Chrysler Automotive) inventory increased from 76 to 85 days, GM was up from 76 to 80 days and Ford was up from 72 to 79 days. To put those results into perspective, Toyota was up from 47 to 58 days. Figure 11 shows that in 2017, despite the October increase, the auto companies have reversed a two-year trend of rising inventories.
The SMU data file contains more detail than can be shown here in this condensed report. Readers can obtain copies of additional time-based performance results on request if they wish to dig deeper. Available are graphs of auto, light truck, medium and heavy truck production. Also, growth rates and production share by country.