

Market Data

November 29, 2017
Currency Update for Steel Trading Nations
Written by Peter Wright
The broad index value of the U.S. dollar has strengthened since Sept. 8, but in the last month the dollar has weakened against 13 of the 16 steel trading nations’ currencies.
From Jan. 3 through Sept. 8, 2017, the Broad Index value of the U.S. dollar depreciated by 9.3 percent. The value rebounded by 2.9 percent from Sept. 9 through Nov. 17.
Please see the end of this report for an explanation of data sources. The analysis of currency trends is a highly technical undertaking; therefore in this monthly SMU update we incorporate the opinions of analysts we deem credible to add color to our own data analysis.
A strong dollar may not be so good for emerging markets, according to new research co-authored by Valentina Bruno, an associate professor of finance at American University’s Kogod School of Business. The researchers examined relationships among cross-border bank flows, the U.S. dollar, and corporate investments in 34 emerging market economies and more than 14,000 firms. After analysis of the data, the researchers found a strong dollar was associated with slower cross-border bank flows and lower real investment in emerging market economies. “The U.S. dollar is a key barometer of global credit conditions,” Bruno said. “When the dollar depreciates, there is more dollar credit available to borrowers, loosening financial conditions globally. In this sense, what happens in the financial markets has consequences for the real economy. There is a strong negative relationship between the U.S. dollar and cross-border bank lending denominated in U.S. dollars. Second, increases in U.S. dollar denominated cross-border bank credit to given emerging market economies are associated with greater real investment in those emerging market economies. Finally, a strengthening of the U.S. dollar triggers a decline in real investment in that country.”
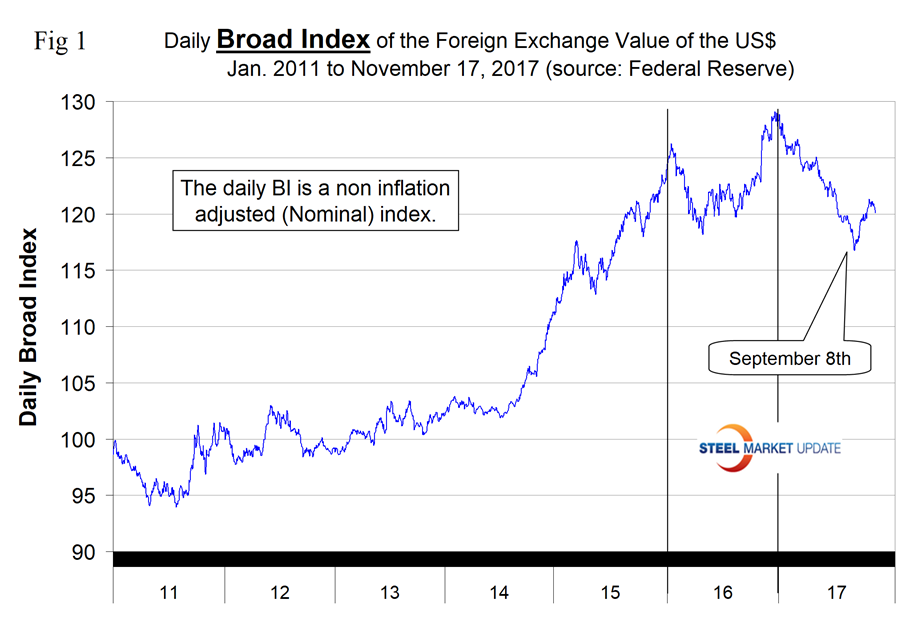
The Broad Index value of the U.S. dollar is reported several days in arrears by the Federal Reserve; the latest value published was for Nov. 17. Figure 1 shows the index value since January 2011. The dollar had a recent peak of 128.96 on Jan. 3, which was the highest value since July 4, 2004, almost 15 years. The recent low point was Sept. 8 at 116.74; since then the dollar has recovered to 120.10 on Nov. 17.
Each month we publish an update of Table 1 which shows the value of the U.S. dollar against the currencies of sixteen major global steel and iron ore trading nations. The table shows the change in value in one year, three months, one month and seven days.
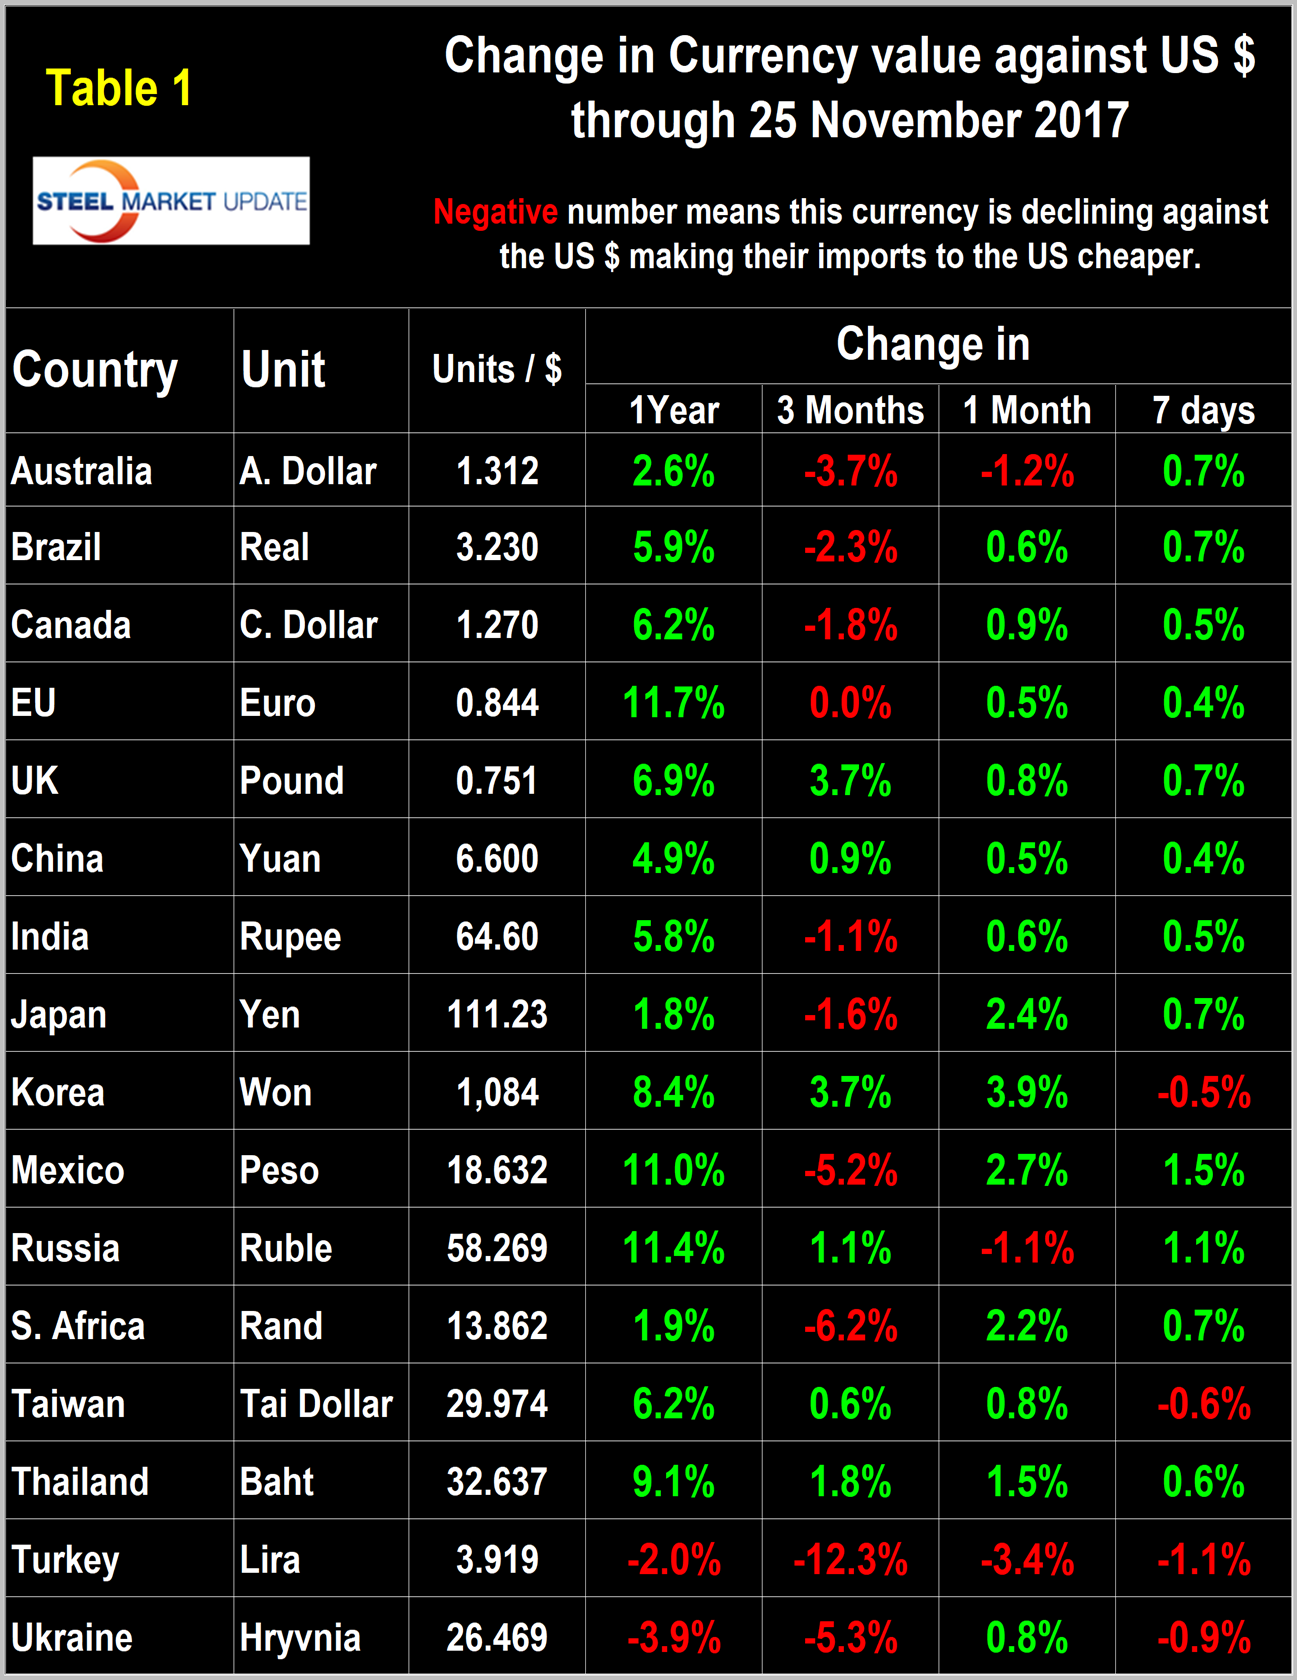
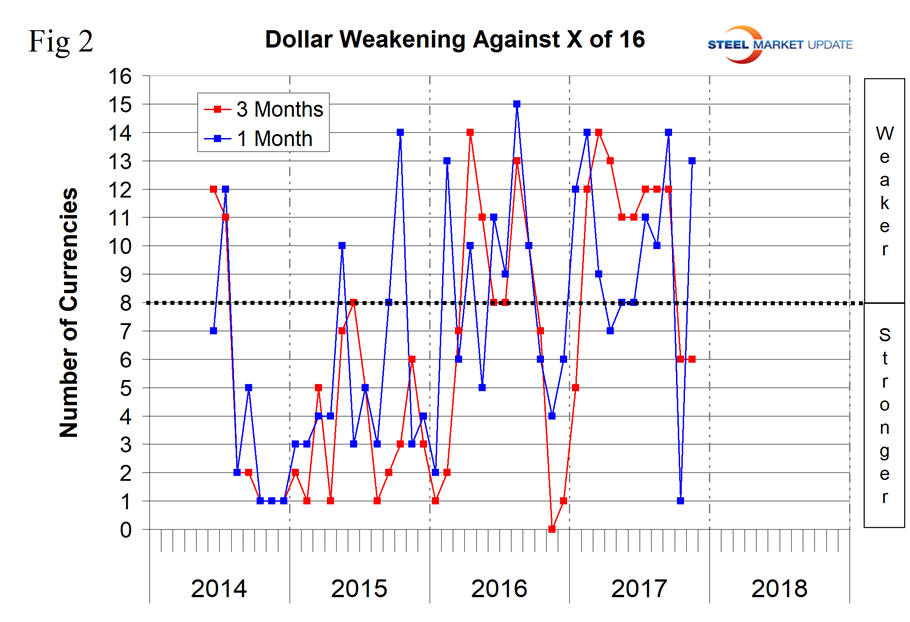
Figure 2 gives a long-range perspective and shows the extreme gyrations that have occurred in the last three years. Figure 2 shows that the dollar weakened against 13 of the 16 currencies in the last month. This was a major reversal from our update exactly a month ago when it strengthened against 15 of the 16 in the one-month time frame. Sometimes the change in value of these 16 currencies does not accord with the broad index and this is one of those times.
A rising dollar puts downward pressure on all commodity prices that are greenback denominated. Table 1 is color coded to indicate strengthening of the dollar in red and weakening in green. We regard strengthening of the U.S. dollar as negative and weakening as positive because the effect on the trade balance of all commodities and also of the total national trade deficit.
In each of these reports, we comment on several of the 16 steel and iron ore trading currencies listed in Table 1 and over a period of several months will describe the history of all of them. Charts for each of the 16 currencies are available through Oct. 15 for any premium subscriber who requests them.
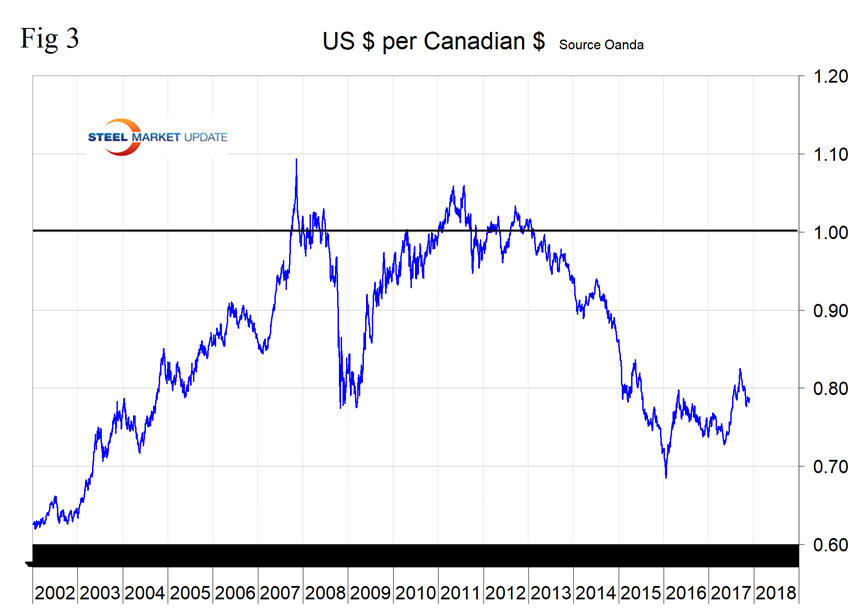
The Canadian Dollar has weakened by 1.8 percent in the last three months. On Nov. 1, Dean Popplewell, a currency analyst wrote: “Canada’s economy contracted in August, surprising the markets, which had expected a small gain. The decline of 0.1 percent was the first drop since October 2016. The soft reading has pushed USD/CAD above the 1.29 line at the start of the North American session. The Canadian dollar is on the verge of dropping to a 10-week low, and has endured a miserable October, slipping some 3.5 percent. There were no surprises from the Bank of Canada last week, as the Bank maintained the benchmark rate at 1.00 percent. In its rate statement, the Bank noted that wage growth levels remain weak, as there is slack in the labor market. Inflation pressure from wage growth remains muted, but the Bank did not provide a reason why inflation levels are so low. This problem is apparent south of the border as well, where a robust U.S. economy and red-hot labor market has not translated into higher inflation. The cautious tone of the BoC did not impress investors, and the Canadian dollar shed close to 1.0 percent on Wednesday after the rate announcement.” Figure 3 shows the value of the C$ in U.S. dollars since January 2002. On Nov. 25, the C$ was worth 79 U.S. cents.
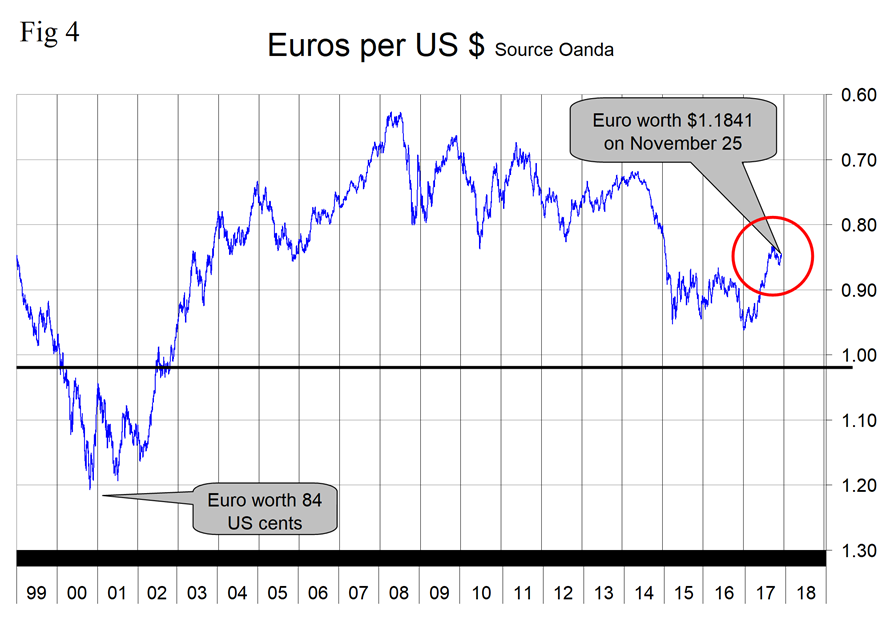
The Euro has appreciated by 0.5 percent in the last month. Figure 4 shows the value of the euro in U.S. dollars since its inception in 1999. On Nov. 25, the euro was worth 1.1841 U.S. dollars. Mark Chandler, who publishes almost daily currency commentaries, wrote on Nov. 23: “The euro is edging higher to trade at its best levels since the middle of last month. It is drawing closer to the $1.1880 area, which if overcome, could point to return to the year’s high seen in early September near $1.2100. There is a combination of factors lifting the euro. The recent data, including yesterday’s flash PMI, suggests that the regional economy is re-accelerating here in Q4. Today’s German IFO survey provides corroboration. The assessment of the overall business climate rose to a new record high of 117.5 from an upwardly revised 116.8. The breakdown showed that even though the assessment of the current economy eased a touch, the improved expectations more than offset it.”
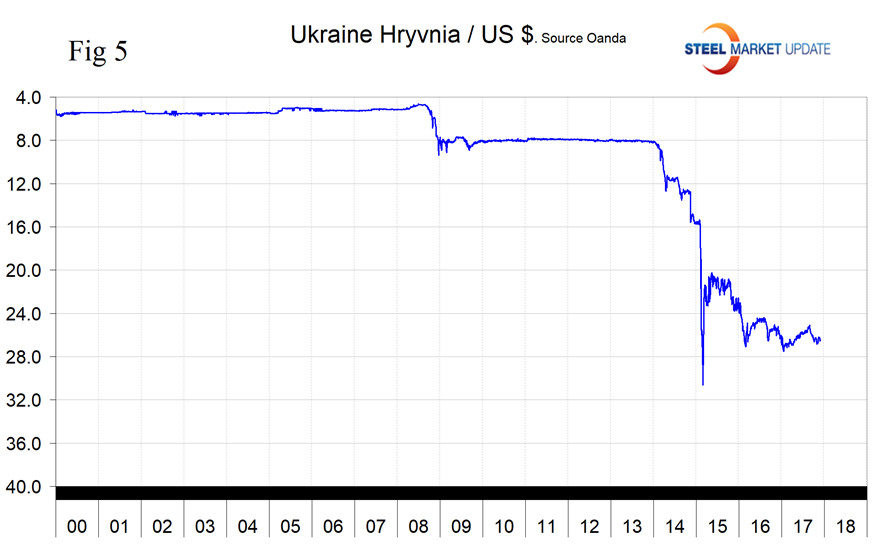
The Ukranian Hryvnia: Figure 5 shows the relationship between the hryvnia and the U.S. dollar. The hryvnia has appreciated by 0.8 percent in the last month, but is down by 5.3 percent in three months. In 2016, Ukraine was the 10th largest steel producer of all nations at 24.2 million metric tons, of this 71.7 percent was produced in basic oxygen furnaces. In 2016, Ukraine was the 7th highest tonnage exporter when it shipped 18.2 million metric tons to other nations. Through mid-November, Ukraine had shipped 222,592 metric tons of all steel products to the U.S. putting it in 25th place.
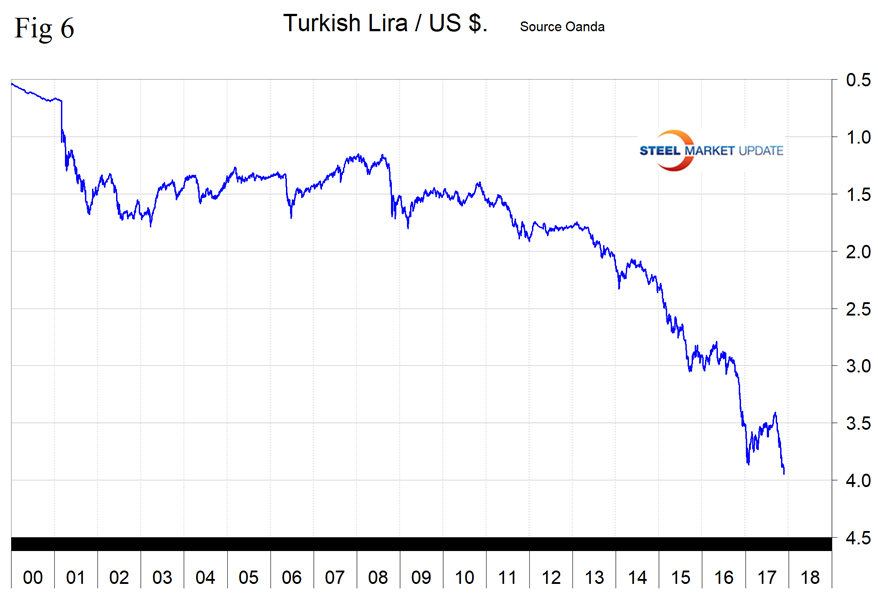
The Turkish Lira: Figure 6 shows the relationship between the lira and the U.S. dollar. 2017 has been an erratic year for the lira. From Jan. 27 to Sept. 10, the lira appreciated by 13.6 percent. Since then the lira has gone into free fall and depreciated by 13.1 percent. In 2016, Turkey was the 8th largest steel producer of all nations at 33.2 million metric tons, of this 65.9 percent was produced in EAFs. In 2016, Turkey was the 10th highest tonnage exporter when it shipped 17.0 million metric tons to other nations. Through mid-November, Turkey was the 7th major exporter to the U.S. with 1,925,954 metric tons.
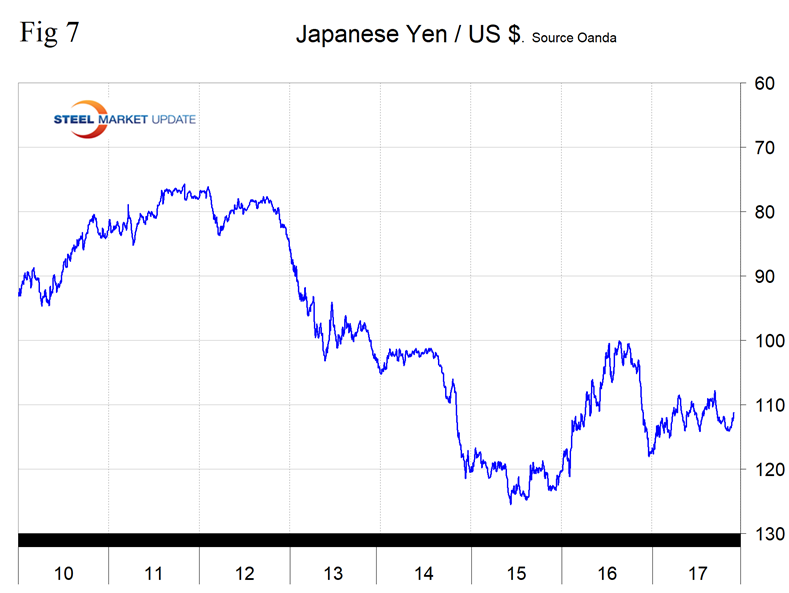
The Japanese Yen has appreciated by 2.4 percent in the last month, but in three months is down by 1.6 percent (Figure 7). On Nov. 24, Mark Chandler wrote: “The increase of U.S. 10-year Treasury yields appears to be lending support to the greenback against the yen. The Bank of Japan has reduced the number of long bonds (25 years plus) by JPY10 bln to JPY90 bln. It is the first reduction since March. There had been talks among primary dealers in Japan that the government was considering reducing issuance of bonds with very long maturities (40 years) in the next fiscal year, and this had resulted in what some thought was an undesirable flattening of the curve. Separately, we note that last week was the first in four weeks that the Ministry of Finance data showed Japanese investors turned net buyers of foreign bonds.”
Explanation of Data Sources: The broad index is published by the Federal Reserve on both a daily and monthly basis. It is a weighted average of the foreign exchange values of the U.S. dollar against the currencies of a large group of major U.S. trading partners. The index weights, which change over time, are derived from U.S. export shares and from U.S. and foreign import shares. The data are noon buying rates in New York for cable transfers payable in the listed currencies. At SMU, we use the historical exchange rates published in the Oanda Forex trading platform to track the currency value of the U.S. dollar against that of 16 steel and iron ore trading nations. Oanda operates within the guidelines of six major regulatory authorities around the world and provides access to over 70 currency pairs. Approximately $4 trillion U.S. dollars are traded every day on foreign exchange markets.


