

Market Data

December 21, 2017
Currency Update for Steel Trading Nations
Written by Peter Wright
The Fed rate increase in December was a non-event as far as the Broad Index value of the U.S. dollar was concerned.
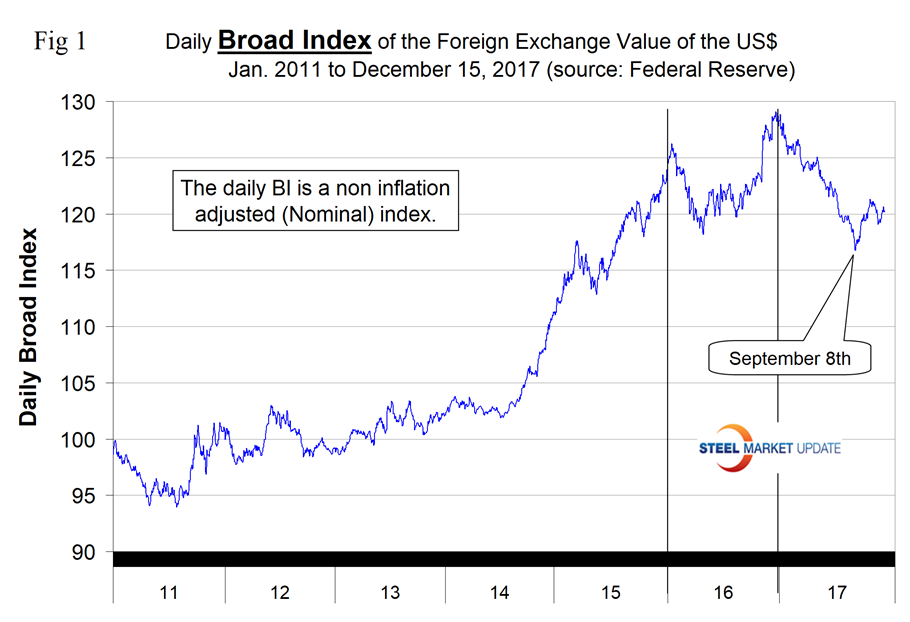
From Jan. 3 through Sept. 8, 2017, the Broad Index value of the U.S. dollar depreciated by 9.3 percent. The value rebounded by 2.97 percent from Sept. 9 through Dec. 15.
Please see the end of this report for an explanation of data sources. The analysis of currency trends is a highly technical undertaking; therefore, in this monthly SMU update, we incorporate the opinions of outside analysts to add color to our own data analysis.
On Dec. 13, the Fed as expected raised interest rates for the third time this year. Currency analyst Dean Popplewell had this to say: “On Wednesday, the Federal Reserve raised rates a quarter-point, the third such move in 2017. This raised the benchmark rate to a range between 1.25% and 1.50%. The Fed statement was optimistic about the economy, noting that the labor market “remained strong.” It also lowered its unemployment forecast in 2018 from 4.1% to 3.9%, and revised growth for 2018 from 2.1% to 2.5%. Despite this rosy prognosis, the dollar was broadly down after the announcement. Why? One reason is the sore point in the economy – inflation. The Fed has not changed its September forecast for rate hikes next year, with the Fed dot plot indicating that three rate hikes are projected for 2018. This disappointed some investors who would like to see four increases next year. In addition, the rate statement said that the Fed did not expect the tax reform legislation to have any long-term effect on the economy, contradicting White House claims that the legislation would trigger substantial economic growth.”
The Broad Index value of the U.S. dollar is reported several days in arrears by the Federal Reserve; the latest value published was for Dec. 15. Figure 1 shows the index value since January 2011. The dollar had a recent peak of 128.96 on Jan. 3, which was the highest value since July 4, 2004, almost 15 years. The recent low point was Sept. 8 at 116.74. Since then, the dollar has recovered to 120.22 on Dec. 15, almost exactly the same as our last update on Nov. 17 when the index value was 120.10.
Each month, we publish an update of Table 1, which shows the value of the U.S. dollar against the currencies of 16 major global steel and iron ore trading nations.
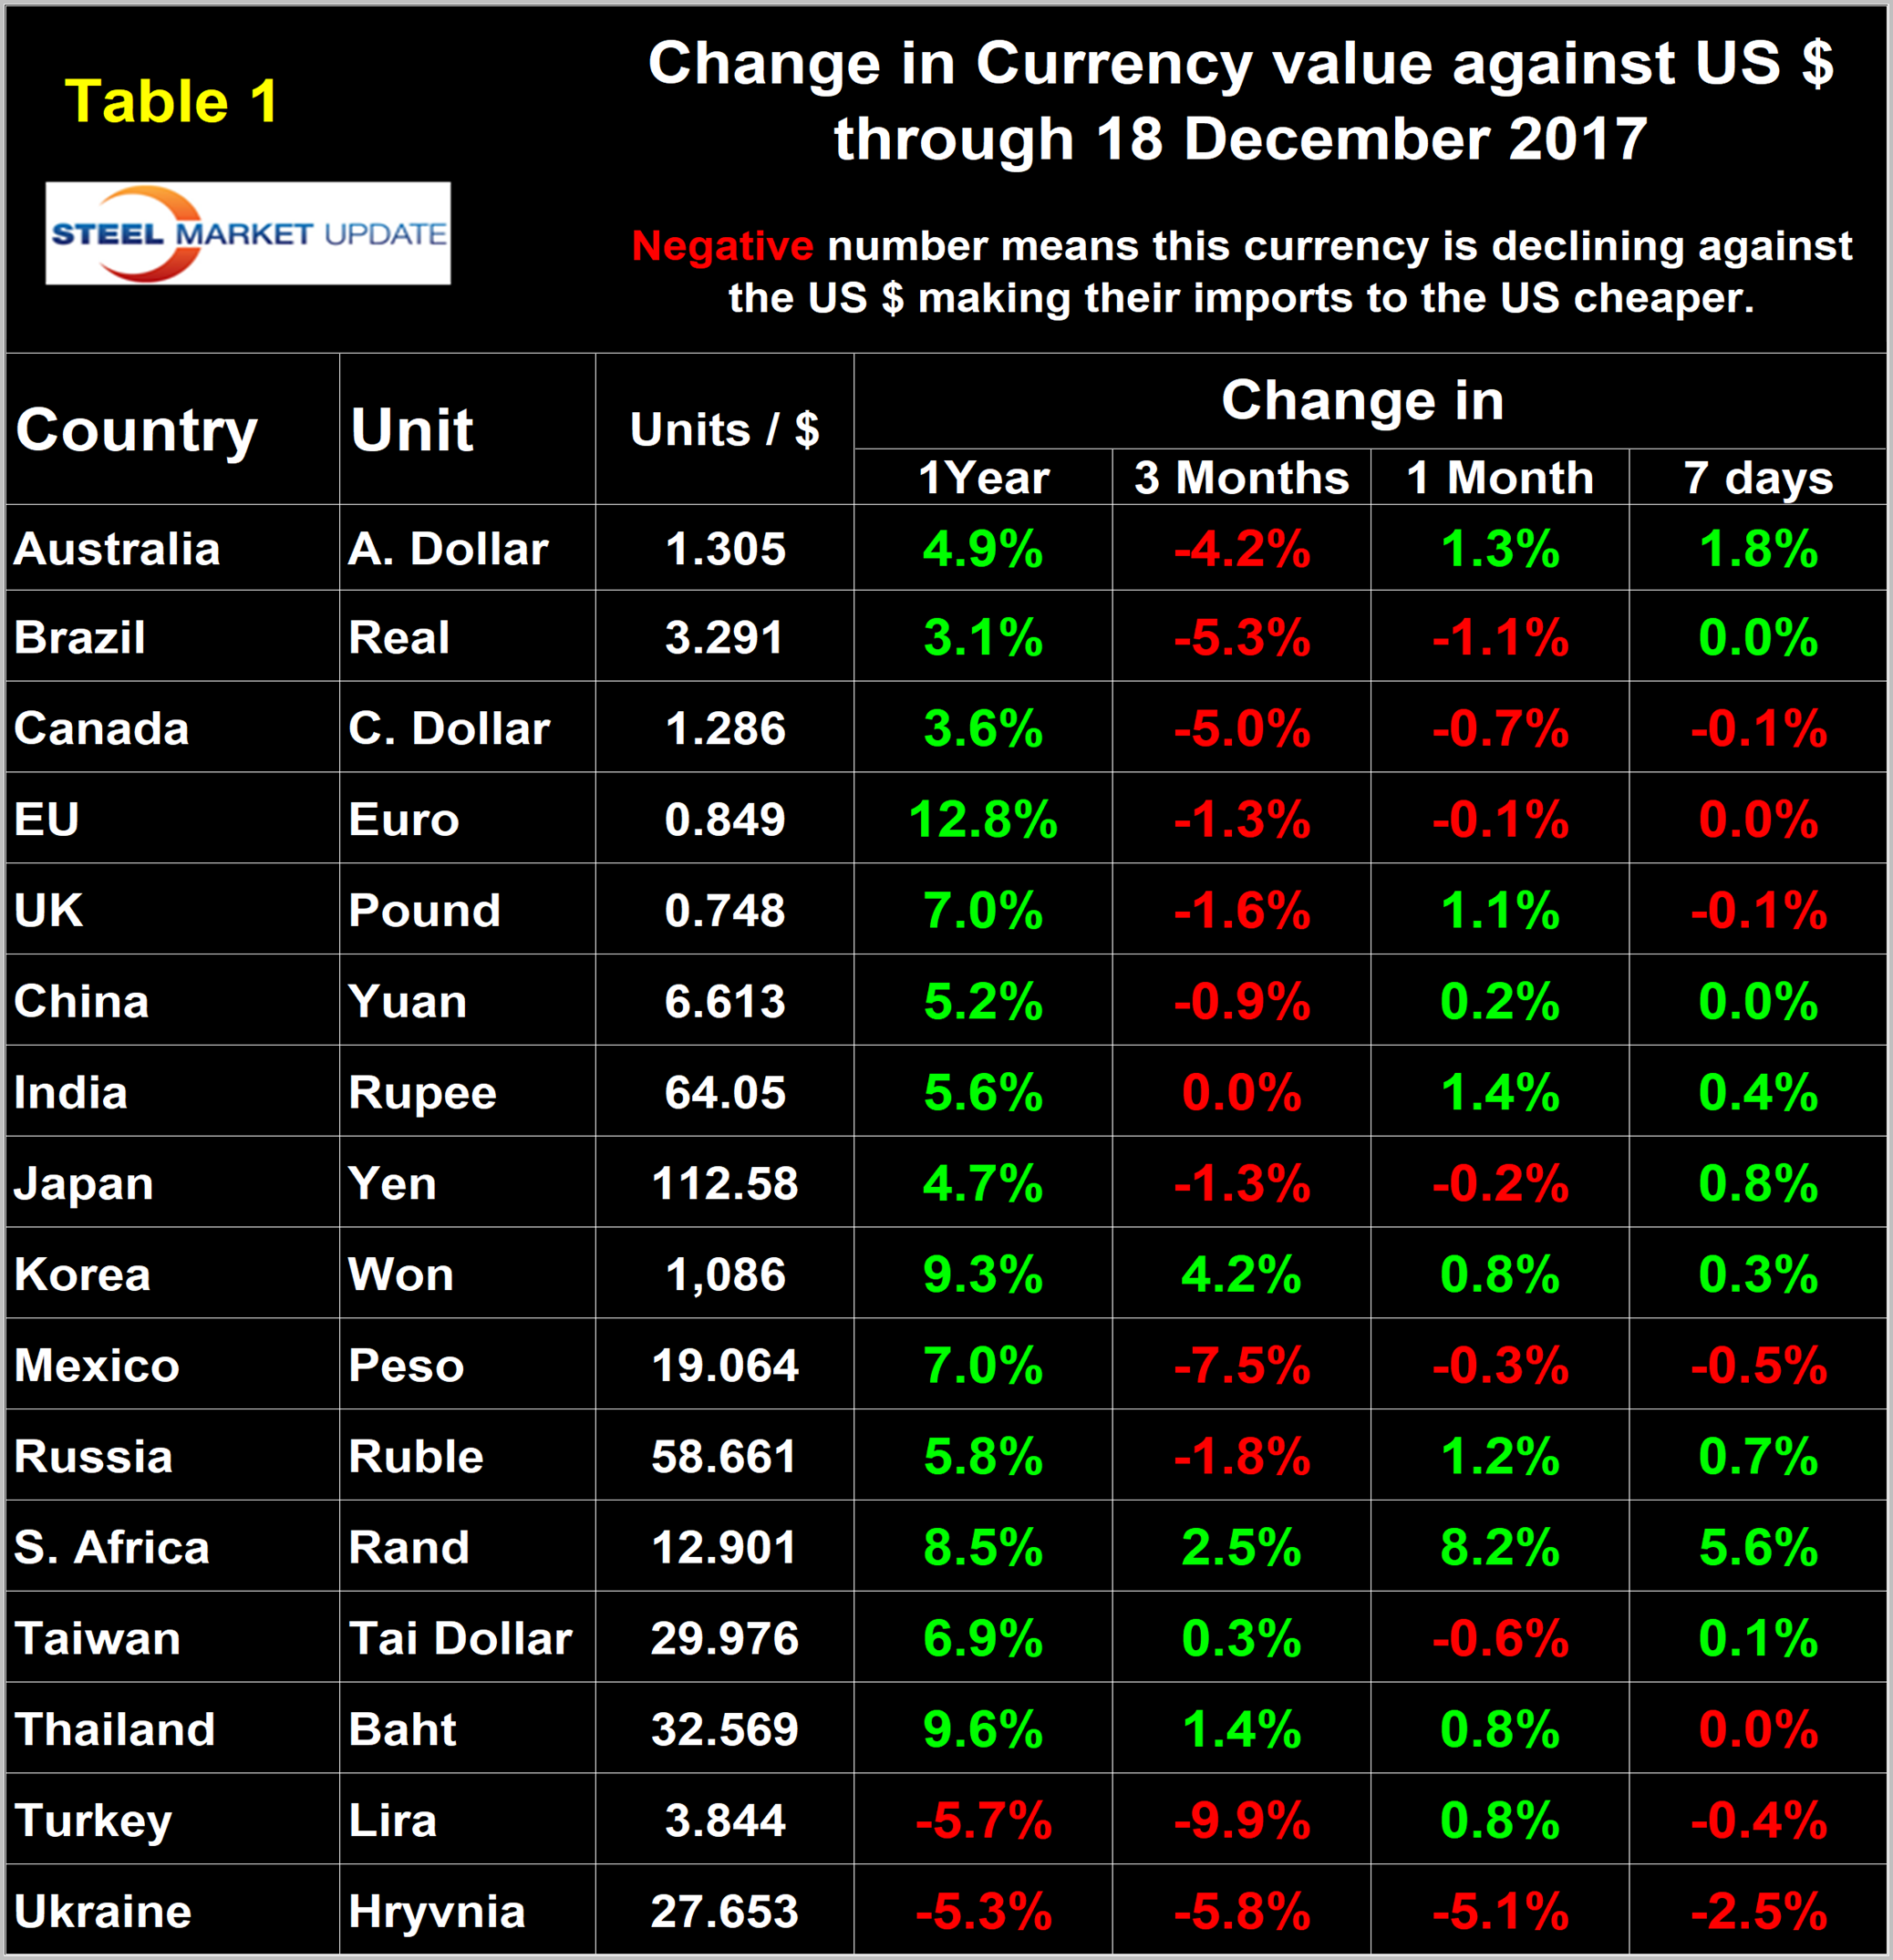
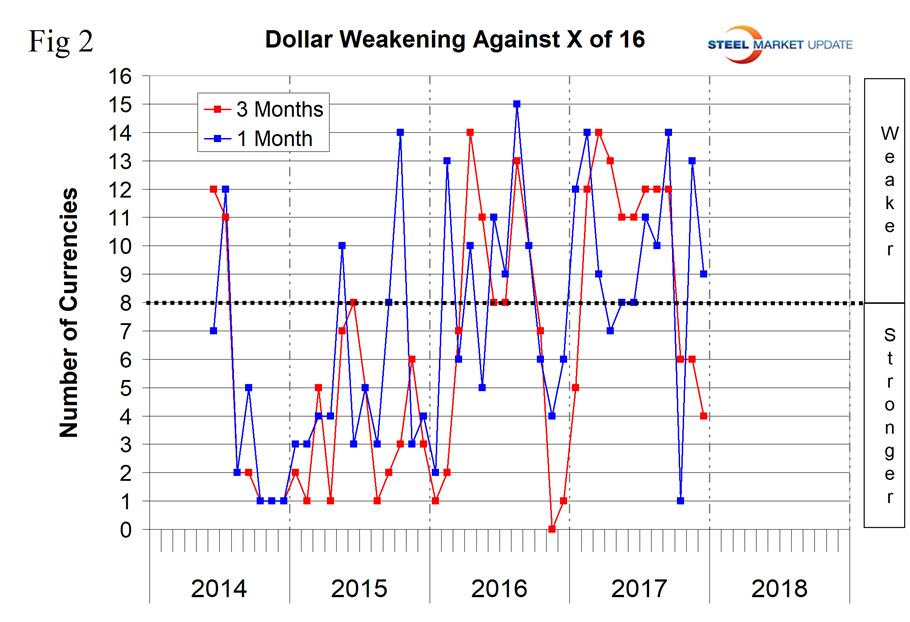
The table shows the change in value in one year, three months, one month and seven days. Figure 2 gives a longer range perspective and shows the extreme gyrations that have occurred in the last three years. Figure 2 shows that the dollar strengthened against seven of the 16 in the last month and against 12 of the 16 in the last three months. Quite often the change in value of these 16 currencies does not accord with the broad index, and this is one of those times.
A rising dollar puts downward pressure on all commodity prices that are greenback denominated. Table 1 is color coded to indicate strengthening of the dollar in red and weakening in green. We regard strengthening of the U.S. dollar as negative and weakening as positive because of the effect on the trade balance of all commodities and also of the total national trade deficit.
In each of these reports, we comment on several of the 16 steel and iron ore trading currencies listed in Table 1, and over a period of several months will describe the history of all of them. Charts for each of the 16 currencies through Dec. 18 are available for any premium subscriber who requests them.
Occasionally, we report on Bitcoin because this seems to be a poorly understood phenomenon. We have no idea where it might lead, but believe we should keep it on our radar screen. Recently, we came across a statement that made sense: “Bitcoin is the internet of value.” We remember 20 years ago when those in the know said the internet would change everything and the rest of us didn’t comprehend what was about to happen. As we understand it, Bitcoin is a peer-to-peer value transfer mechanism that is floating out there in cyberspace with no regulation and no knowledge of its creator. This is not good for banks as it cuts them out of the value exchange between buyer and seller. The Times of London recently reported: “The rise in Bitcoin’s value has surpassed the tulip mania of the 17th century. In the 1630s, the price of some bulbs soared to astronomical levels before crashing in 1637. The value of Bitcoin has risen faster in the last three years than the price of tulips did in the three years before the crash.” The prevailing wisdom is that Bitcoin is a bubble. We at SMU would not be at all surprised if that view turned out to be wrong. On Dec. 18, Bitcoin had a value of $18,868, up from $927 in February when this writer’s computer was hijacked with a demand for three bitcoins to purchase the key to unencrypt our files. This month, we came across what we regard as a well-balanced review of Bitcoin’s present status and prospects. Click this link if you would like a better appreciation.
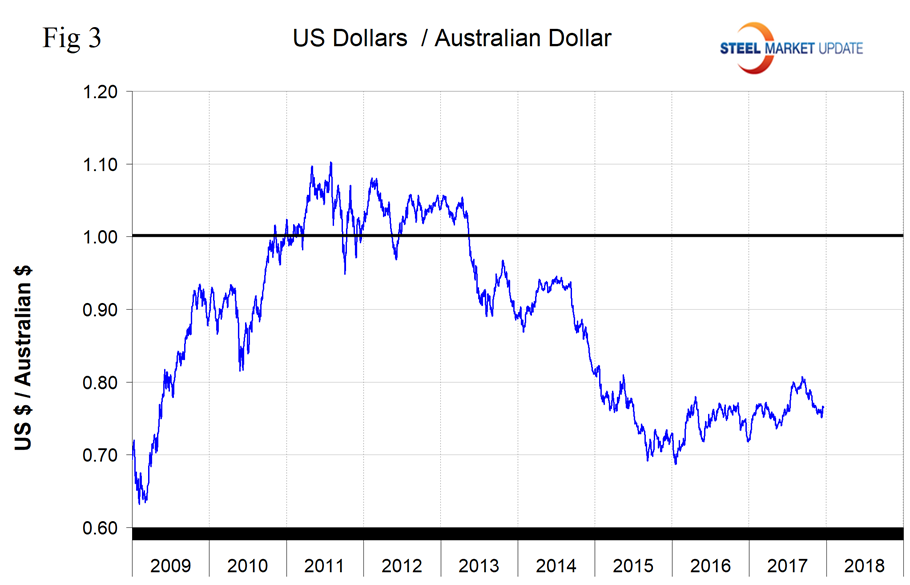
The Australian Dollar: In the last three months, the Australian dollar has depreciated by 4.2 percent against the U.S. dollar, but has recovered by 1.8 percent in the last seven days (Figure 3). On Dec. 17, Mark Chandler, a currency analyst, wrote: “Australia reported strong employment data for November. The 61.6k jobs created were three times more than expected. Employment grew nearly 42k full-time positions after a revised 31k in October (from 24.3k). The participation rate jumped to 65.5%, but the unemployment rate was unchanged at 5.4%. Australian interest rates jumped on the news. Although Aussie two-year rates had dipped below similar U.S. rates, that is not the case. A 9-10 bp premium is back in place. The Australian dollar’s advancing streak is extending for a fourth session. The next target is the $0.7700-$0.7740.”
The Euro: The euro has depreciated by 1.3 percent in the last three months. Figure 4 shows the value of the euro in U.S. dollars since its inception in 1999.
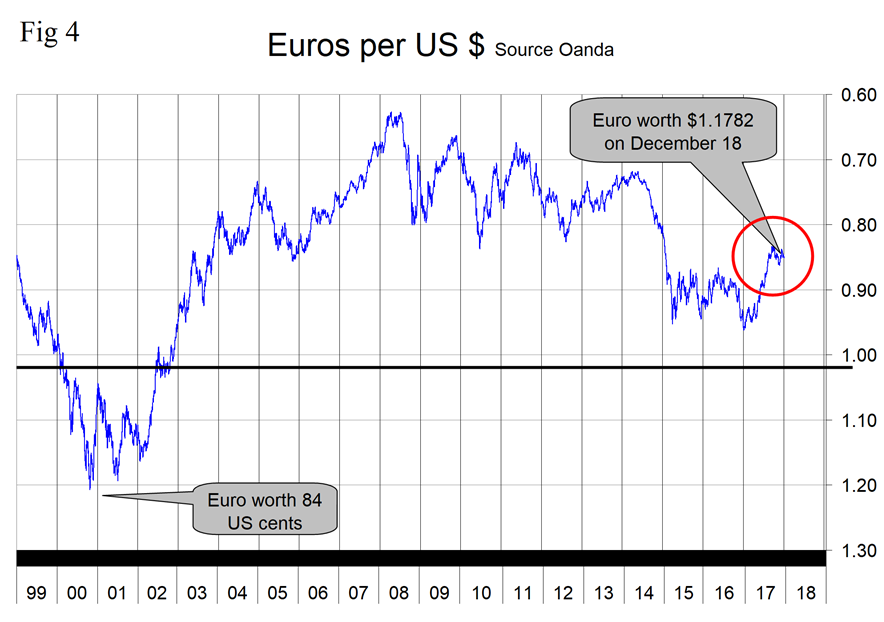
On Dec. 18, the euro was worth 1.1782 U.S. dollars. On Dec. 17, currency analyst Kenny Fisher wrote: “The euro has steadied in the Friday session after losing ground on Thursday following the ECB rate announcement. Currently, EUR/USD is trading at 1.1796, up 0.15% on the day. After a busy week with rate announcements from the Federal and the ECB, Friday is a light day. The sole euro-zone event, Trade Balance, looked weak as the trade surplus fell to EUR 19.0 billion, well off the estimate of EUR 24.4 billion. This marked a 3-month low. With the markets expecting the ECB to maintain rates at a flat 0.00%, investors were more interested in follow-up comments from ECB President Mario Draghi. In his press conference, Draghi sounded optimistic about economic conditions in the euro-zone, noting that ECB projections were ‘going in the right direction.’ Still, there was a caveat, as Draghi added that ‘an ample degree of monetary stimulus remains necessary.’ The ECB raised its forecasts for growth and inflation, but this clearly wasn’t enough to coax the cautious Draghi to signal another taper of the Bank’s ultra-loose stimulus program. Some policy makers favored signaling a change in policy if inflation continues to move higher, but the majority favored staying the course, which means the ECB will continue buying bonds till September 2018 (or later) and will keep interest rates at record lows even lower.”
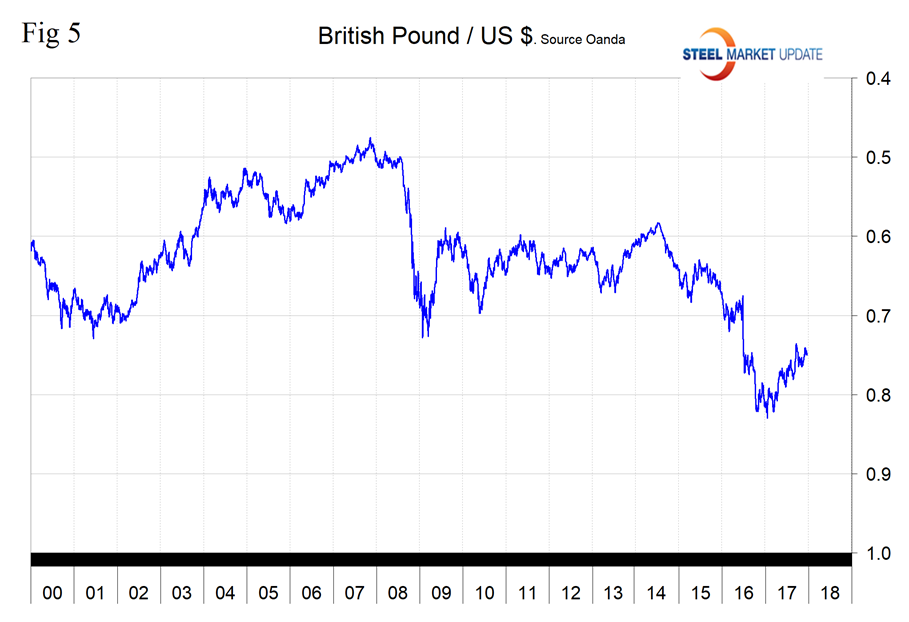
The UK Pound: Figure 5 shows the relationship between the UK pound and the U.S. dollar. On Dec. 18, the pound was worth 1.3366 U.S. dollars and has risen by 8.25 percent since Jan. 1, 2017. In this writer’s opinion, the future of the pound is dismal as the prospects of a soft Brexit evaporate. The UK was the 13th highest volume importer of steel products into the U.S in the 11 months through November 2017.
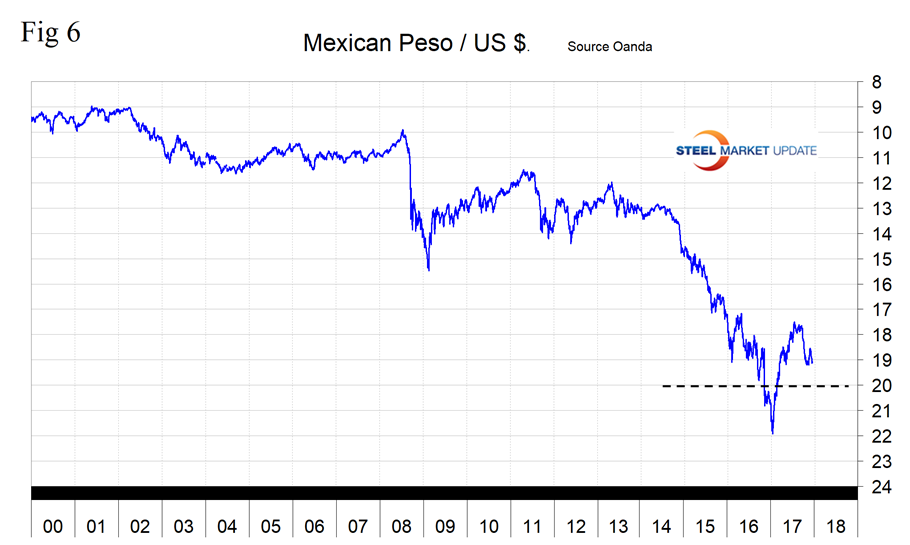
The Mexican Peso: Figure 6 shows the relationship between the peso and the U.S. dollar. The peso has declined by 7.5 percent in the last three months as the Canadian dollar has declined by 5.0 percent. Both these currencies are being negatively impacted by the NAFTA negotiations. Mexico was the 5th highest volume importer of steel products into the U.S in the 11 months through November 2017. Canada had the highest volume.
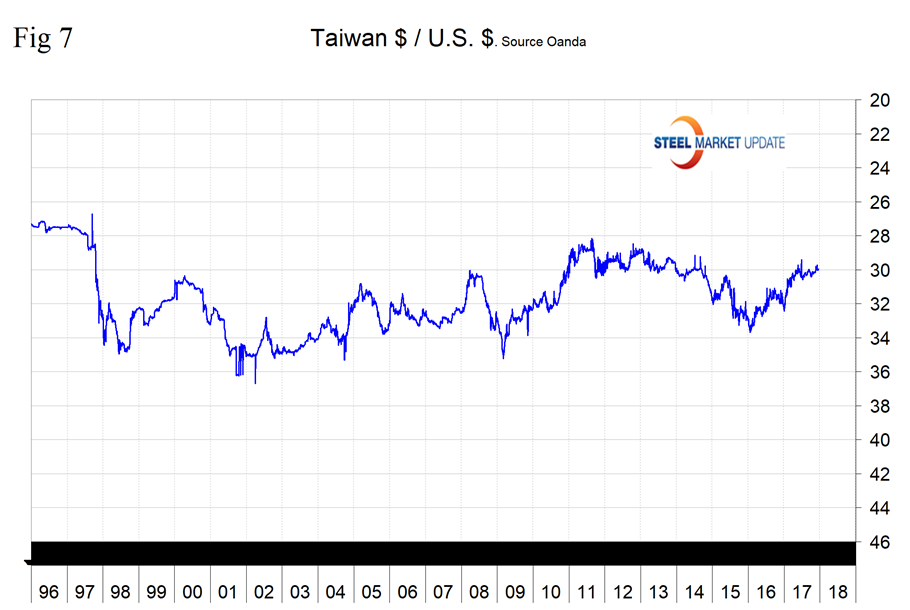
The Taiwanese Dollar: Figure 7 shows the relationship between the Tai dollar and the U.S. dollar. The Tai dollar was one of only four of the steel trading nations’ currencies to strengthen in the last three months, moving up by 0.3 percent. Taiwan was the 8th highest volume importer of steel products into the U.S in the 11 months through November 2017.
Explanation of Data Sources: The broad index is published by the Federal Reserve on both a daily and monthly basis. It is a weighted average of the foreign exchange values of the U.S. dollar against the currencies of a large group of major U.S. trading partners. The index weights, which change over time, are derived from U.S. export shares and from U.S. and foreign import shares. The data are noon buying rates in New York for cable transfers payable in the listed currencies. At SMU, we use the historical exchange rates published in the Oanda Forex trading platform to track the currency value of the U.S. dollar against that of 16 steel and iron ore trading nations. Oanda operates within the guidelines of six major regulatory authorities around the world and provides access to over 70 currency pairs. Approximately $4 trillion U.S. dollars are traded every day on foreign exchange markets.


