

Market Data

January 26, 2018
Q1 Jobs Data Shows Pacific Region Tops in Total Employment
Written by Peter Wright
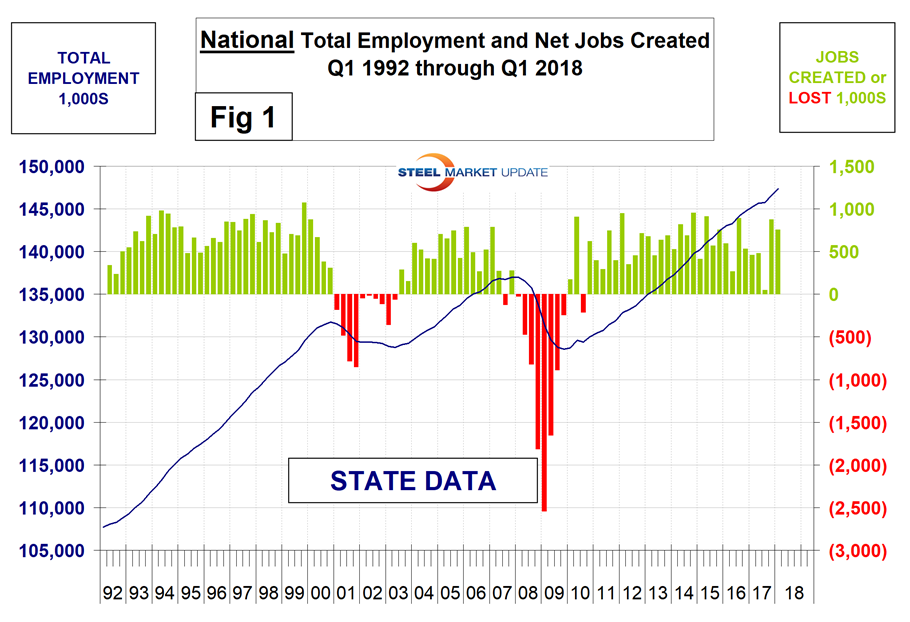
In Q4 2017, the Pacific pulled ahead of the East North Central region in total employment and held onto that lead in Q1 2018, according to Steel Market Update’s latest analysis of government employment data.
First-quarter employment data by state was released by the Bureau of Labor Statistics (BLS) on Friday. Economy.com summarized as follows: “As expected, there were signs of slowing job growth in the March regional and state employment report. Compared with February, nonfarm employment rose, and unemployment fell in fewer states, though these trends have more to do with supply constraints and a lack of qualified workers than weak demand for labor. Many states have entered the mature phase of the business cycle where labor markets are at or beyond full employment. Hawaii once again had the lowest jobless rate, 2.1 percent, but rates in Maine (2.7 percent) and Kentucky (4 percent) set new series lows. Employment rose in just two states, Texas and Utah, while the biggest year-over-year gains occurred in Idaho and Utah (3.3 percent each), followed by Nevada (2.9 percent).
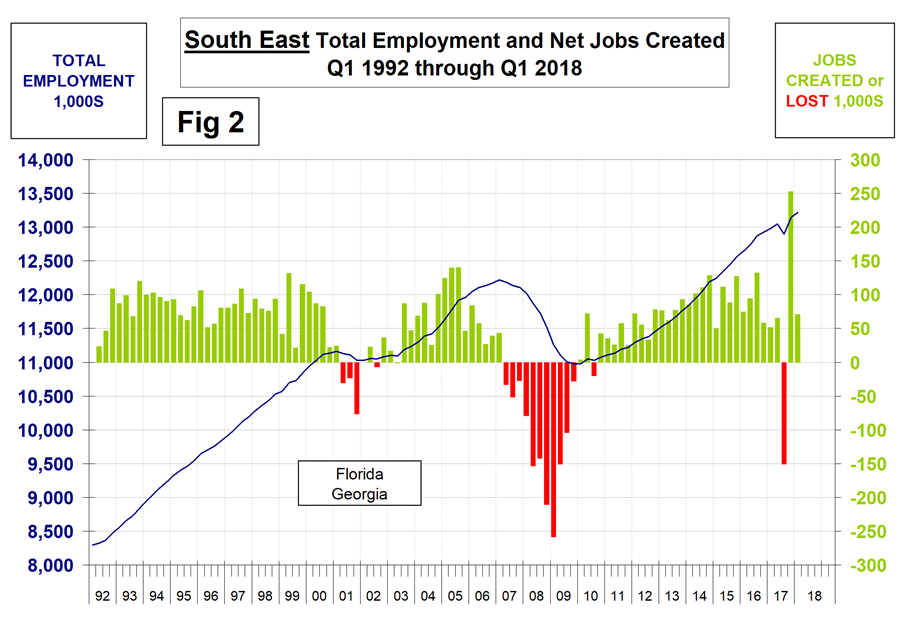
The states compile their employment numbers independently of the Feds, and then both are reported by the BLS. In the last 20 quarters since Q2 2013, the Feds reported total job creation of 12,548,000 and the states reported 12,329,000, a difference of just 1.8 percent. Our report covers only the lower 48 states; therefore, the federal and state totals are impressively close. Figure 1 shows the history of state totals since 1992 and Figure 2 shows the same format for the South East region. We chose to highlight the S.E. this quarter because revisions showed the hurricane-related job losses in Q3 last year to be even worse than previously realized. SMU has graphs in the same format for 10 geographic regions and can produce them for individual states on request.
The 10 geographic regions described in this report are:
New England, (CT, ME, MA, NH, RI, VT)
North East, (NY, PA, NJ)
Mid Atlantic, (DE, DC, MD, NC, SC, VA, WV)
North Central, (IA, KS, MN, MO, NE, ND and SD)
East North Central (IL, IN, MI, OH and WI)
East South Central, (AL, KY, MS and TN)
South Central, (TX, OK, LA and AR)
Mountain, (AZ, CO, ID, MT, NV, NM. UT, WY)
Pacific region, (CA, OR and WA)
South East, (FL, GA)
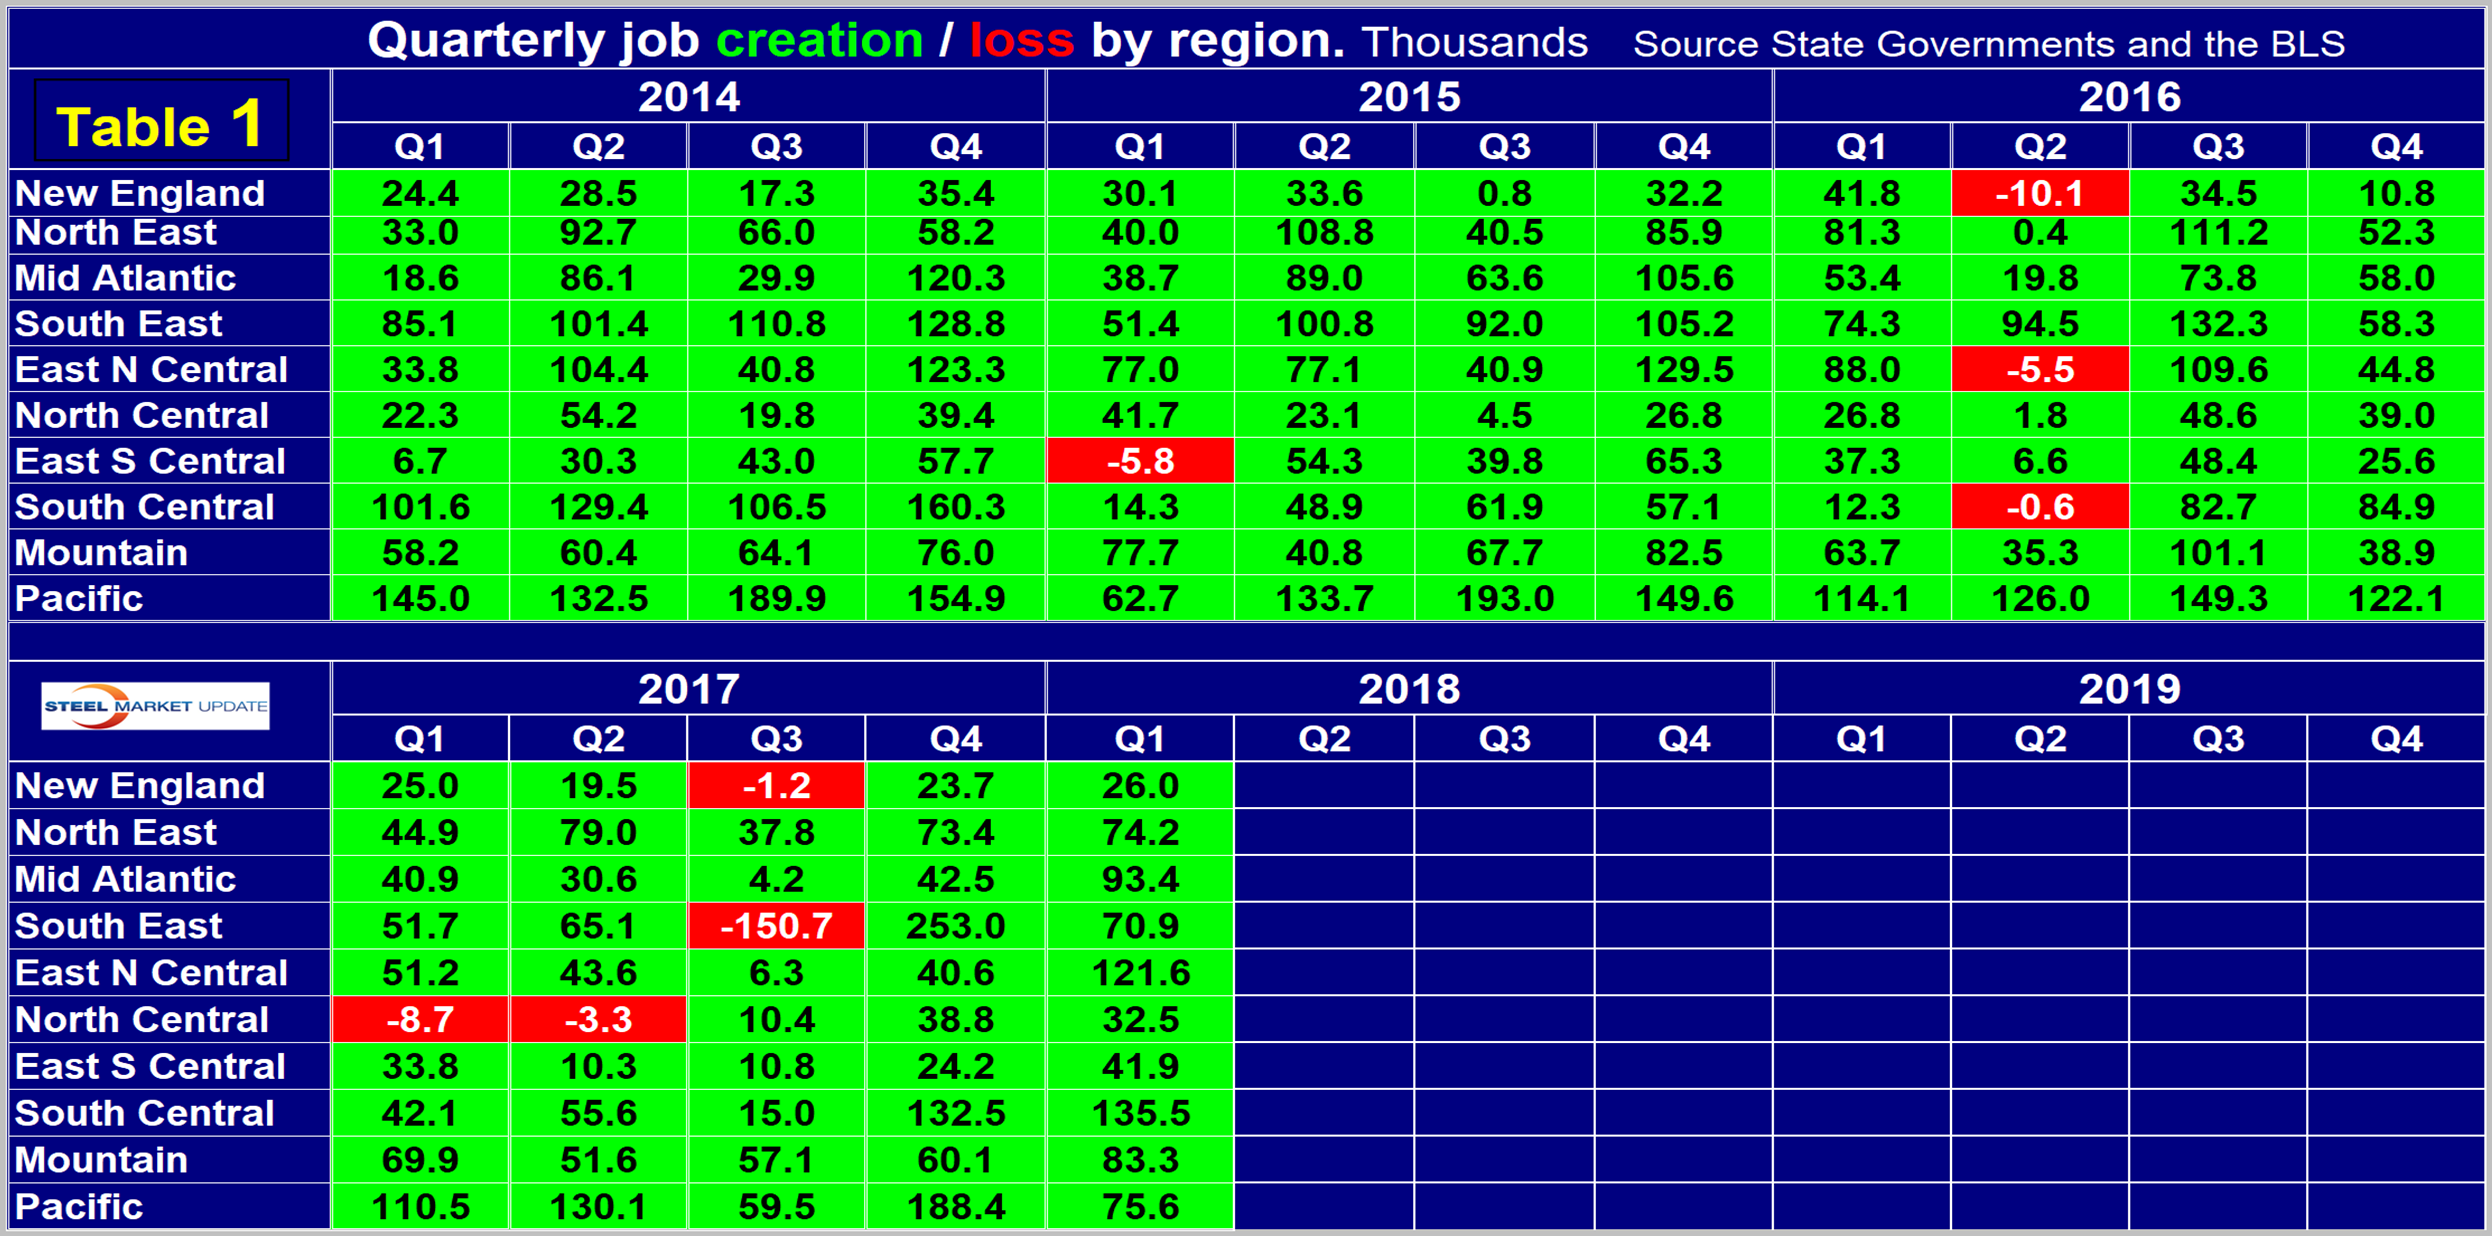
Table 1 (click to enlarge) shows the history of quarterly job creation by region since Q1 2014. In the fourth quarter of 2017, the South East had a terrific rebound that more than made up for the hurricane losses incurred in the third quarter. In Q1 2018, the South-Central region, led by Texas, created the most jobs, followed by the East North Central. Eight of the 10 regions had a higher rate of job growth in first-quarter 2018 than they did in Q4 2017, (the numbers are seasonally adjusted). All had a positive net gain in the last two quarters.
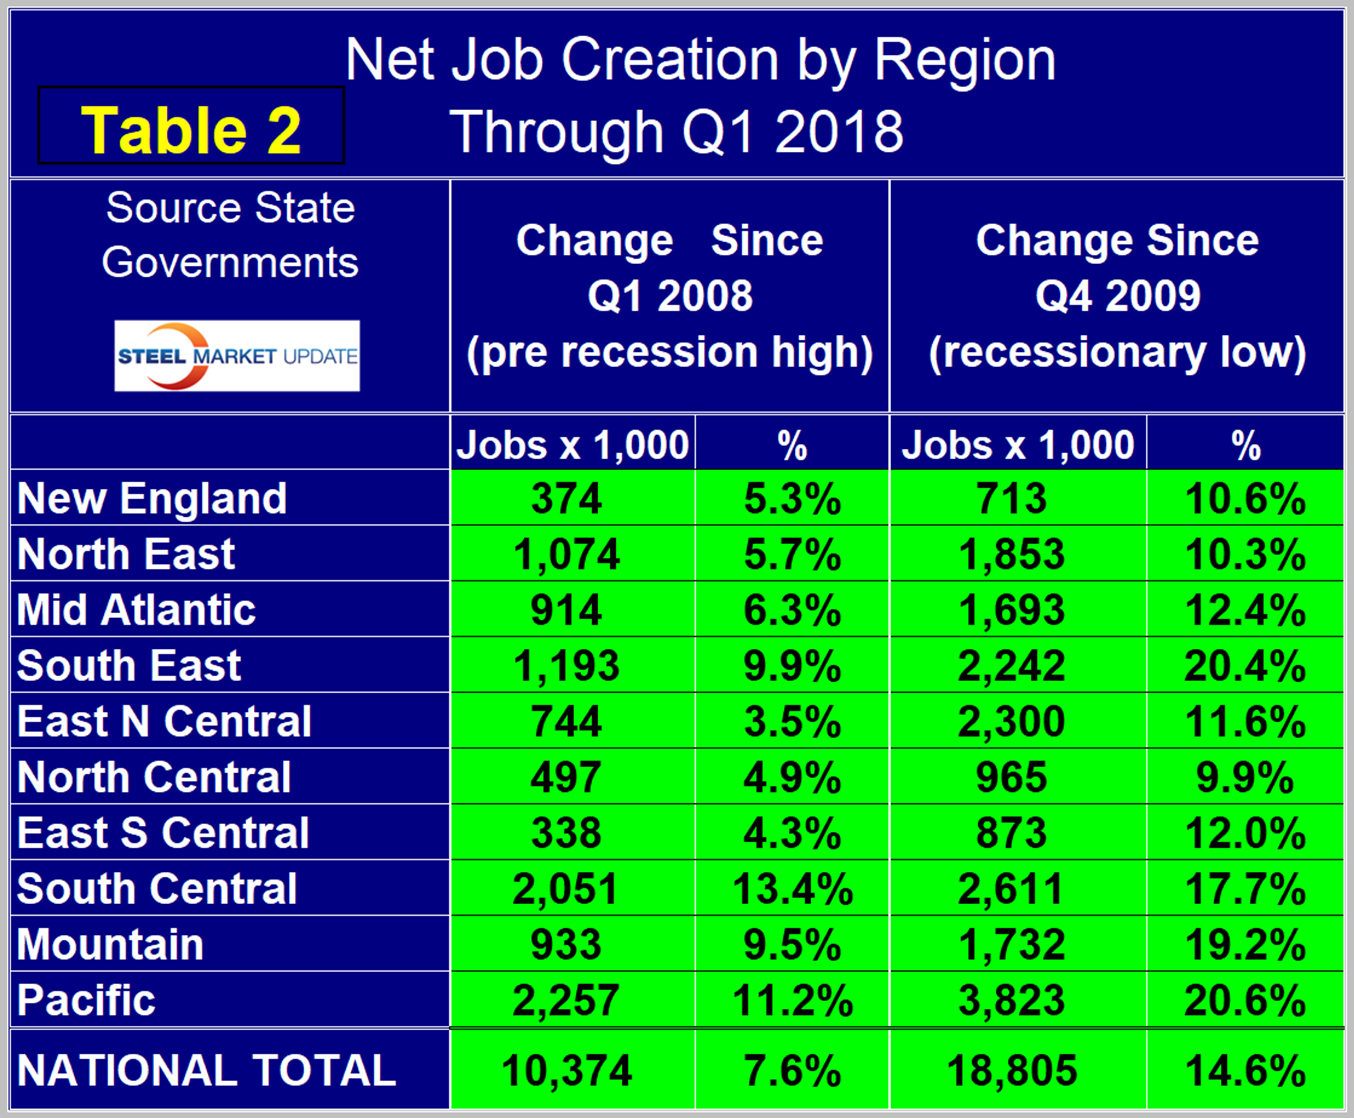
The regions have fared very differently since the pre-recession high of first-quarter 2008 and since the low point of fourth-quarter 2009. By the states’ calculations, there are now 10,347,000 more people employed than there were immediately before the recession, but of that number 41.5 percent occurred in the South Central and Pacific regions (Table 2).
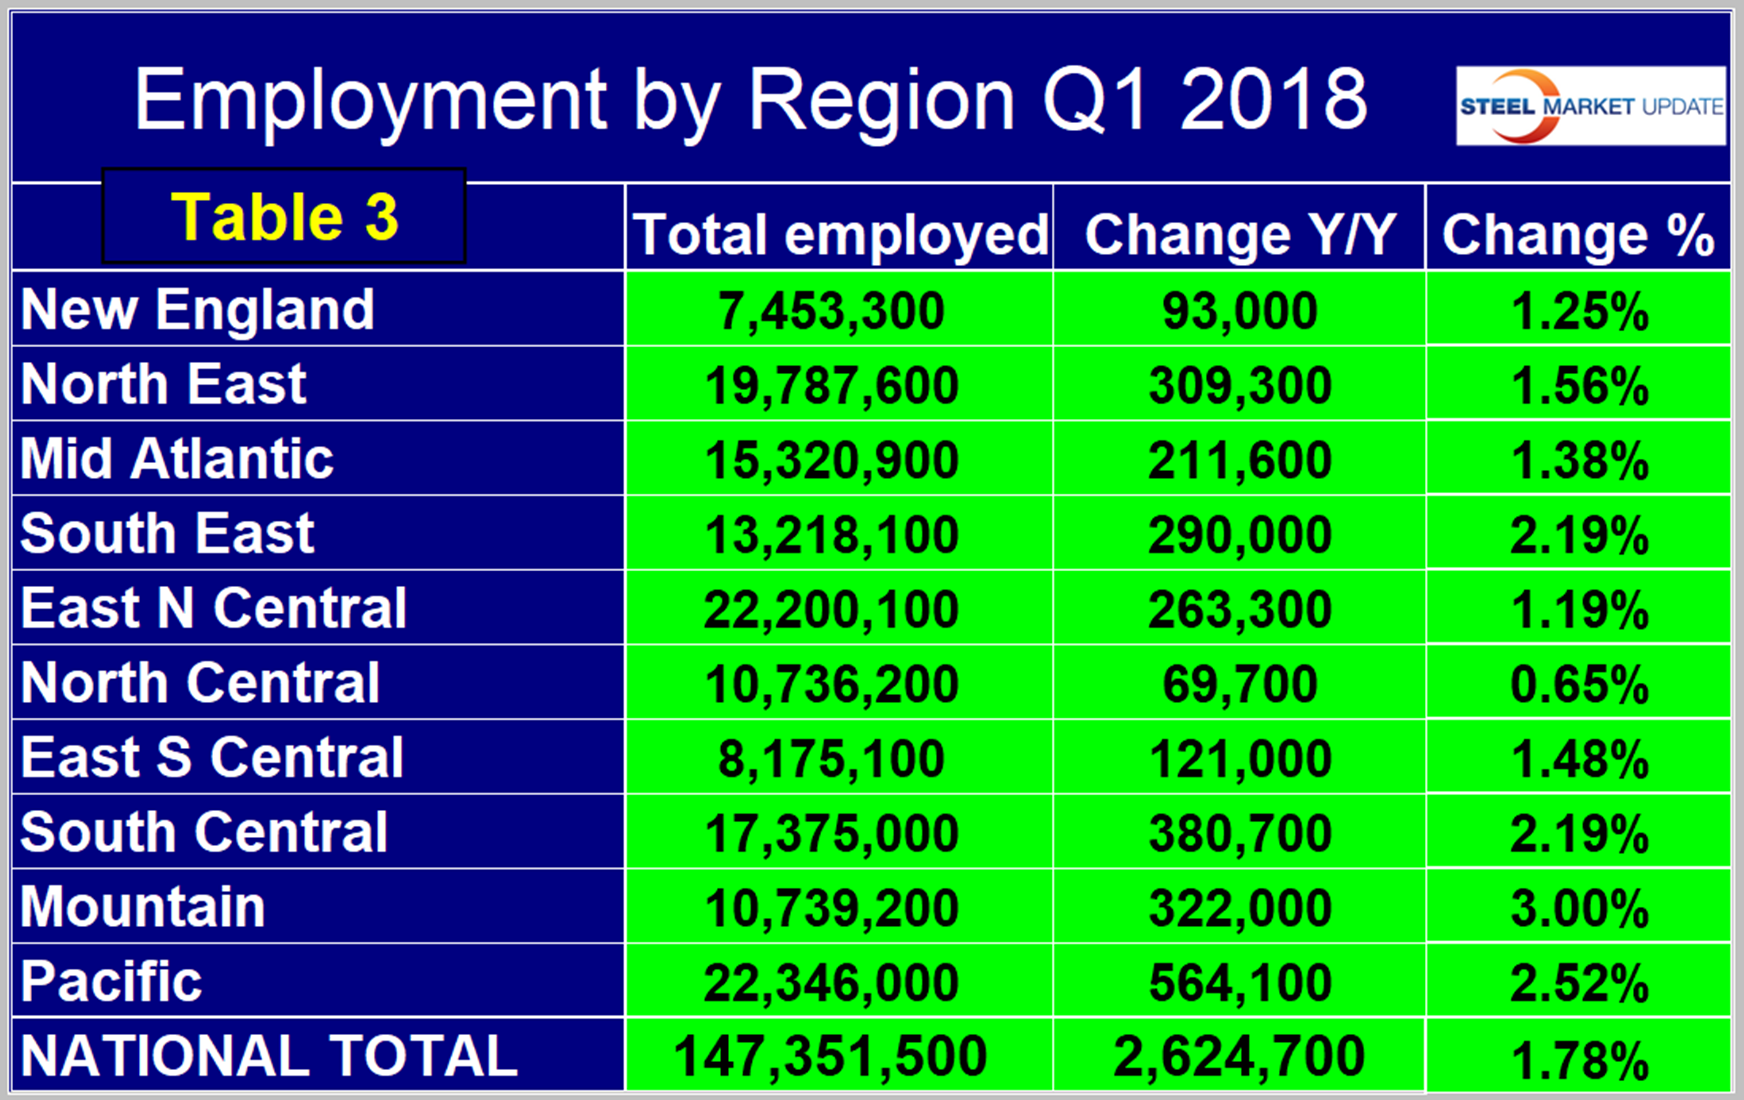
The third quarter of 2015 was the first time that every region had more people employed than it did at the pre-recession peak. The rate of job creation still varies widely across the country. In the last four quarters, the Mountain region has had the highest job growth at 3.0 percent and the North Central the lowest at 0.65 percent (Table 3).
SMU Comment: We believe it’s important for those subscribers whose businesses are substantially regional to have as much data as possible to compare their own results with those of their locality. This report, along with our quarterly report on regional GDP, is intended to help in that respect.


