

Market Data

January 30, 2018
Economic Indicators Pointing Up for First Half
Written by Peter Wright
Economic indicators are strong overall and portend well for the first half of 2018.
This report summarizes seven data sources that describe the state of manufacturing, construction, steel activity and the overall market in the United States. We have reported on most of these separately in our Steel Market Update publications, and therefore will be brief in this summary. We don’t expect these data sources to all point in the same direction. Our intent in summarizing them in one document is to provide a consensus of the state of this critical steel consumption sector. Based on American Iron and Steel Institute estimates of steel mill shipments by market classification, almost 50 percent of the steel consumed in the U.S. is manufacturing-oriented. This breaks down to about 27 percent in ground transportation including infrastructure, 9 percent in machinery and equipment, 5 percent in appliances, 4 percent in defense and about 4 percent in containers.
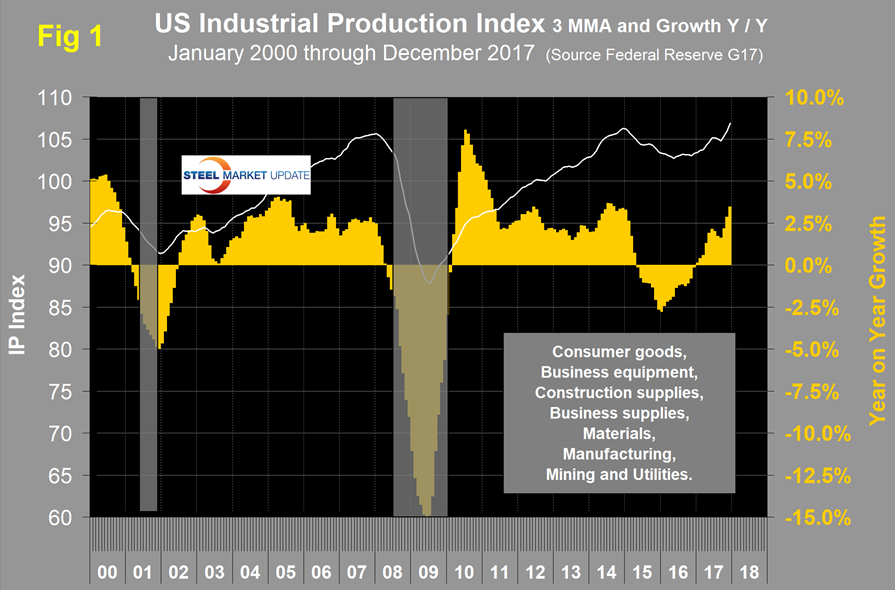
The Industrial Production Index
Figure 1 shows the IP index since January 2007 with the year-over-year growth. The three-month moving average (3MMA) had negative growth every month from October 2015 through December 2016 as shown by the brown bars in Figure 1. January 2017 was the first month of positive growth in the 3MMA since August 2015. Growth accelerated in each month, October, November and December. Economy.com reported: “Industrial production surprised to the upside in December, rising 0.9 percent, beating both the consensus forecast and our above-consensus projection. Utilities and mining logged the largest gains, and manufacturing also advanced. The change for November was revised downward, however. Overall capacity utilization rose 0.7 percentage points and that in manufacturing remained unchanged.” (Note, Economy.com is reporting month-over-month growth. The SMU comment above refers to year-over-year growth).
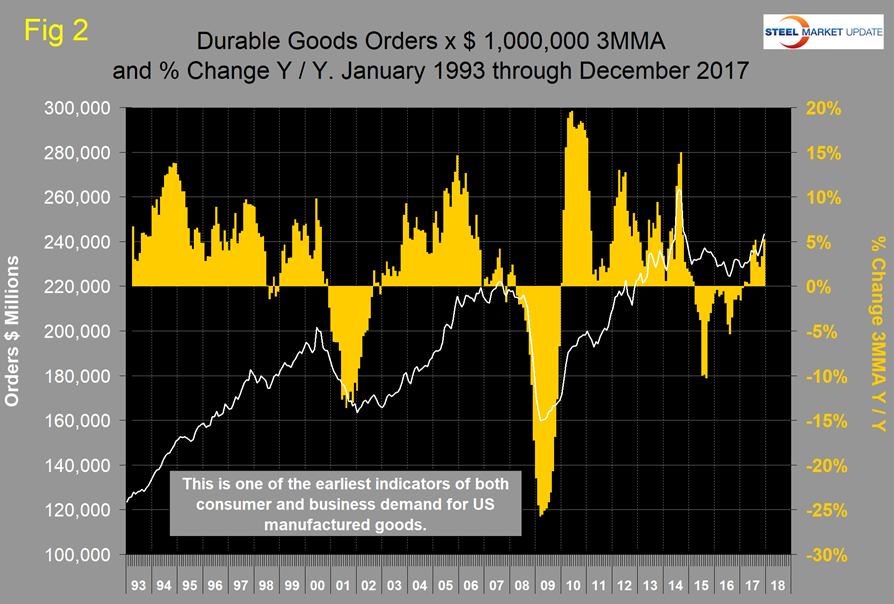
New Orders for Durable Goods
The U.S. Census Bureau announced last week that new orders for manufactured durable goods in December increased by $7.0 billion or 2.9 percent. Figure 2 shows the 3MMA of monthly orders for durable goods since January 2010 with the percent change year over year. March 2017 was the first month since April 2015 to have positive year-over-year growth. There has been an improving trend since August 2015 with a positive surge in the most recent data for June through December 2017.
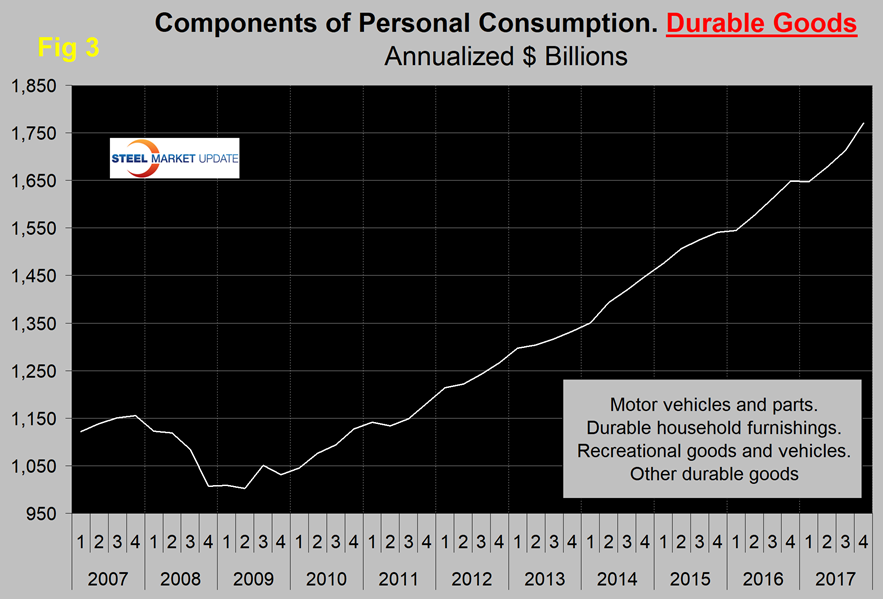
The Durable Goods Portion of GDP
The first estimate of Q4 GDP came in at 2.57 percent annualized growth, which was down from 3.16 percent in Q3. A subcomponent of the quarterly data is durable goods, which is part of the personal consumption calculation. It therefore contains no military hardware or civil aircraft data. This is shown in Figure 3 and, presumably because of the exclusions just mentioned, looks nothing like Figure 2. Except for one quarter, Q1 2017, the durable goods portion of GDP has had positive growth every quarter since Q2 2011.
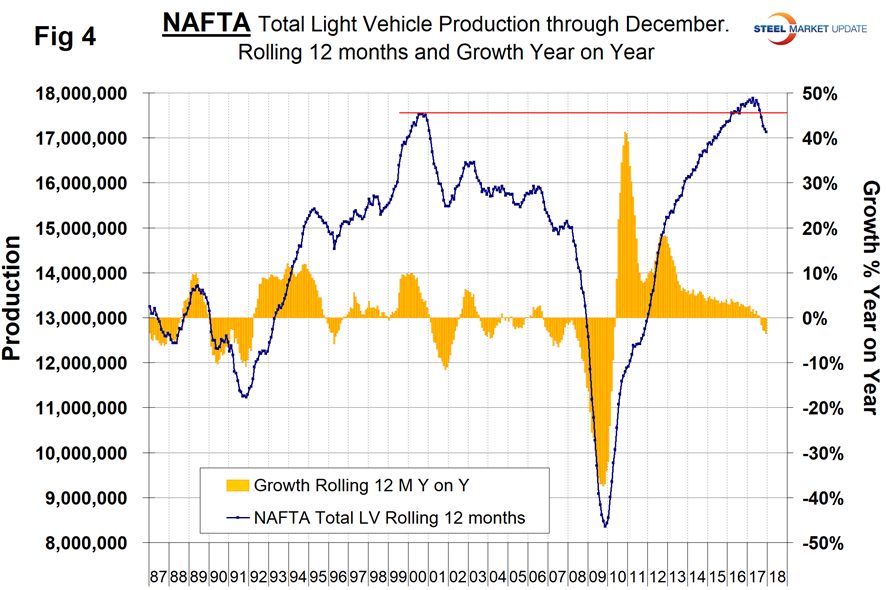
Light Vehicle Production in NAFTA
On a rolling 12-months basis year over year through December, light vehicle production in NAFTA decreased by 3.6 percent. Through December, growth declined for six straight months. These were the first months of contraction since May 2010. There has been a very gradual slowdown in growth for the last three years as indicated by the brown bars in Figure 4. The data source is Ward’s Automotive. We understand that the main hang-up in the NAFTA negotiations revolves around auto parts manufacture and final point of assembly. There is a huge movement of components and subassemblies in both directions across the southern border. Therefore, it is not known whether the Ward’s data exaggerates or deflates the national differentials.
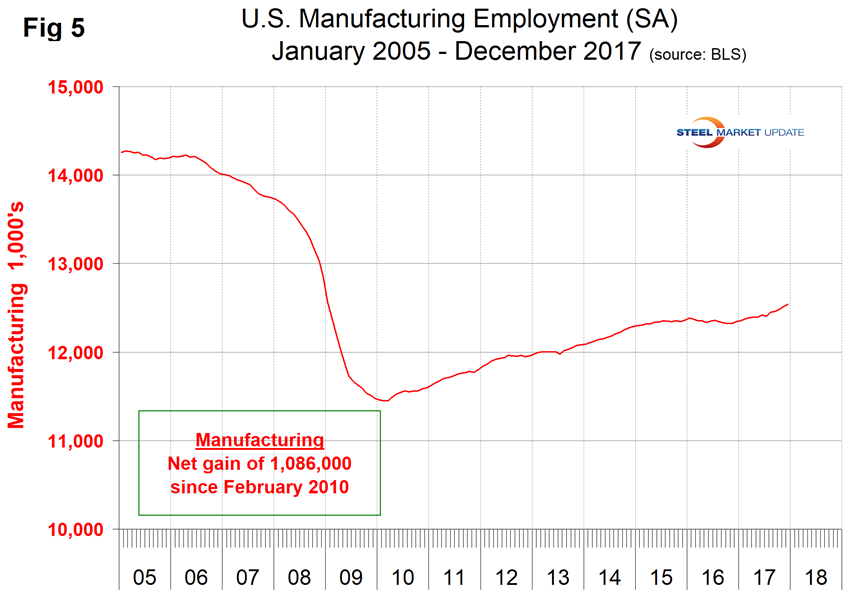
Manufacturing Employment
Manufacturing employment plummeted during the recession and gradually improved from the spring of 2010 through 2014. Growth was flat in 2015 and declined slightly in 2016 when 23,000 jobs were lost during the year as a whole. There was a turnaround in 2017 when 196,000 jobs were created, 79,000 of them in the fourth quarter alone (Figure 5). The motor vehicles and parts subcomponent of manufacturing employment lost 1,000 jobs in 2017.
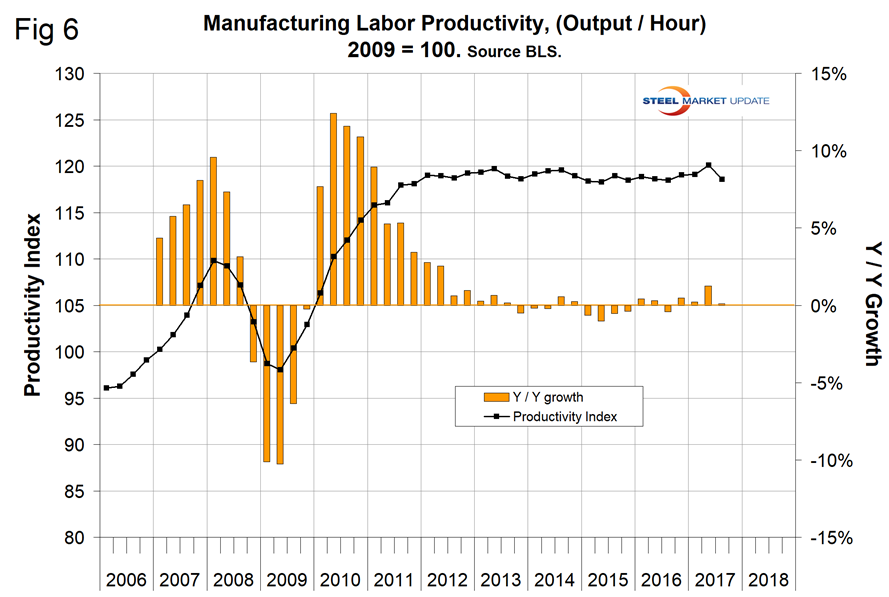
Manufacturing Productivity
The Bureau of Labor Statistics reported that in Q2 2017 manufacturing productivity improved by an upwardly revised 1.3 percent year over year (Figure 6). This was the highest growth rate since Q4 2012. In Q3 (latest data available), growth fell back to 0.1 percent, meaning that productivity is almost exactly where it was in Q3 2016.
The ISM Manufacturing Index
The Institute for Supply Management’s Manufacturing Index is a diffusion index. ISM states: “Diffusion indexes have the properties of leading indicators and are convenient summary measures showing the prevailing direction of change and the scope of change. An index value above 50 percent indicates that the manufacturing economy is generally expanding; below 50 percent indicates the opposite.” Figure 7 shows the 3MMA of the ISM index from January 1997 through December 2017 with an improving trend since January 2016. In October, the 3MMA of the index at 59.43 was the highest since April 2011, but fell back to 58.87 in December. Historically, the ISM Index is currently very strong.
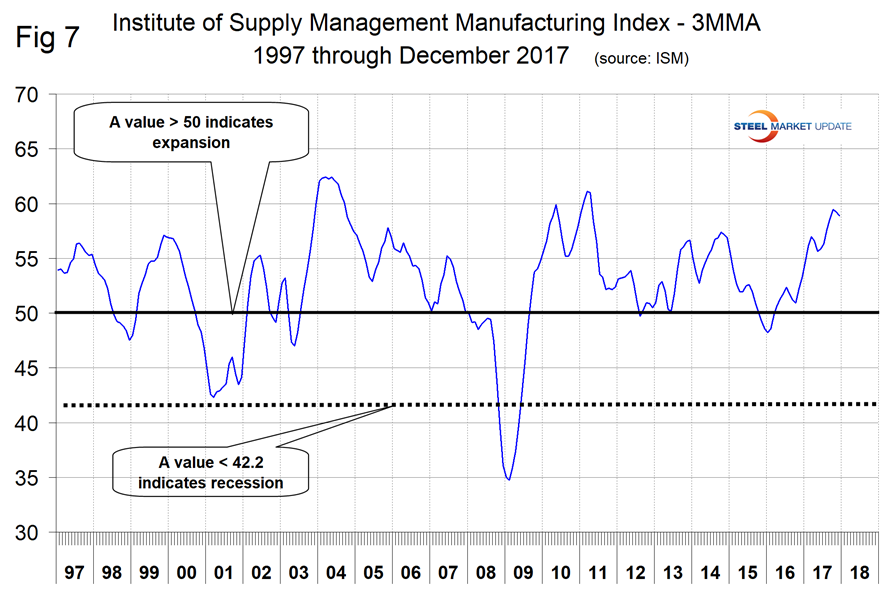
SMU Comment: The ISM index, to which we give the most credence, is at its strongest level since April 2011 and signaling expansion. Auto assemblies and supplier industries are slowing in NAFTA and the U.S. and Canada are losing share to Mexico. Manufacturing added 196,000 jobs in 2017 with a particularly strong fourth quarter, but there has been virtually no productivity improvement in the last four quarters. The industrial production index and new orders for durable goods have positive growth. On balance, these seven measures are positive and point to a strong first half for 2018.


