

Market Data

February 28, 2018
SMU Currency Analysis: Dollar’s Decline is Slowing
Written by Peter Wright
The decline in value of the U.S. dollar on the international exchange markets has slowed in the last 30 days, according to Steel Market Update’s latest analysis of currencies.
Please see the end of this report for an explanation of data sources. The analysis of currency trends is a highly technical undertaking. Therefore, in this monthly SMU update, we sometimes incorporate the opinions of other experts to add color to our own data analysis.
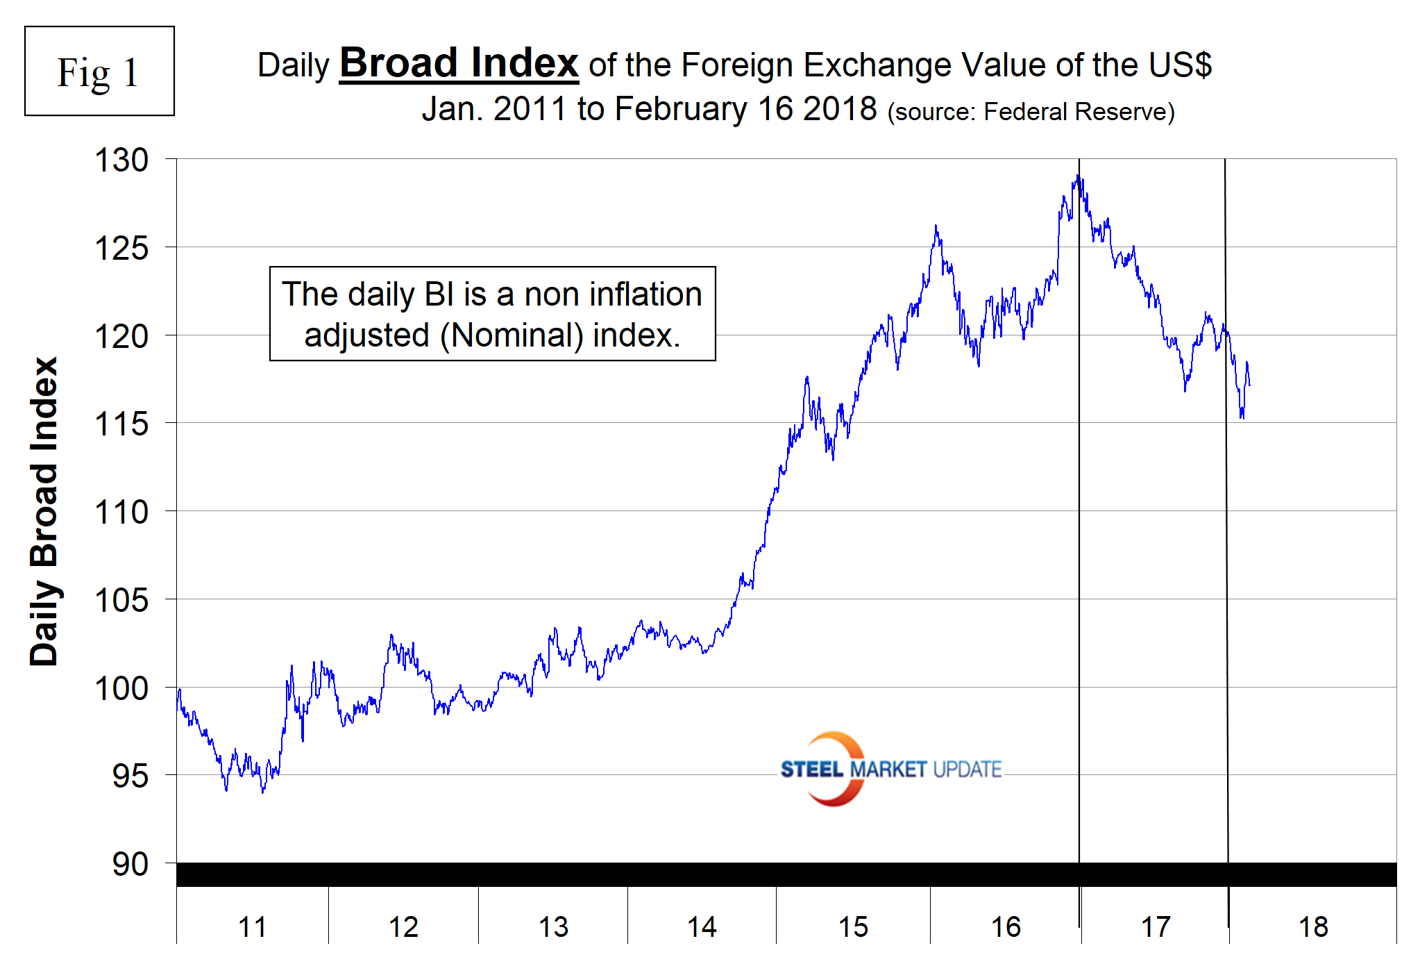
The Broad Index value of the U.S. dollar is reported several days in arrears by the Federal Reserve; the latest value published was for Feb 16. Figure 1 shows the index value since January 2011. The dollar had a recent peak of 128.96 on Jan. 3, 2017, which was the highest value in almost 15 years; the recent low point was the Feb. 1, 2018, at 115.21. Since then, the dollar recovered to 117.14 on Feb. 16. The dollar has declined by 7.5 percent in the last three months, but by only 0.1 percent in the last 30 days. Therefore, we conclude that at least for the present the decline is slowing.
Each month, SMU publishes an update of Table 1, which shows the value of the U.S. dollar against the currencies of 16 major global steel and iron ore trading nations. The table shows the change in value in one year, three months, one month and seven days through Feb. 23.
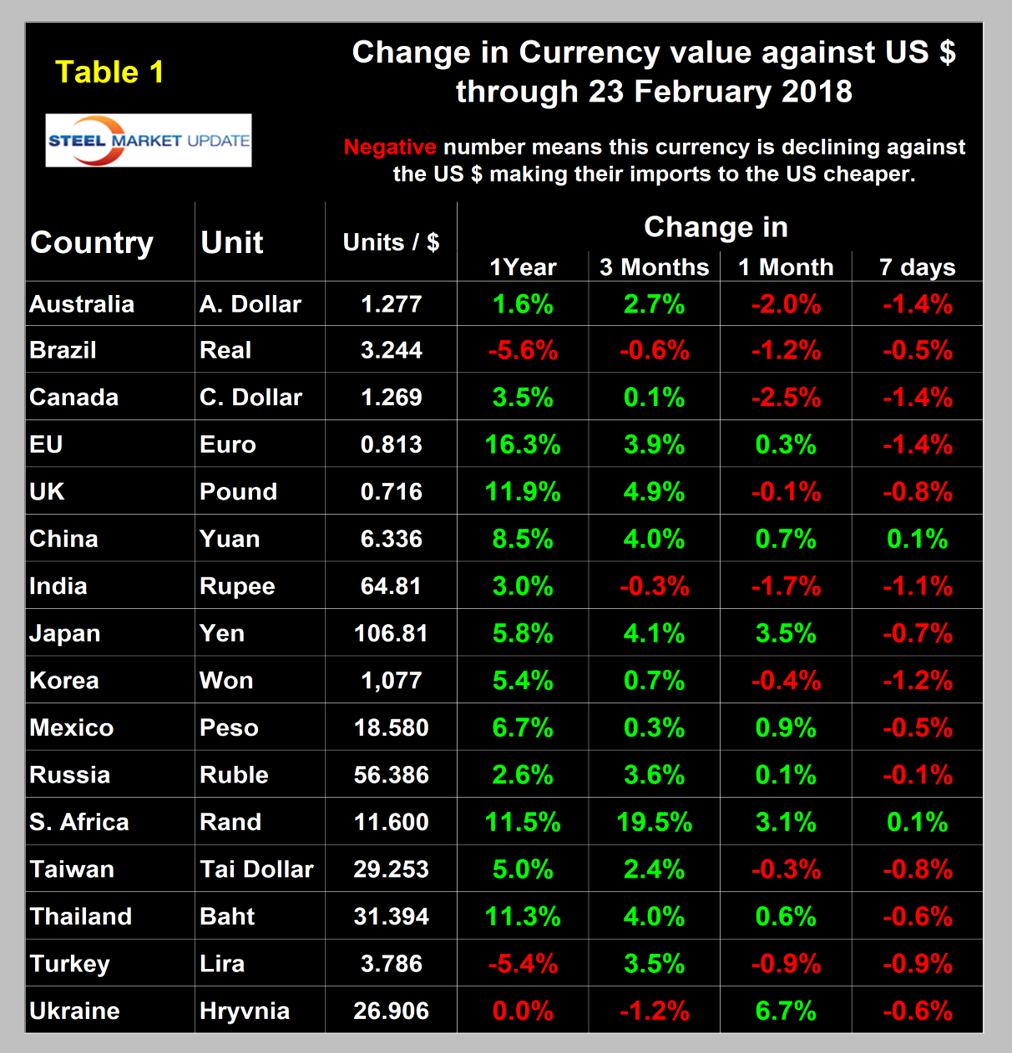
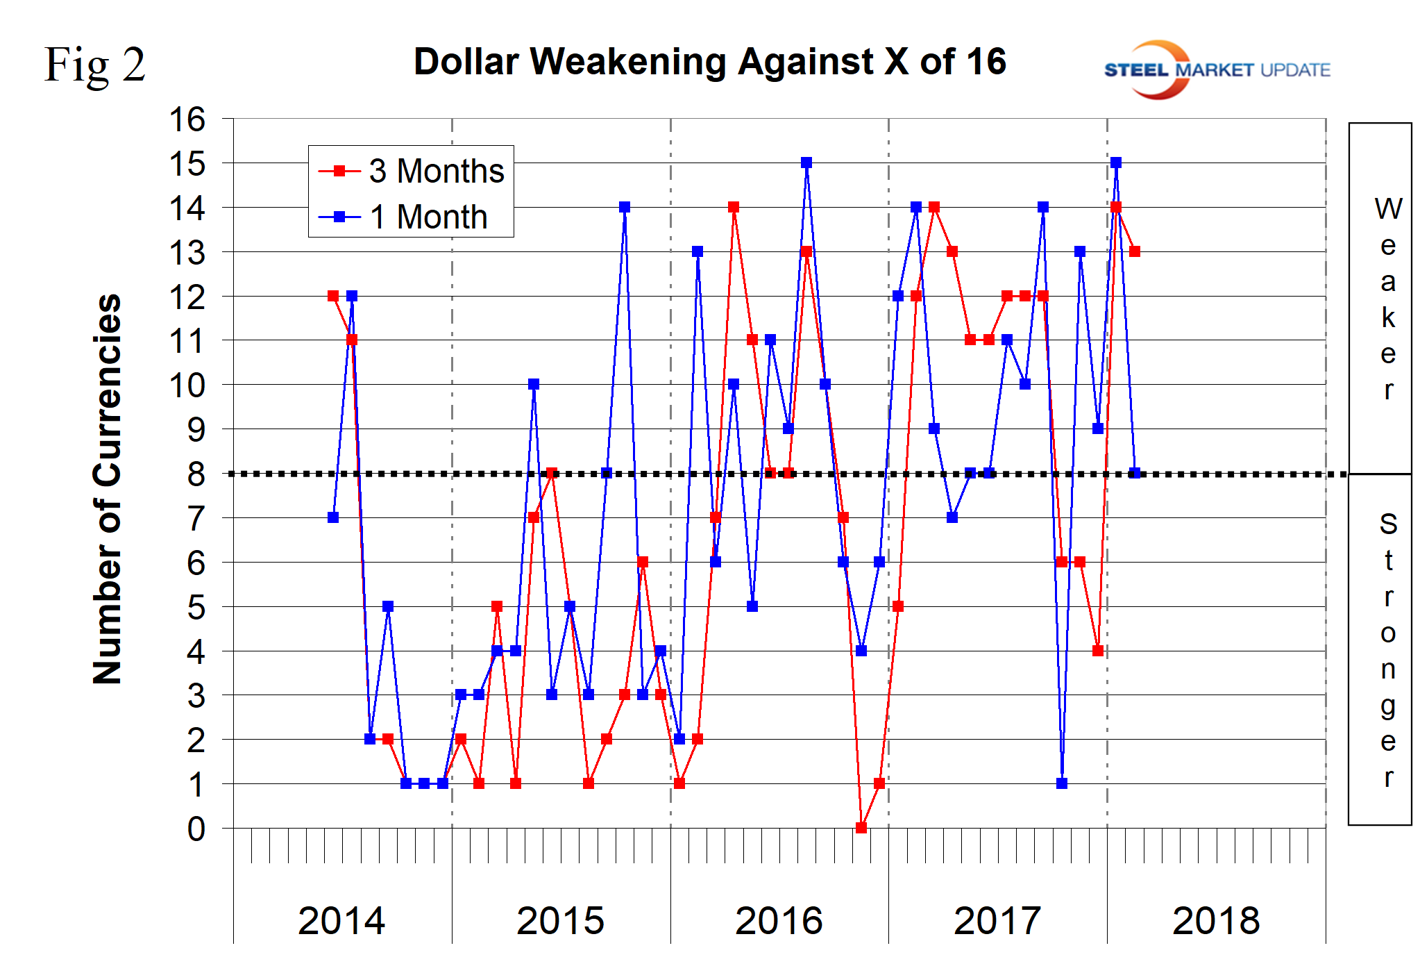
Figure 2 gives a longer-range perspective and shows the extreme gyrations that have occurred in the last three years. The dollar weakened against 13 of the 16 in the last three months and against 8 of the 16 in the last month. Quite often the change in value of these 16 currencies does not accord with the broad index, but this is not one of those times.
A falling dollar puts upward pressure on all commodity prices that are greenback denominated. Table 1 is color coded to indicate strengthening of the dollar in red and weakening in green. We regard strengthening of the U.S. dollar as negative and weakening as positive because of the effect on the trade balance of all commodities and on the total national trade deficit.
In each of these reports, we comment on several of the 16 steel and iron ore trading currencies listed in Table 1 and over a period of several months will describe the history of all of them. Charts for each of the 16 currencies through Feb. 23 are available on request.
The South African Rand
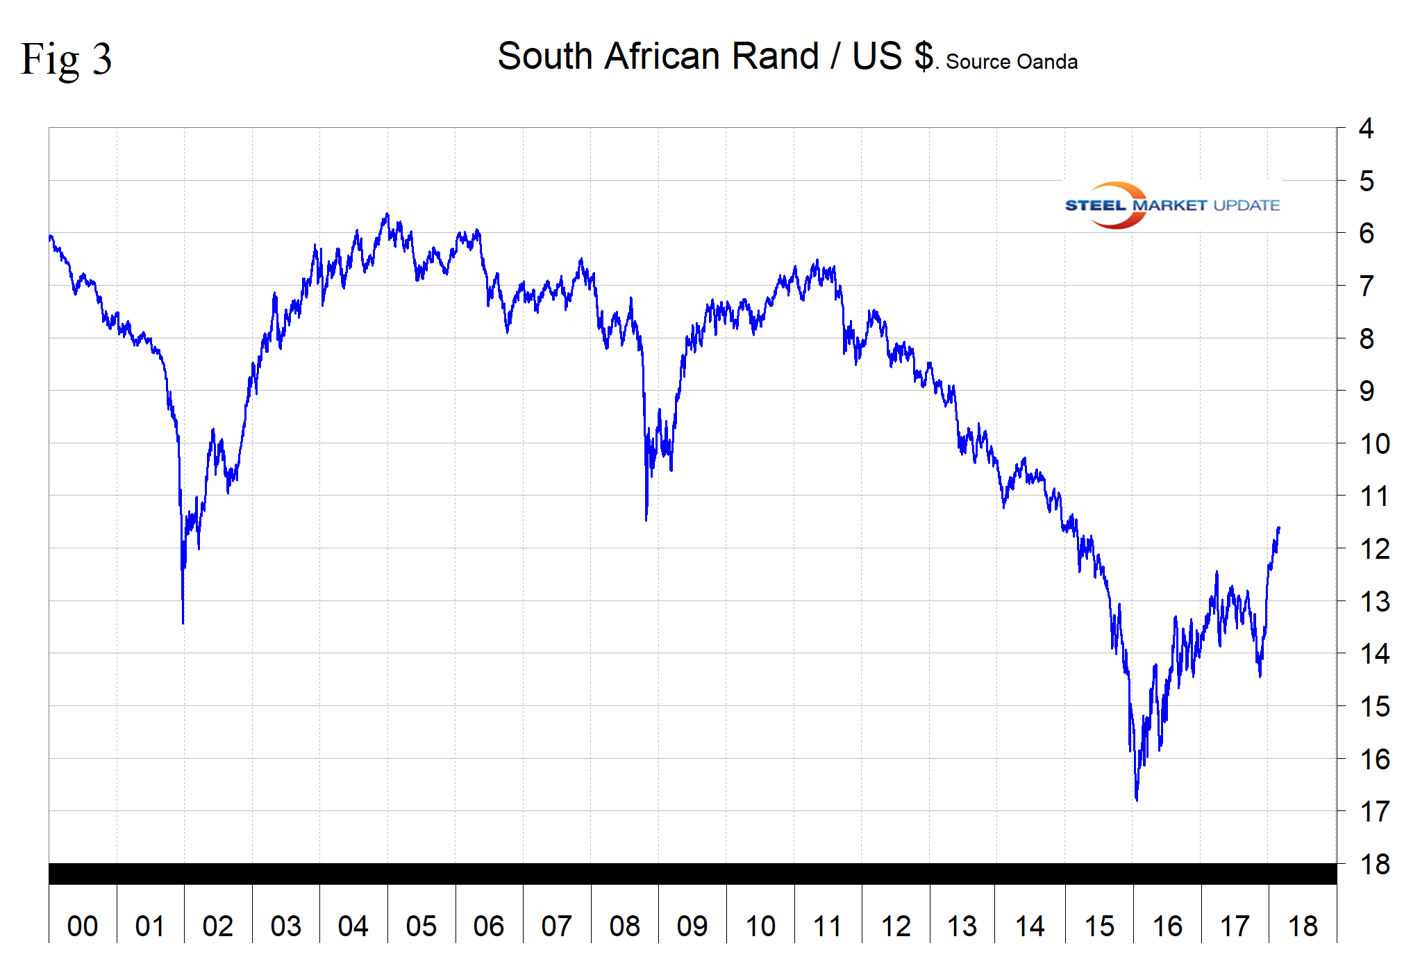
South Africa’s currency has been on a tear in the last few months, presumably because the political instability surrounding President Zuma was coming to a head and led to his resignation this month. In our December update, the rand was up by 2.5 percent, by 13.4 percent in our January update and by 19.5 percent in this latest report, all at the three-month level. In the last 12 months, South Africa was in 18th place as a steel exporter to the U.S. with a total of 324,000 metric tons. The main items were HDG at 46 percent of the total, line pipe at 15 percent, cold rolled sheet at 15 percent and OCTG at 10 percent. All other products were minimal (Figure 3).
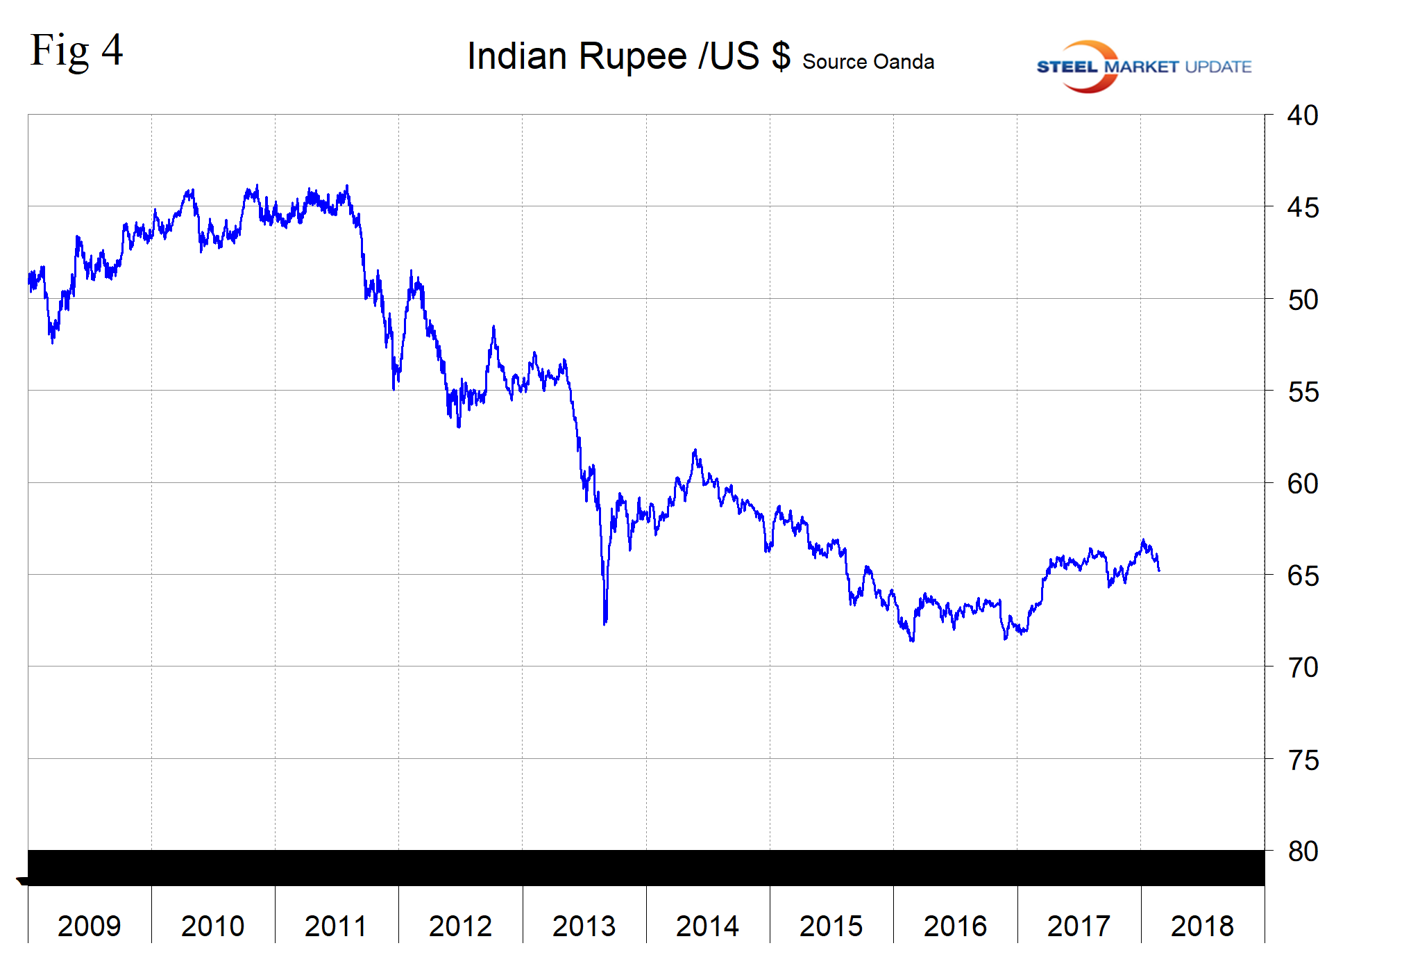
The Indian Rupee
Platts reported this month that India is poised to become the world’s second largest steelmaker, displacing Japan in that role. Indian domestic demand is being driven by infrastructure and housing construction and by automobile manufacture. In the last three months, the rupee has declined by 0.3 percent and by 1.7 percent in the last month. The rupee was one of only three of the 16 to decline in the last three months. The others were Brazil and Ukraine. In the last 12 months, India was in 11th place as a steel exporter to the U.S. with a total of 698,000 metric tons. The main items were: line pipe at 54 percent, HDG sheet at 12 percent, and wire rod and mechanical tubing, both at 5 percent. All other products were minimal (Figure 4).
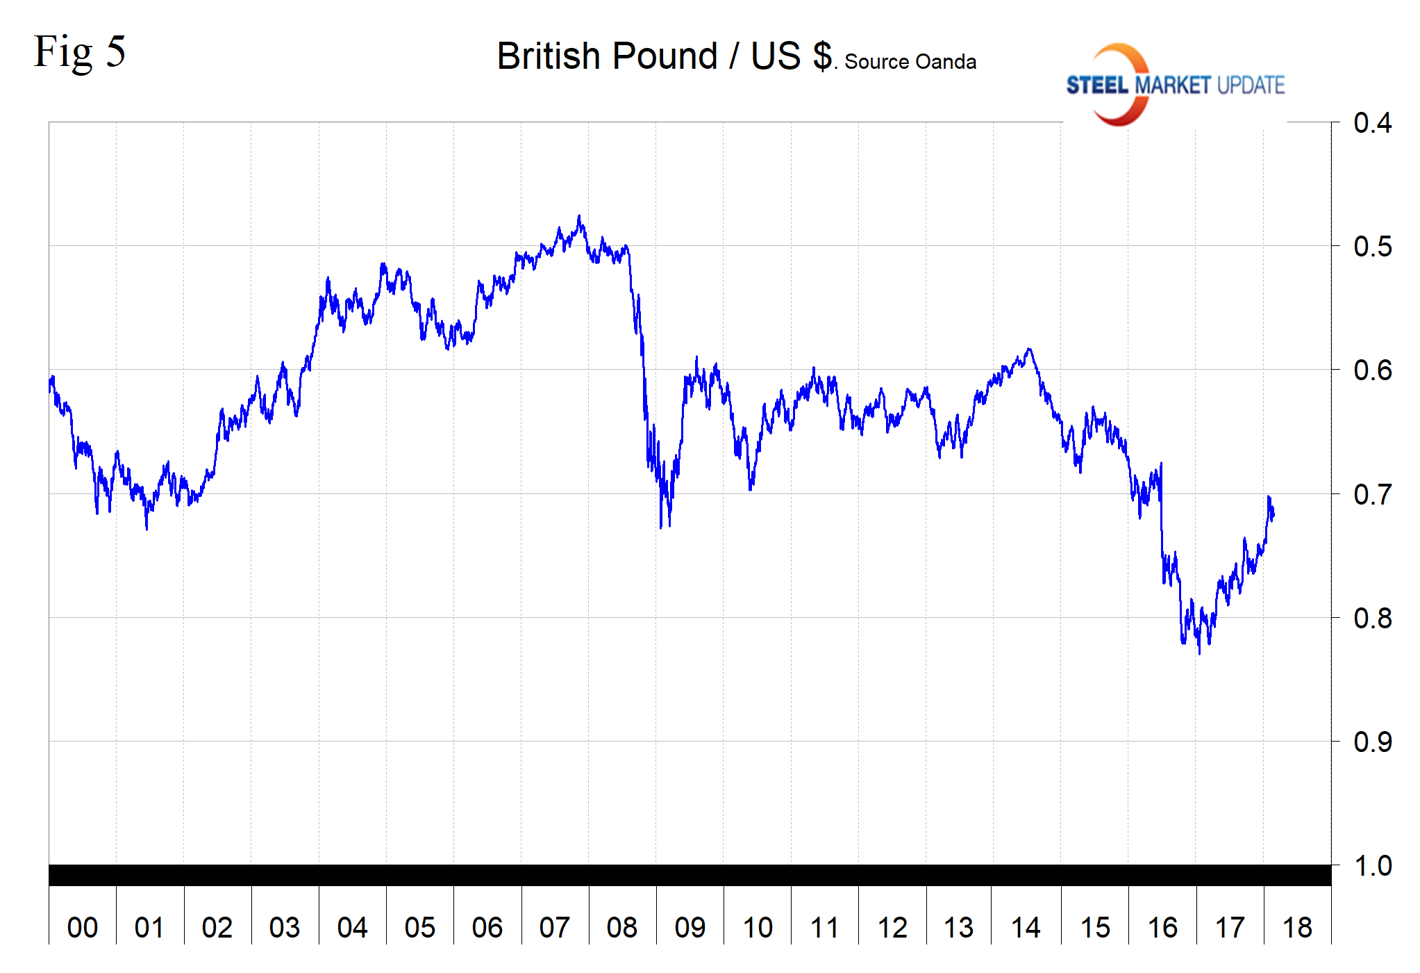
The British Pound
On Feb. 12, the IMF concluded their Article IV consultation with the UK stating that “Brexit, as the UK’s decision to exit the European Union (EU) is commonly known, is weighing on the economy, even as growth is accelerating in the rest of the world. Higher prices, caused by a weaker pound, have limited increases in spending, and uncertainty about the future relationship with the EU has kept some business investments on hold. In this situation, it will be even more important for the UK to raise productivity and balance its public finances.”
Despite what we at SMU think is a dire situation, the British pound has strengthened by 4.9 percent in the last three months. In the last 12 months, the UK was in 17th place as a steel exporter to the U.S. with a total of 347,000 metric tons. The main items were: structural shapes at 23 percent, cold rolled sheet at 18 percent, line pipe at 14 percent and wire rod at 11 percent. Hot rolled bars, cold finished bars, tin plate and OCTG also had significant volume (Figure 5).
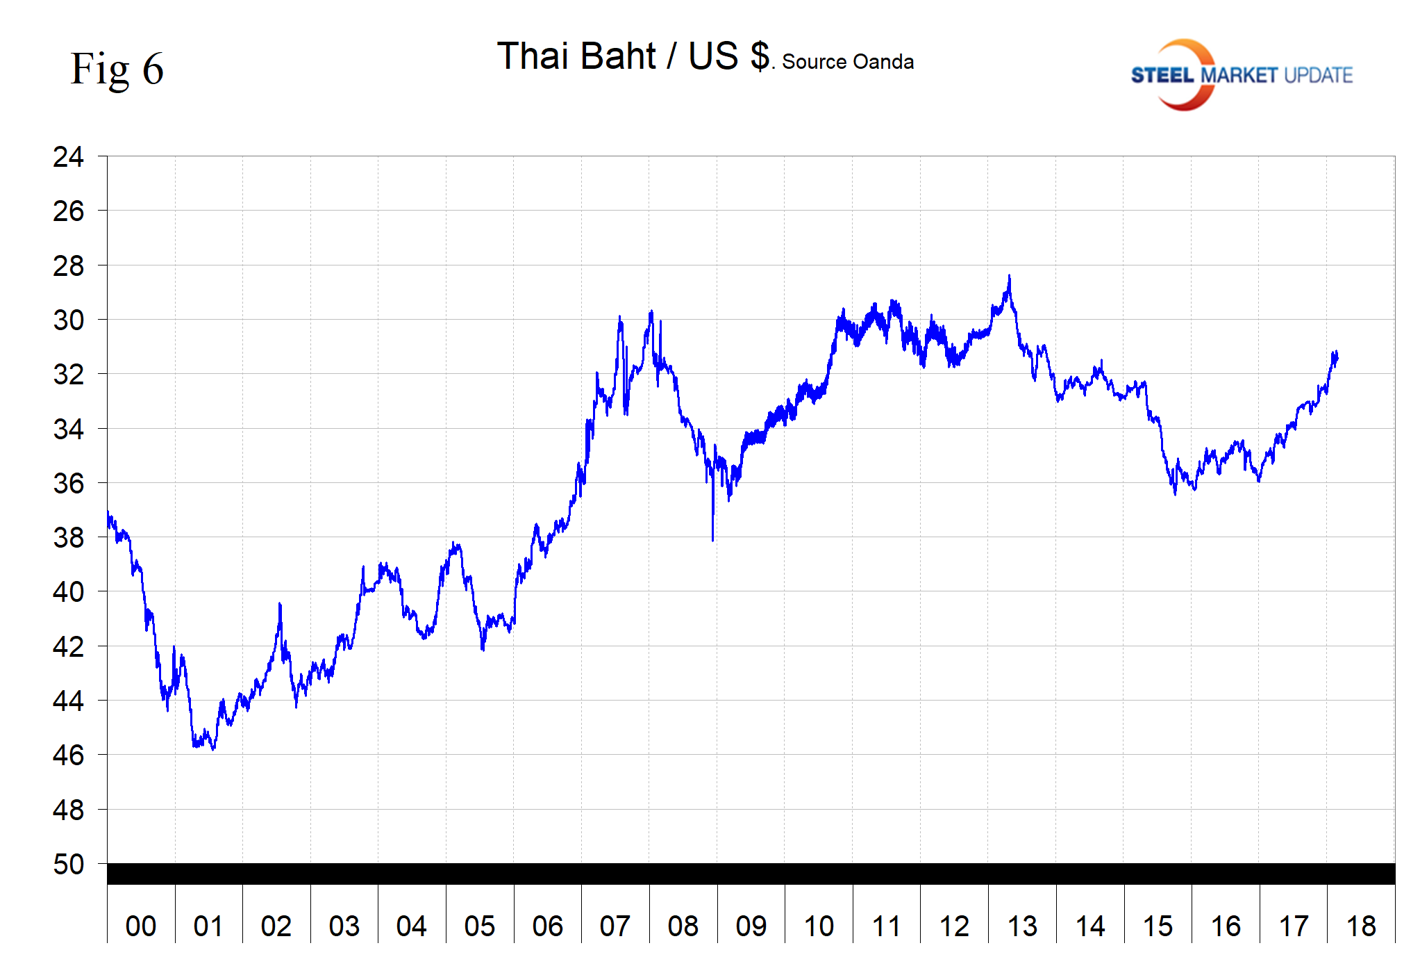
The Thai Baht
In the last three months, the Thai baht strengthened by 4.0 percent against the U.S. dollar and by 0.6 percent in the last month. In the last 12 months, Thailand was in 16th place as a steel exporter to the U.S. with a total of 388,000 metric tons. The main items were: standard pipe at 34 percent, HDG sheet at 24 percent, cold rolled sheet at 21 percent and OCTG at 5 percent. All other products were minimal (Figure 6).
Explanation of Data Sources: The broad index is published by the Federal Reserve on both a daily and monthly basis. It is a weighted average of the foreign exchange values of the U.S. dollar against the currencies of a large group of major U.S. trading partners. The index weights, which change over time, are derived from U.S. export shares and from U.S. and foreign import shares. The data are noon buying rates in New York for cable transfers payable in the listed currencies. At SMU, we use the historical exchange rates published in the Oanda Forex trading platform to track the currency value of the U.S. dollar against that of 16 steel and iron ore trading nations. Oanda operates within the guidelines of six major regulatory authorities around the world and provides access to over 70 currency pairs. Approximately $4 trillion U.S. dollars are traded every day on foreign exchange markets.


