

Market Data

February 28, 2018
WSA: Global Steel Production Grows by 2.7 Percent
Written by Peter Wright
Global steel production grew by 2.7 percent in the three months through January, though the pace of growth continued to be slowed by pollution control restrictions in China. Excluding China, the pace of growth for world steel production was 4.8 percent, according to the latest Steel Market Update analysis of World Steel Association data.
On Feb. 5, Moody’s Analytics survey of business confidence reported: “Global businesses remain upbeat at the start of 2018. Sentiment is especially strong in the U.S., likely buoyed by the recent corporate tax cuts. Abstracting from the weekly vagaries of the survey, a strong 40% of responses to the nine questions posed in the survey are positive, while less than 10% of the responses are negative. Respondents are notably cheery about present business conditions, as about half say they are improving, and they expect even better conditions by this summer.”
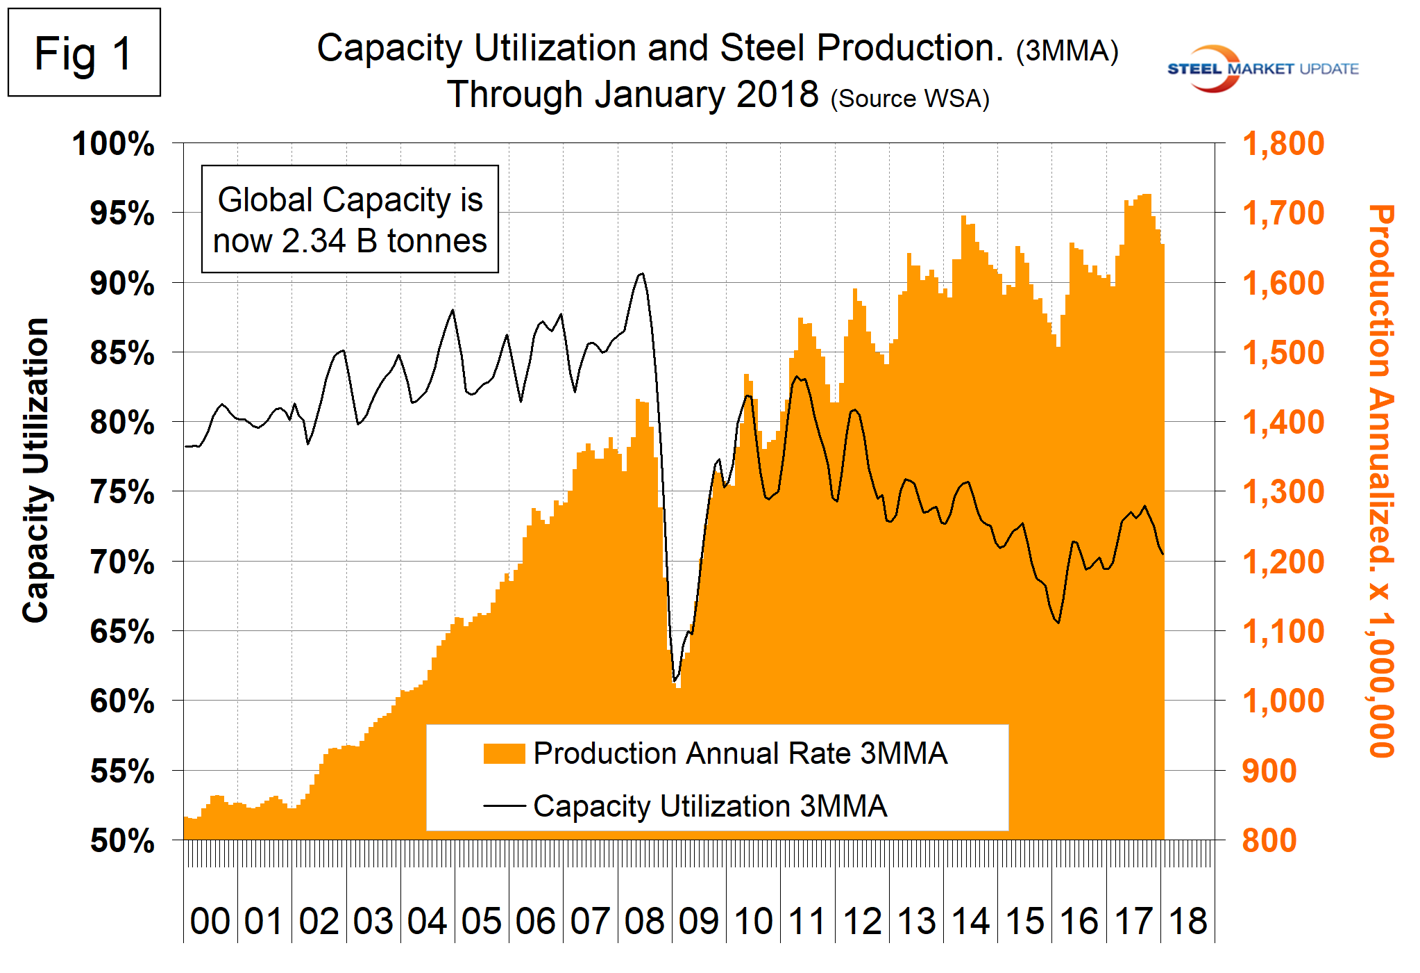
In 2017, total global steel production hit 1.687 billion metric tons, up by 5.2 percent from 2016. Production in the month of January 2018 totaled 139,439,000 metric tons, up from 137,574,000 in December. Capacity utilization in January was 71 percent. The three-month moving averages (3MMA) that we prefer to use were 137,869,000 metric tons and 70.5 percent, respectively. Figure 1 shows monthly production and capacity utilization since January 2000. The summer slowdown that has occurred in each of the last seven years was delayed until November last year. On a tons-per-day basis, production in January was 4.498 million metric tons with a 3MMA of 4.496 million metric tons. The all-time high was in June 2017 at 4.695 million metric tons. In three months through January, production was up by 2.7 percent year over year. Capacity utilization was on an erratically downward trajectory from mid-2011 through February 2016 when it bottomed out at 65.5 percent. In December 2016, the OECD’s steel committee estimated that global capacity would increase by almost 58 million metric tons per year between 2016 and 2018 bringing the total to 2.43 billion tons. That forecast is coming to pass as capacity is now 2.34 billion tons.
As we dig deeper, we start with seasonality. On average, global production has peaked in the early summer for the last seven years with April and June having the highest average volume. Figure 2 shows the average tons per day of production for each month since 2008. In those 11 years on average, January has been up by 4.04 percent; this year January was up by 1.35 percent. The 2018 shortfall was entirely due to China’s pollution-driven production curtailment.
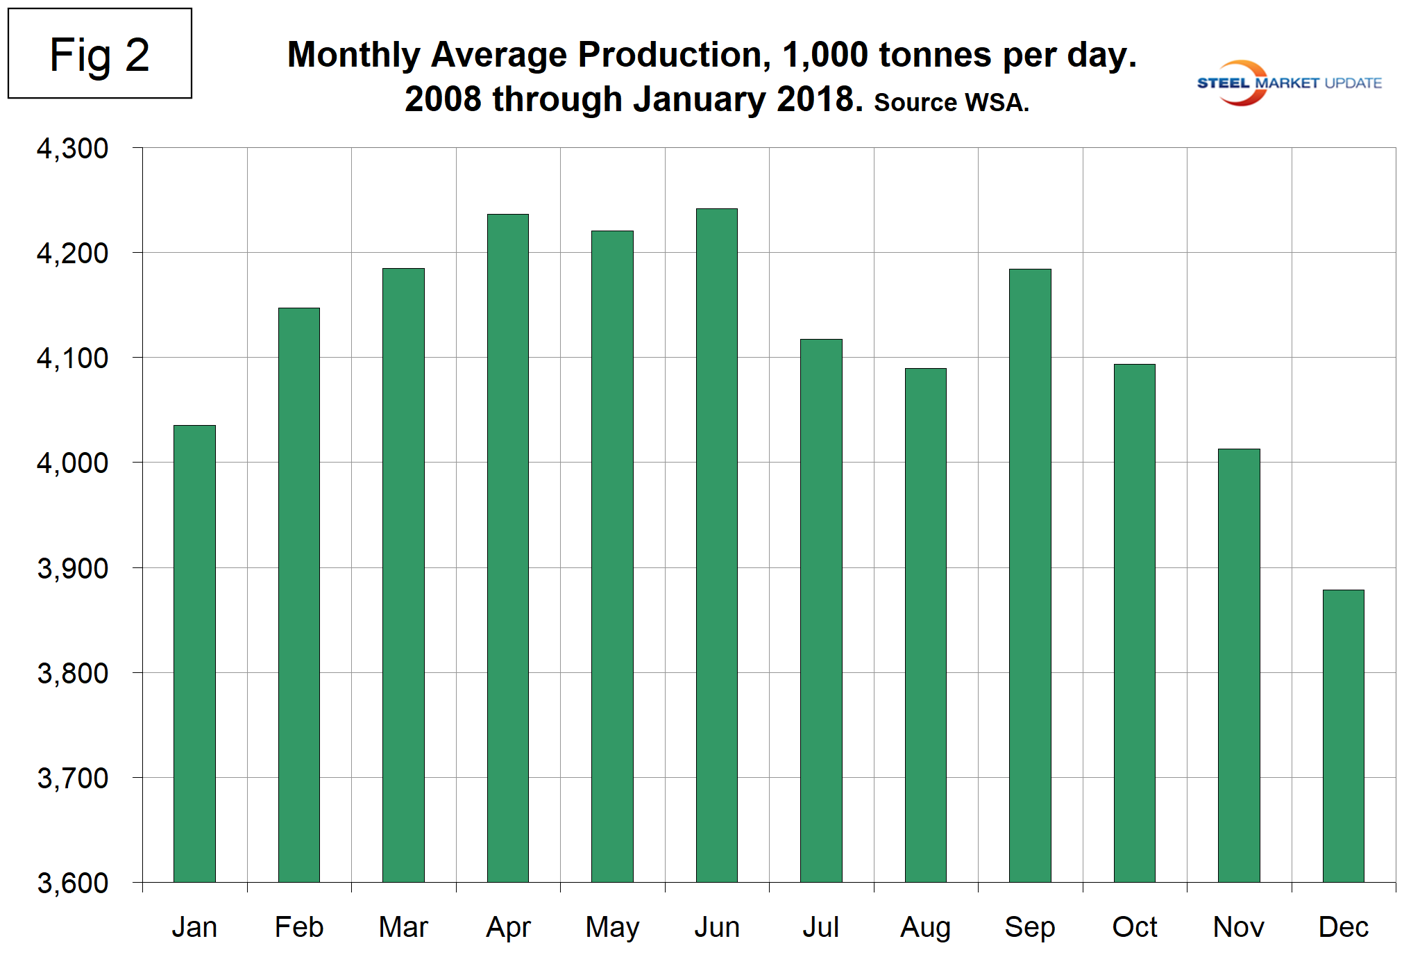
Figure 3 shows the monthly year-over-year growth rate on a 3MMA basis since January 2005. Production began to contract in March 2015 and the contraction accelerated through January 2016 when it reached negative 5.4 percent. Growth became positive in May 2016, reached a rate of 7.0 percent in September last year, then slowed every month through January when it reached 2.7 percent. In the 14 months through May 2017, China’s growth rate was lower than the rest of the world. That changed in the five months through October when China began to pull away again. In November through January, China once again expanded by less than the rest of the world with a growth rate of 1.0 percent compared to 4.8 percent for everyone else. In January, China produced 48.0 percent of the global total, down from 51.6 percent in June.
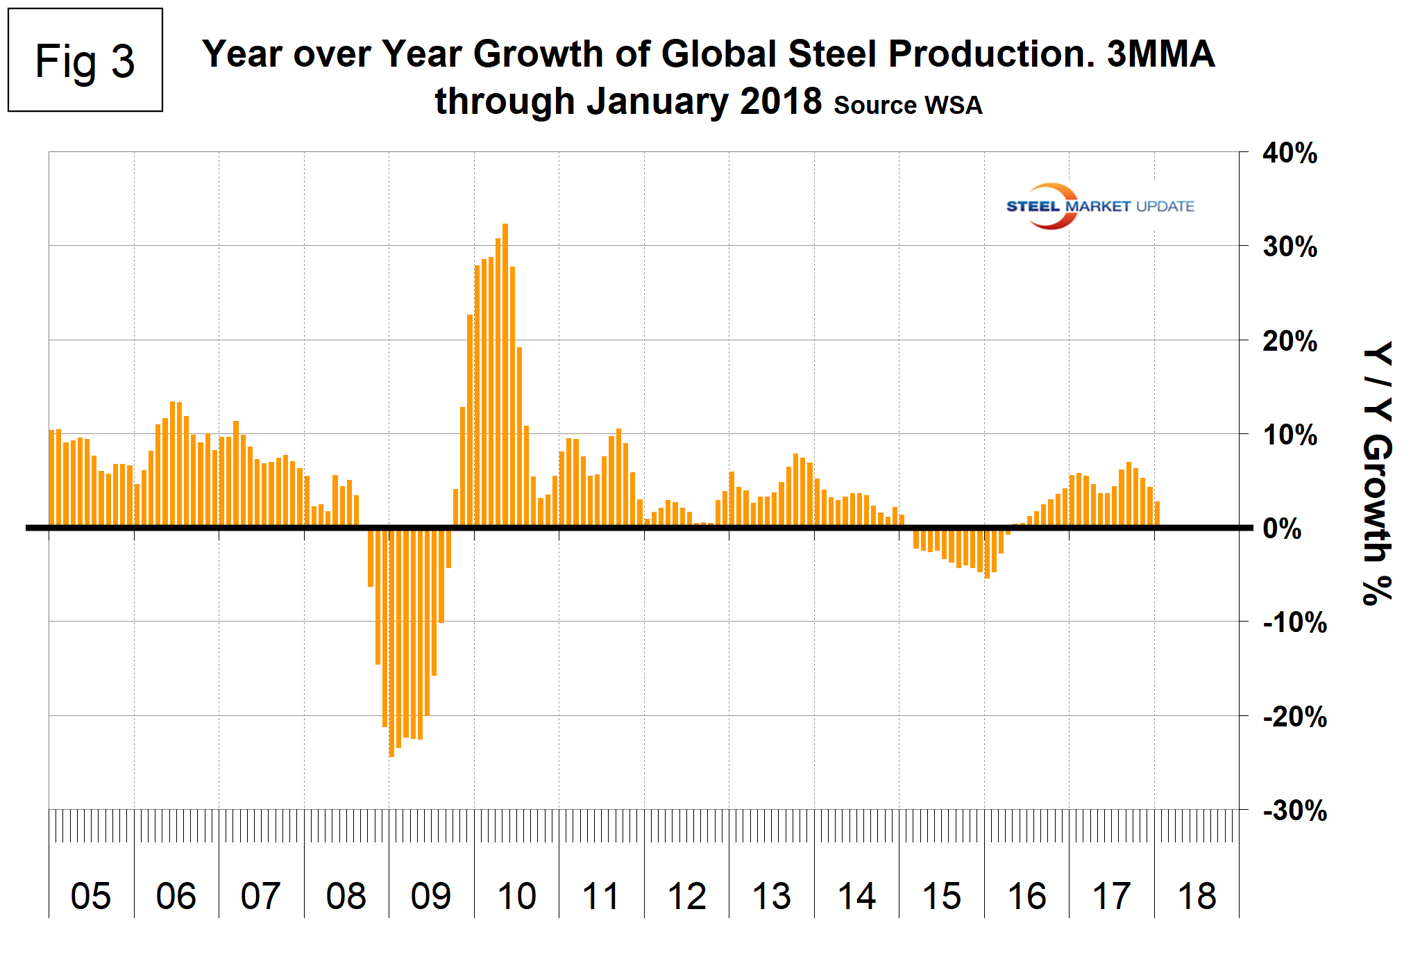
Table 1 shows global production broken down into regions, the production of the top 10 nations in the single month of January, and their share of the global total. It also shows the latest three months and 12 months of production through January with year-over-year growth rates for each period. Regions are shown in white font and individual nations in beige. The world overall had positive growth of 2.7 percent in three months and 4.5 percent in 12 months through January. When the three-month growth rate is lower than the 12-month growth rate, as it was in January, we interpret this to be a sign of negative momentum, which is entirely due to China’s pollution-control-driven cutback.
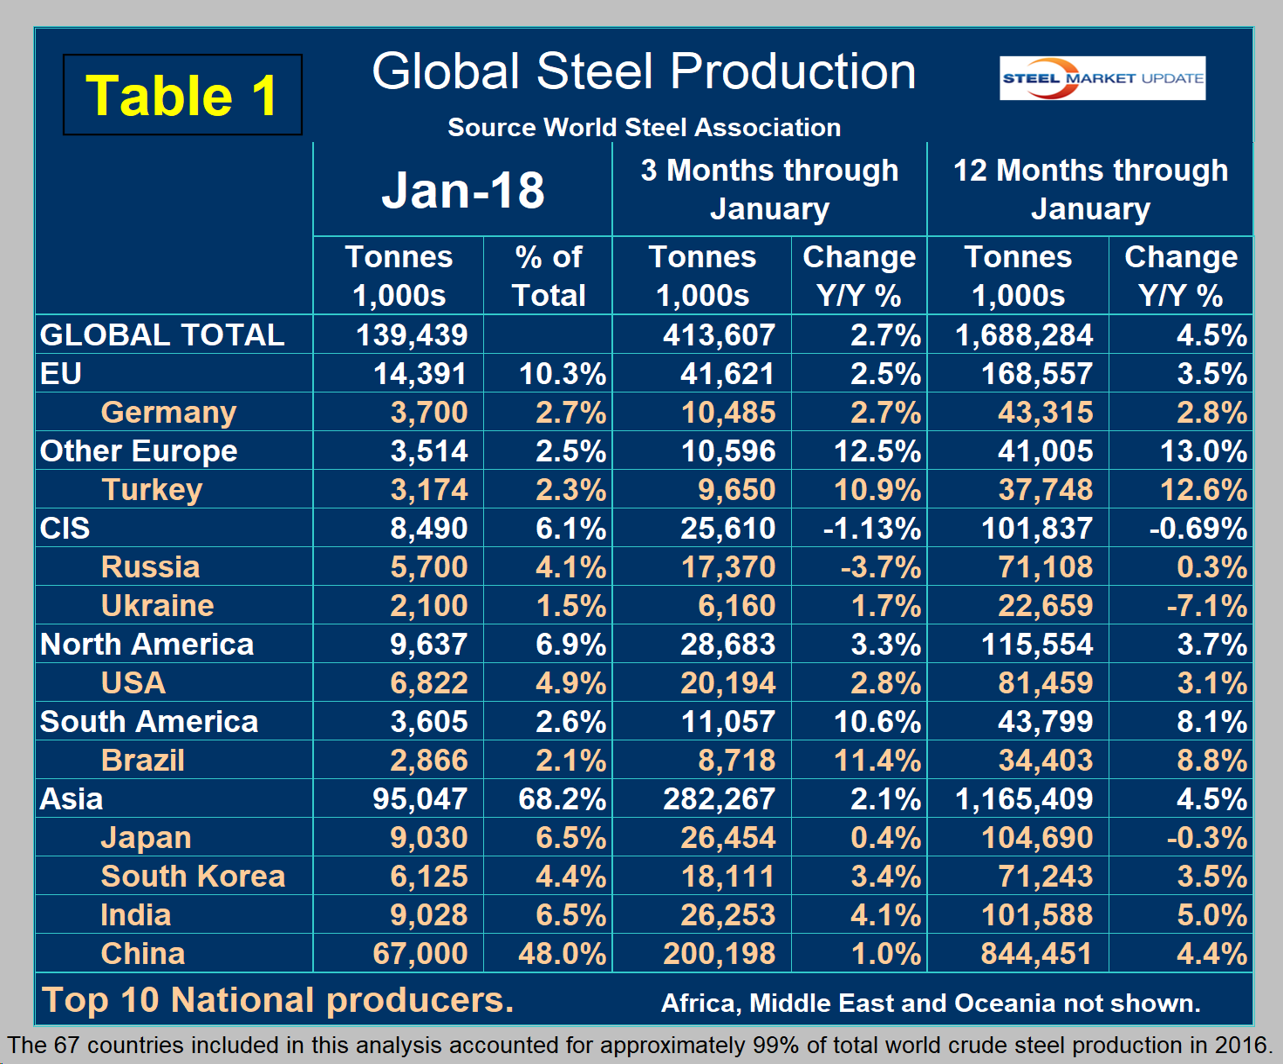
Figure 4 shows China’s production since 2005 and Figure 5 shows the year-over-year growth. After slowing for 13 straight months year over year, China’s production returned to positive growth each month from May 2016 through January 2018. On Dec. 15, Tangshan, China’s biggest steelmaking city, launched well-publicized steel output cuts to improve air quality in Beijing, Tianjin and 26 surrounding cities.
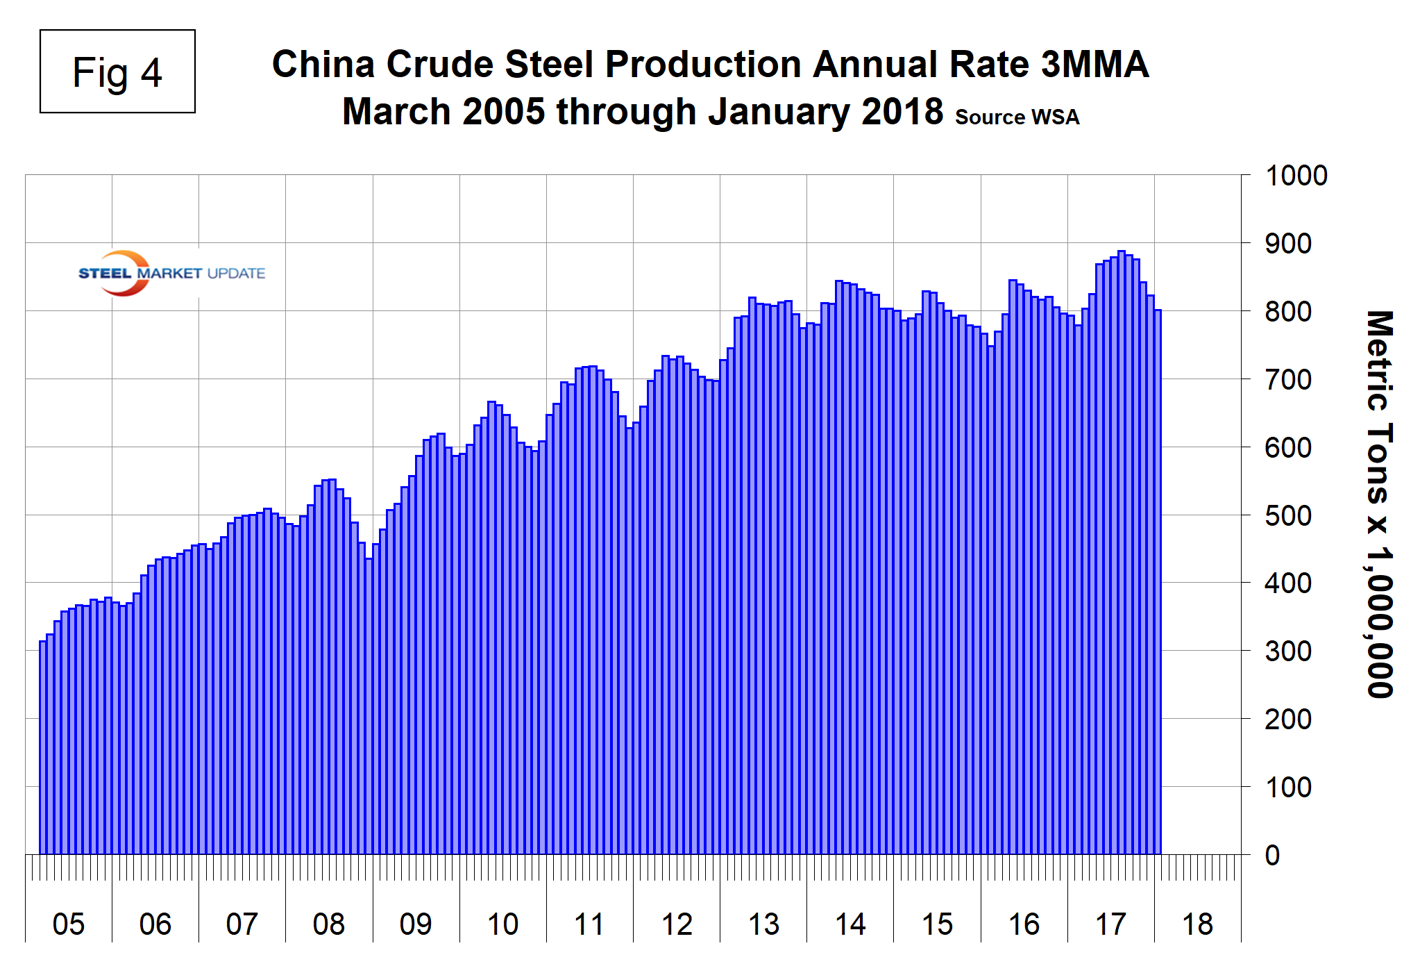
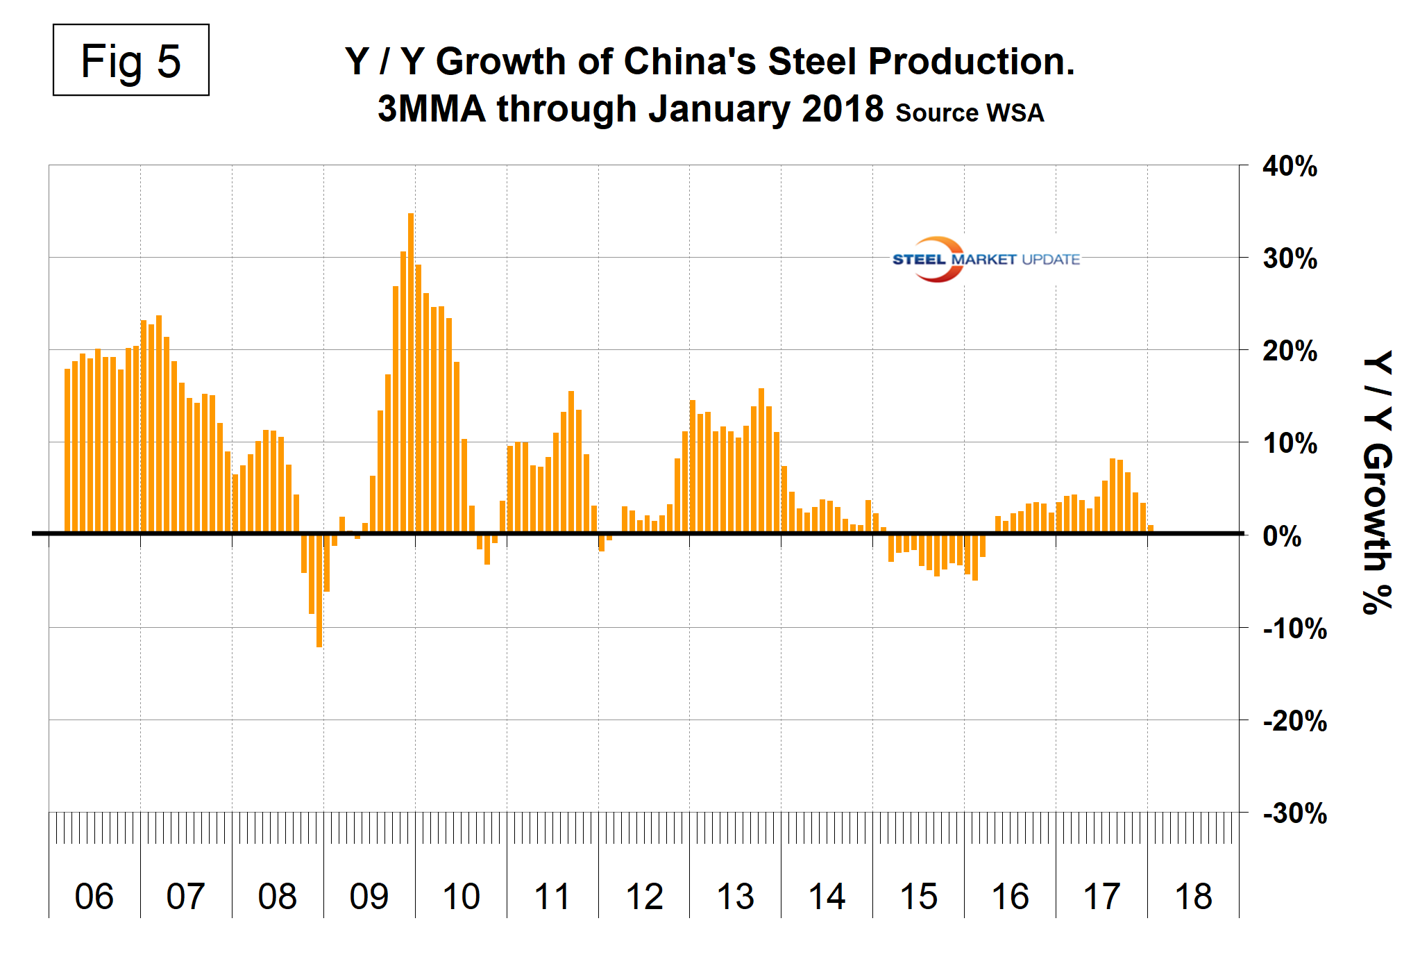
Table 1 shows that in three months through January year over year, every region except the CIS had positive growth. At the national level, only Russia contracted. This was a repeat of the December result. North America was up by 3.3 percent in three months. Within North America the U.S. was up by 2.8 percent, Canada was up by 9.9 percent and Mexico was up by 0.7 percent. In the 12 months of 2017, 115.3 million metric tons were produced in NAFTA of which 70.8 percent, 11.9 percent and 17.3 percent were produced in the U.S., Canada and Mexico, respectively. Other Europe led by Turkey had the highest regional growth rate in 3 months through January year over year followed by South America in second place. Asia was up by 2.1 percent.
The World Steel Association Short Range Outlook for apparent steel consumption in 2017 and 2018 was revised and published on Oct. 14, 2017 (see below). Commenting on the outlook, World Steel Economics Committee Chairman T.V. Narendran said: “Progress in the global steel market in 2017 has been encouraging. We have seen the cyclical upturn broadening and firming throughout the year, leading to better than expected performances for both developed and developing economies, although the MENA region and Turkey have been an exception. The risks to the global economy that we referred to in our April 2017 outlook, such as rising populism/protectionism, U.S. policy shifts, EU election uncertainties and China deceleration, although remaining, have to some extent abated. This leads us to conclude that we now see the best balance of risks since the 2008 economic crisis. However, escalating geopolitical tension in the Korean peninsula, China’s debt problem and rising protectionism in many locations continue to remain risk factors. In 2018, we expect global growth to moderate, mainly due to slower growth in China, while in the rest of the world, steel demand will continue to maintain its current momentum.”
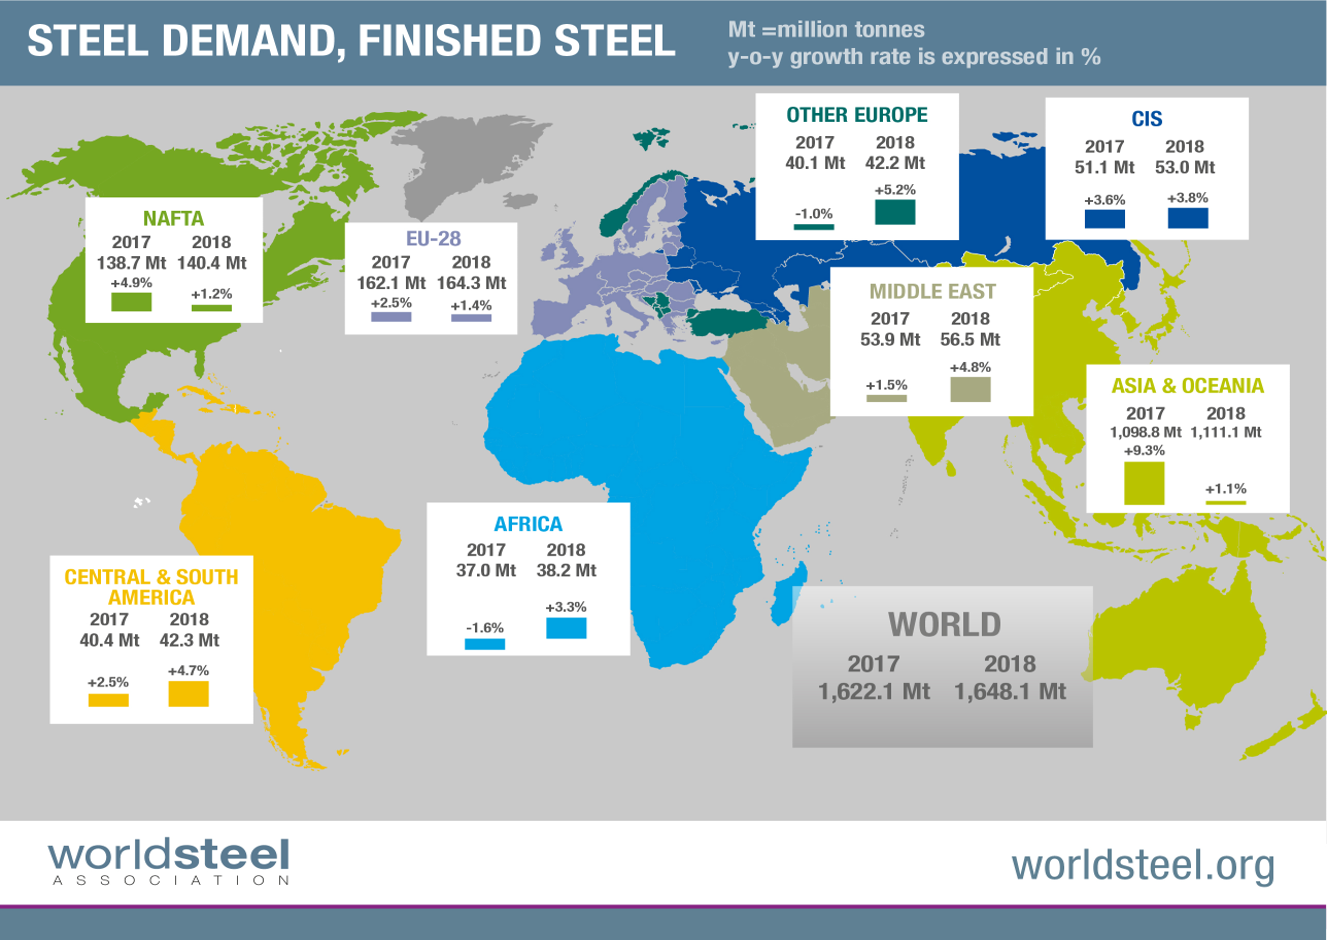
SMU Comment: On a 3MMA basis year over year through January, the world as a whole had a growth rate of 2.7 percent, but China grew at 1.0 percent and the rest grew at 4.8 percent. This is an encouraging trend if it continues because it means that Chinese pressure on the global market is easing. WSA increased its forecast for production in 2018 from 1,548.5 million metric tons in April to 1,648.1 million metric tons in its October forecast. This would be a projected growth of 1.6 percent in 2018, which based on the present momentum seems low. Globally, steel is back on a roll, driven primarily by construction in the developing world. The emerging and developing economies saw their GDP decline from 2010 through 2015 after which there was a turnaround that the IMF believes will continue through the 2022 forecast. We expect the IMF to raise the forecast of global growth in its April update.


