

Market Data

March 19, 2018
Energy Prices and Rig Counts: U.S. Pumping More Crude Than Ever
Written by Peter Wright
Last week, the Energy Information Administration (EIA) announced that in the last two months of 2017, the U.S. pumped more crude oil than at any time in history.
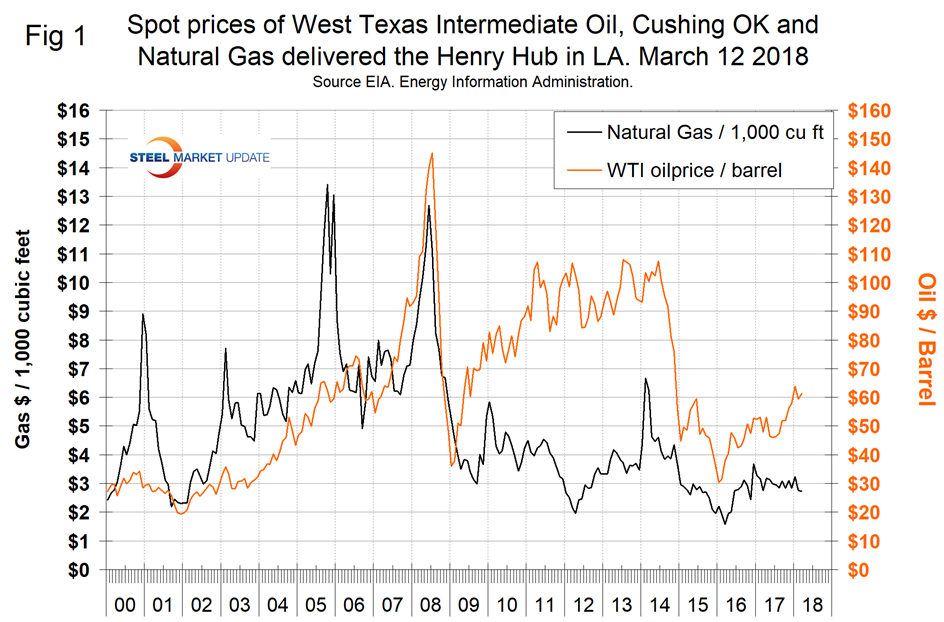
The spot price of West Texas Intermediate (WTI) broke through the $60 level on Dec. 29 for the first time since Dec. 18, 2014. It reached $64.22 on Jan. 12 before falling back to $59.41 on Feb. 12. The price has remained over $60 through the first 12 days of March closing at $61.35 on the 12th. The total number of operating rigs exploring for oil and gas increased by six in the week ending March 16. The prices of oil and natural gas drive the consumption of energy-related steel products including oil country tubular goods, pipe fittings and well head equipment, among others. Welded tubular goods (not including OCTG) consumed about 5.5 million tons of hot rolled sheet in 2017.
On March 14, the EIA reported that U.S. production of crude oil grew 5 percent in 2017, reaching 10 million barrels per day in the last two months of the year. Annual average U.S. crude oil production grew by 463,000 barrels per day (b/d) in 2017 to 9.3 million b/d after declining by 551,000 b/d in 2016. In November 2017, monthly U.S. crude oil production grew 1.2 million b/d year-over-year and reached the highest level of production in U.S. history, surpassing 10 million b/d, a level last reached in 1970. U.S. crude oil production has increased significantly over the past 10 years, driven mainly by production from tight rock formations using horizontal drilling and hydraulic fracturing. EIA projects that U.S. crude oil production will continue growing in 2018 and 2019, averaging 10.7 million b/d and 11.3 million b/d, respectively.
Figure 1 shows historical oil and gas prices from January 2000 through March 12. The spot price for West Texas Intermediate fell briefly below $60/barrel in February for the first time since Dec. 28. Our price and inventory data come from the EIA, which reported that the price of natural gas at the Henry Hub in Louisiana through March 9 was unchanged in the previous month at $2.74/1,000 cubic feet. There was a brief spike in January when the price reached $4.28 on the 5th. That was the first time for gas to break through $4.00 since Nov. 2014. EIA expects the share of U.S. utility-scale electricity generation from natural gas to average about 32 percent in 2018, down from 34 percent in 2016. EIA projects the 2018 share of generation from coal will average 30 percent, about the same as last year. Generation from renewable energy sources other than hydropower will grow from about 8 percent in 2016 to a forecast share of nearly 10 percent in 2018.
Stocks of crude oil in the U.S. declined steadily in the last nine months of 2017 before diving by 46 percent in the week ending Dec. 29 (Figure 2).
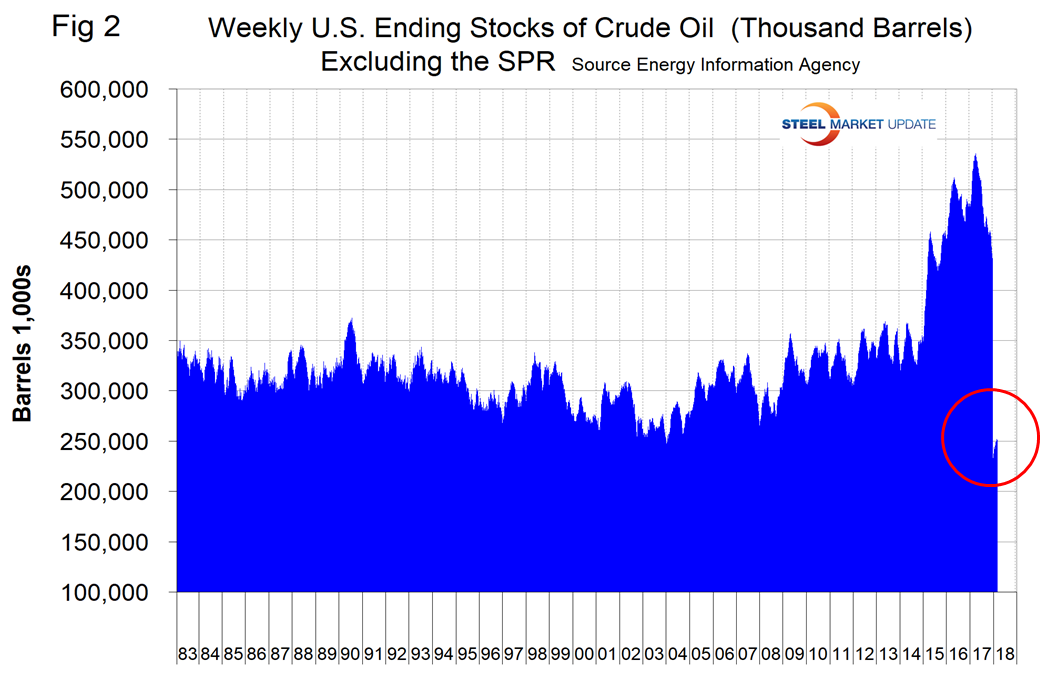
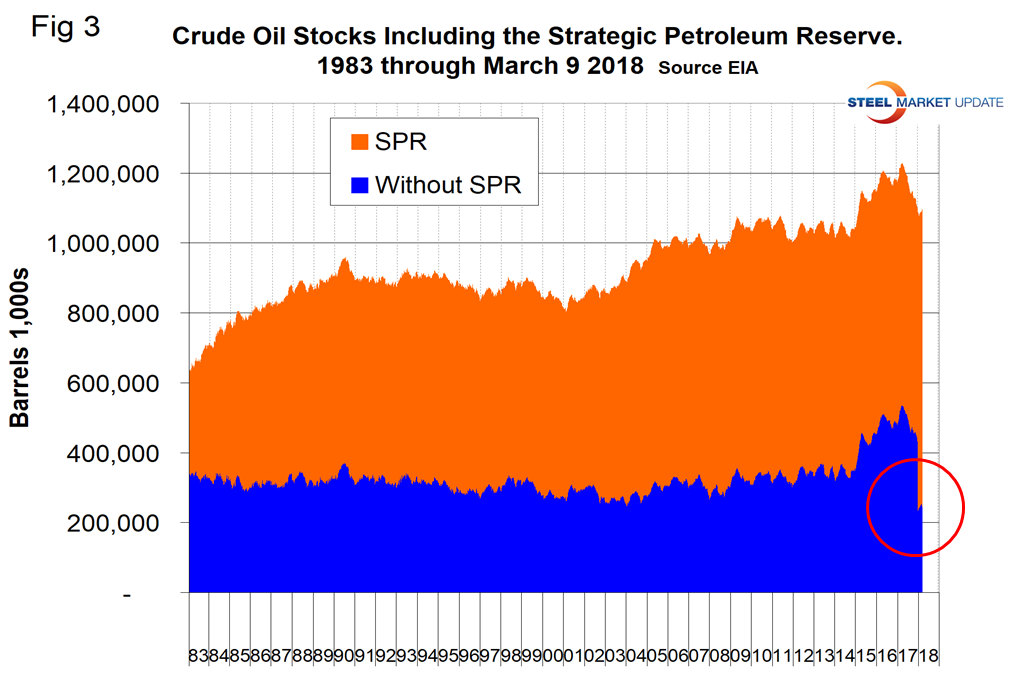
Evidently in the last week of 2017, 192 million barrels were transferred to the strategic petroleum reserve from the available inventory. We have seen no commentary on this anywhere in the press, but what we are reporting here is the official picture. Figure 3 shows total crude inventories including the SPR and that total inventories declined for most of 2017 but are still historically high.
The total number of operating rigs in the U.S. on March 16 was 990, up from 984 in our last update on Feb. 16 and the highest since April 2, 2015. Figure 4 shows the total number of operating rigs in the U.S. and the weekly change.
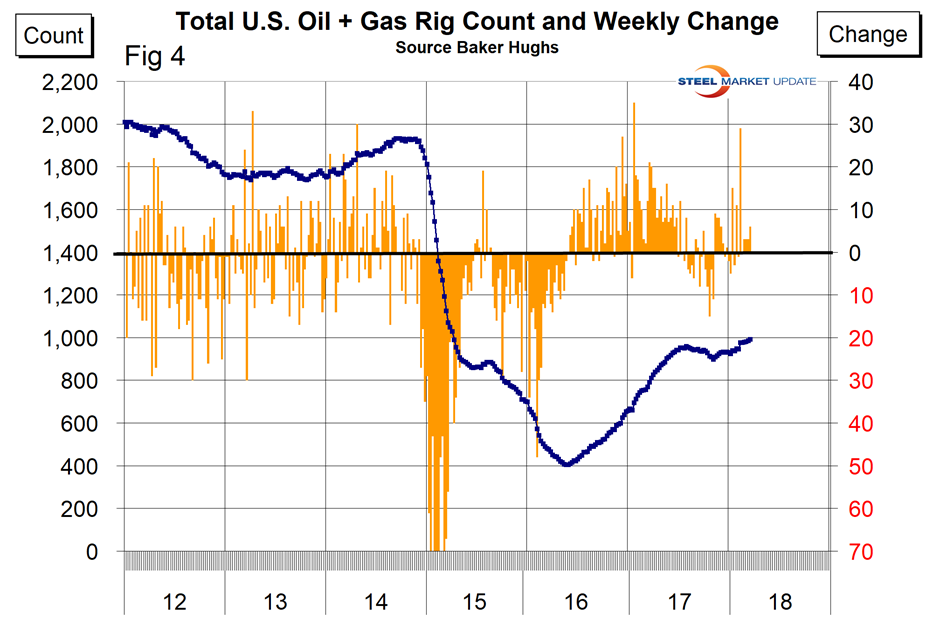
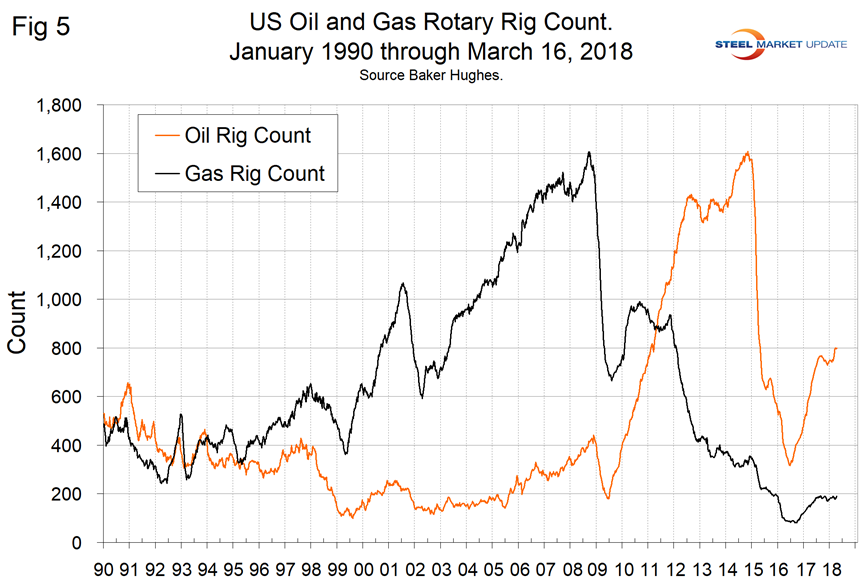
In the week ending March 9, the total on-shore count increased by six and is up by 66 year to date. The oil rig count had a low point of 316 on June 27, 2016, and stood at 800 on March 16. The U.S. gas rig count rose from its low point of 81 on Aug. 5, 2016, to 189 on March 16. The year-over-year growth rate of U.S. total rigs was 25.5 percent in the latest data. Figure 5 shows the Baker Hughes U.S. Rotary Rig Counts for oil and gas equipment in the U.S. (explanation below).
On a regional basis in the U.S., the big three states for operating rigs are Texas, Oklahoma and North Dakota. Figure 6 shows the land rig count in those states since 2000 and that non-conventional drilling in North Dakota has declined by 70 percent from its heyday in late 2014. This is not as bad as it sounds because previously drilled and capped wells are being put back on stream and in fact the North Dakota active count increased by six since mid-February.
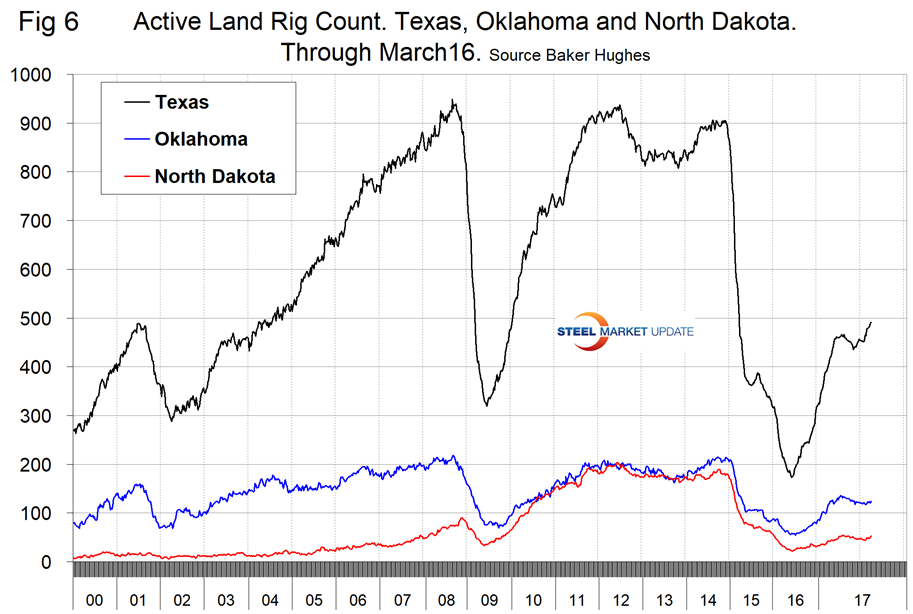
Figure 7 illustrates the monthly U.S. oilfield production of crude from January 1970 through December 2017 (latest data available). The all-time high was 310 million barrels in November 1970. In December 2017, production was 308 million barrels. The record looks set to fall in 2018. In its news release, the EIA stated that the record had in fact been broken, but the monthly numbers don’t show that. We assume that they were referring to several days and not a total month’s production.
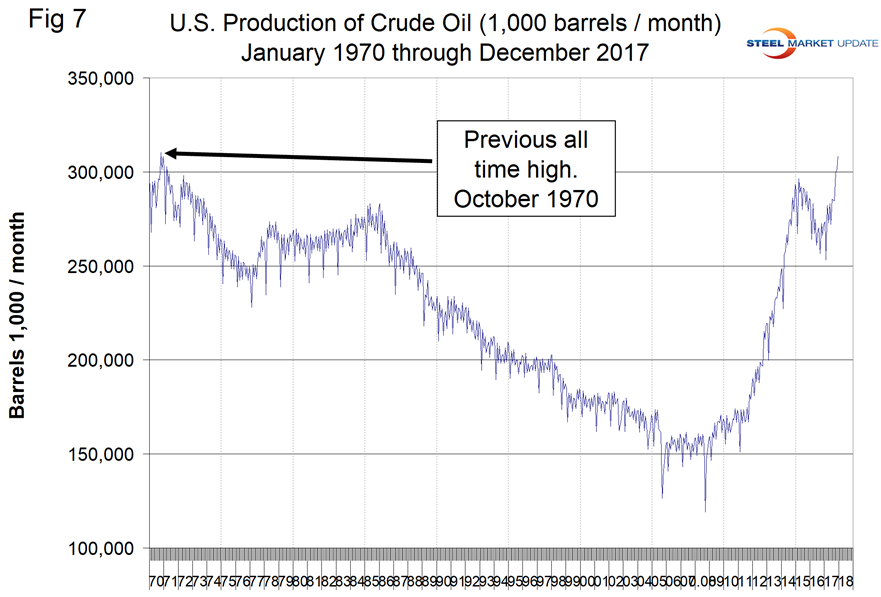
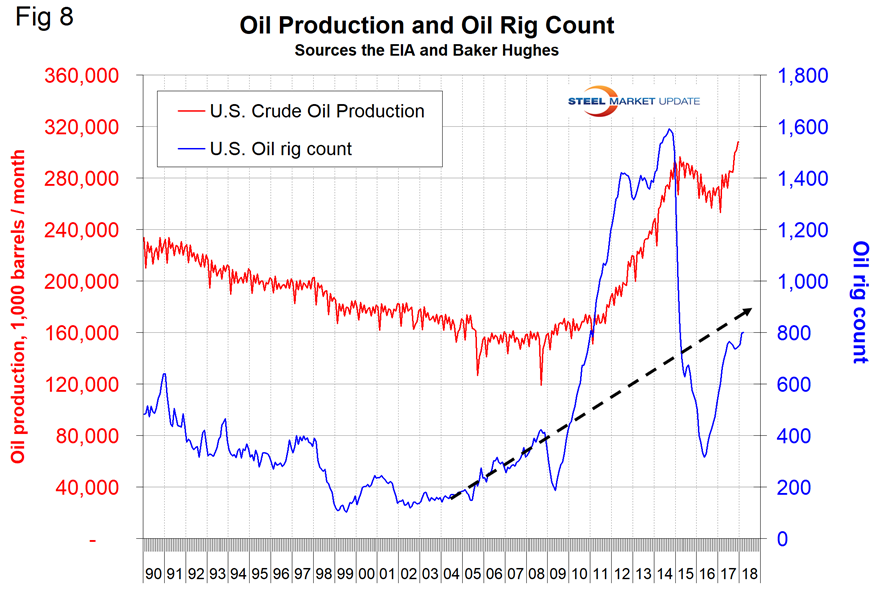
Figure 8 compares oil production and the oil rig count and shows how the increase in exploratory wells drove production from 2009 through late 2014 when the oil price collapsed. The subsequent decline in production was much less marked and is again increasing. Our take on this is that the huge increase in exploratory oil rigs beginning in 2009 may have been an anomaly and that we won’t see a repeat of the number operating in 2014 for a very long time.
Baker Hughes Rotary Rig Count: This is a weekly census of the number of drilling rigs actively exploring for or developing oil or natural gas in the United States. Rigs are considered active from the time they break ground until the time they reach their target depth and may be establishing a new well or sidetracking an existing one. The Baker Hughes Rotary Rig count includes only those rigs that are significant consumers of oilfield services and supplies.


