

Market Data

April 23, 2018
Firming Oil Price Boosts Drill Rig Count
Written by Peter Wright
Oil prices are firm, and the drill rig count continues to increase, which is positive news for suppliers to the energy sector.
The spot price of West Texas Intermediate (WTI) has remained above $60 per barrel since Feb. 14 and on April 10 closed at $65.48 per barrel. The total number of operating rigs exploring for oil and gas increased by 18 in April through the 13th. All of the increase was in oil drilling. Gas rigs declined by two. The prices of oil and natural gas drive the consumption of energy-related steel products including oil country tubular goods, pipe fittings and well head equipment, among others. Welded tubular goods (not including OCTG) consumed about 5.5 million tons of hot rolled sheet in 2017.
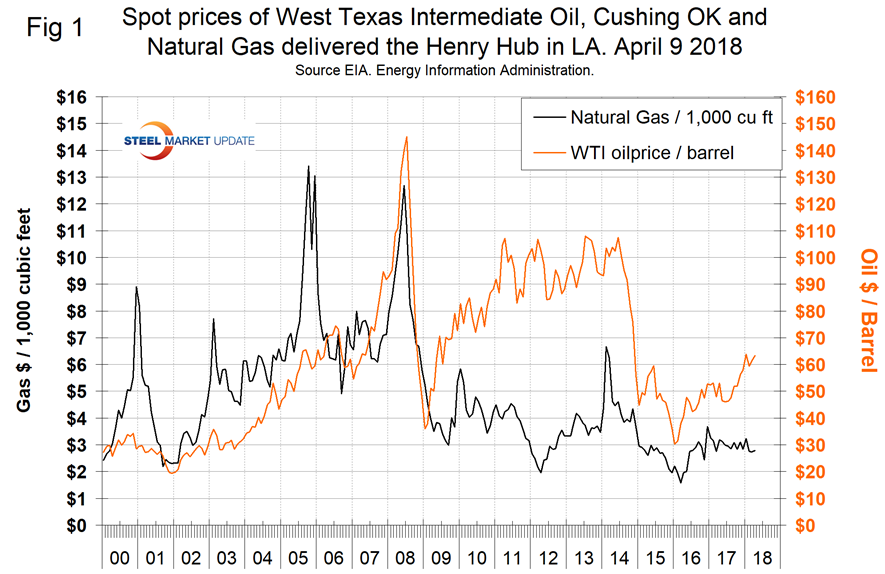
Figure 1 shows historical oil and gas prices from January 2000 through April 9. The spot price for West Texas Intermediate fell briefly below $60 per barrel in February for the first time since Dec. 28. Our price and inventory data come from the Energy Information Administration (EIA), which reported that the price of natural gas at the Henry Hub in Louisiana through April 6 at $2.79 has changed by only 4 cents in two months. There was a brief spike in the price of gas in January when the price reached $4.28 on the 5th. That was the first time for gas to break through $4.00 since November 2014.
Stocks of crude oil in the U.S. have declined steadily since March 17 last year from 1.226 billion barrels to 1.094 billion on April 6. Figure 2 shows the inventory level, including the strategic petroleum reserve and the year-over-year change.
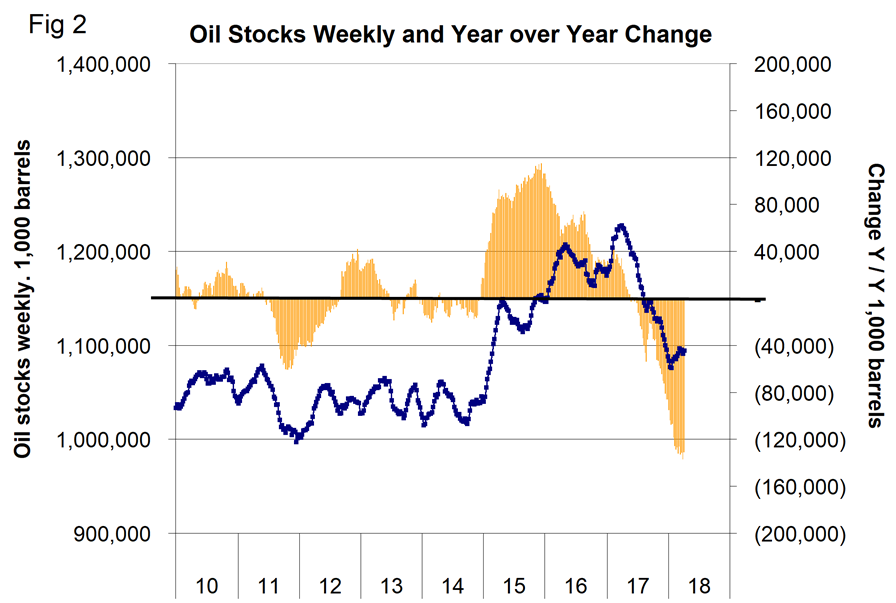
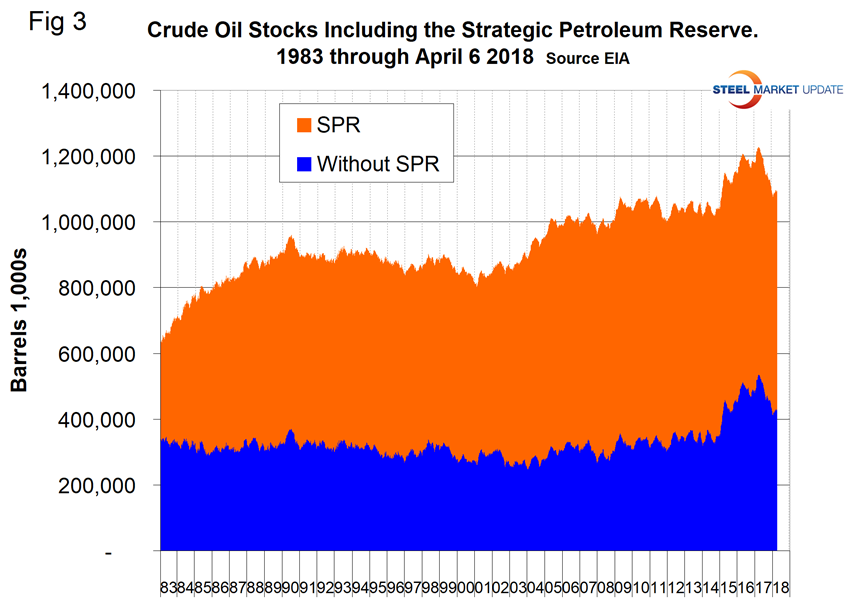
Figure 3 shows total crude inventories, including the strategic petroleum reserve, and that total inventories declined for most of 2017 but are still historically high. Stocks are down by over 130 million barrels in the last 12 months.
The total number of operating rigs in the U.S. on April 13 was 1,008, up from 990 in our last update on March 16 and the highest since April 2, 2015. Figure 4 shows the total number of operating rigs in the U.S. and the weekly change.
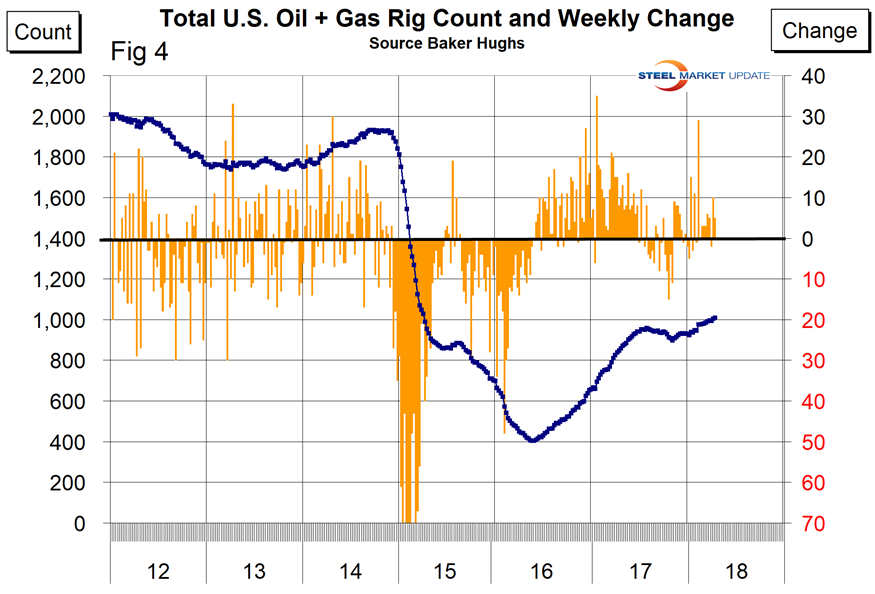
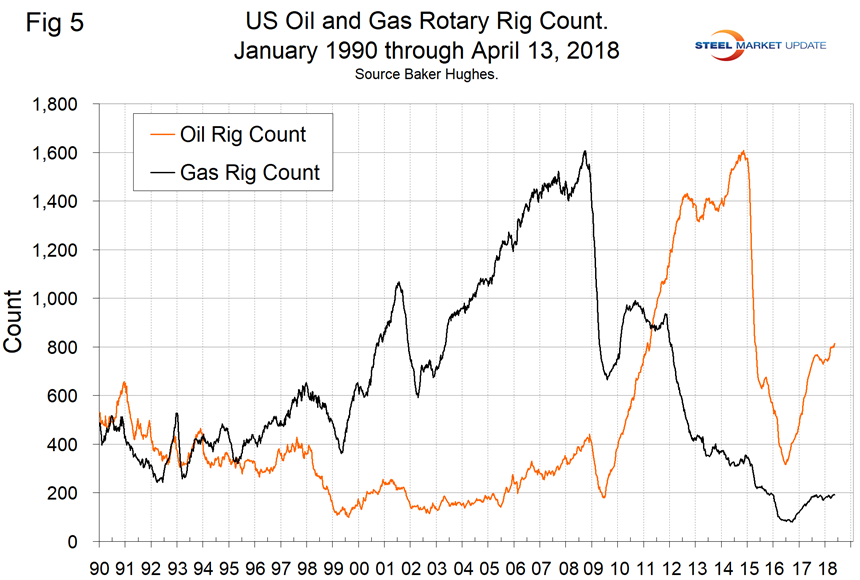
In the week ending April 13, the total onshore count increased by 5 and is up by 73 rigs year to date. The oil rig count had a low point of 316 on June 27, 2016, and stood at 815 on April 13, 2018. The U.S. gas rig count rose from its low point of 81 on Aug. 5, 2016, to 192 on April 13. The year-over-year growth rate of U.S. total rigs was 19.0 percent in the latest data. Figure 5 shows the Baker Hughes U.S. Rotary Rig Counts for oil and gas equipment in the U.S. (explanation below).
On a regional basis in the U.S., the big three states for operating rigs are Texas, Oklahoma and North Dakota. Figure 6 shows the land rig count in those states since 2000 and that non-conventional drilling in North Dakota has declined by 70 percent from its heyday in late 2014. This is not as bad as it sounds because previously drilled and capped wells are being put back on stream. In fact, the North Dakota active count has increased by seven since the beginning of March.
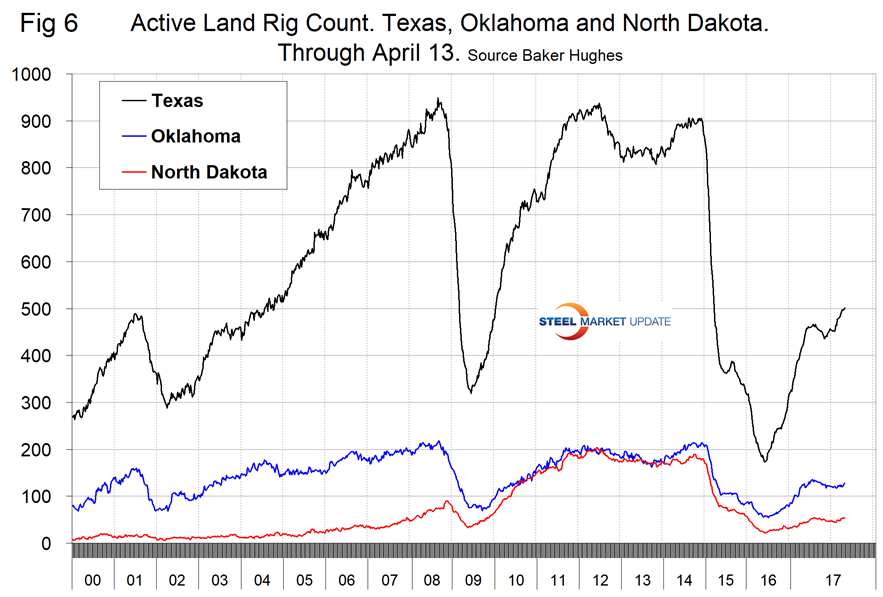
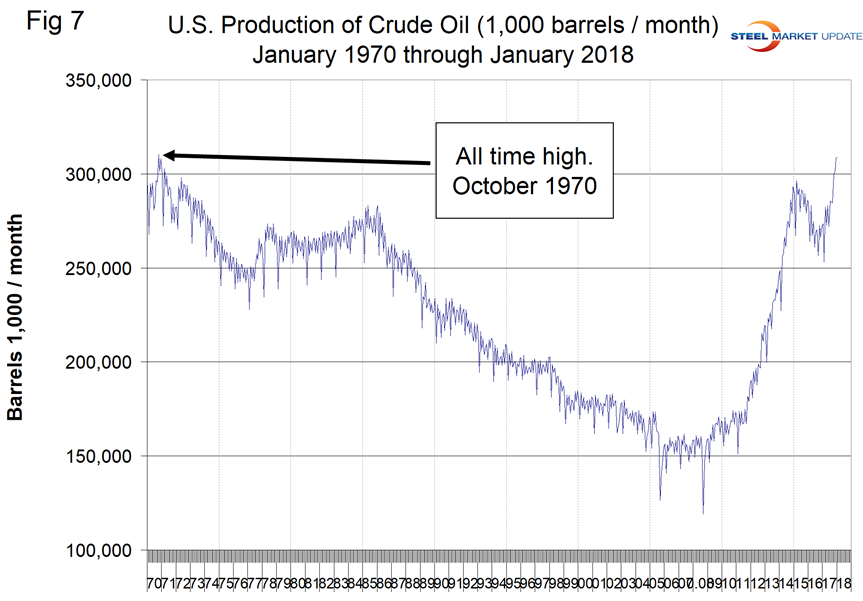
Figure 7 illustrates the monthly U.S. oilfield production of crude from January 1970 through January 2018 (latest data available). The all-time high was 310.4 million barrels in November 1970. In January 2018, production was 308.9 million barrels.
On April 16, the EIA released its drilling productivity report, which anticipates shale oil production growth from 5,820,000 barrels per day in 2017 to 9,019,000 barrels per day in 2020. HFI Research wrote: “It is evident from this EIA update that the majority of the upward revision comes as a result of higher well completion levels at the Eagle Ford. According to EIA, well completions increased to 160 wells per month in March, up 15 per month from January 2018. As a result, we have revised higher well completion activity throughout 2018 to 2020. Other minor revisions included slightly higher oil production per well in the Bakken and slightly higher well completion activity in Niobrara, offset by lower oil production per well. Overall, this report shows U.S. oil production on pace to average ~100k barrels per day growth per month, and the exit production for 2018 remains on pace for ~11.25 million barrels per day.” Figure 8 shows the location of the major shale producing regions in the U.S.
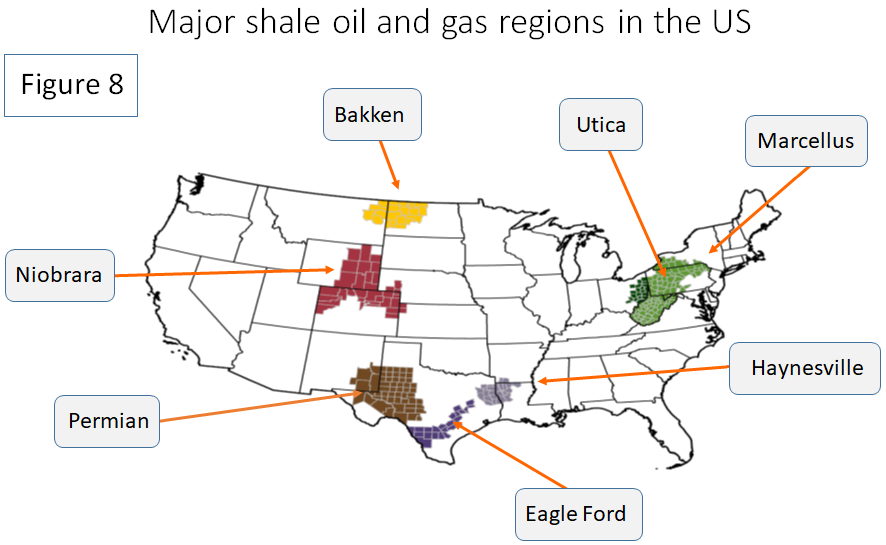
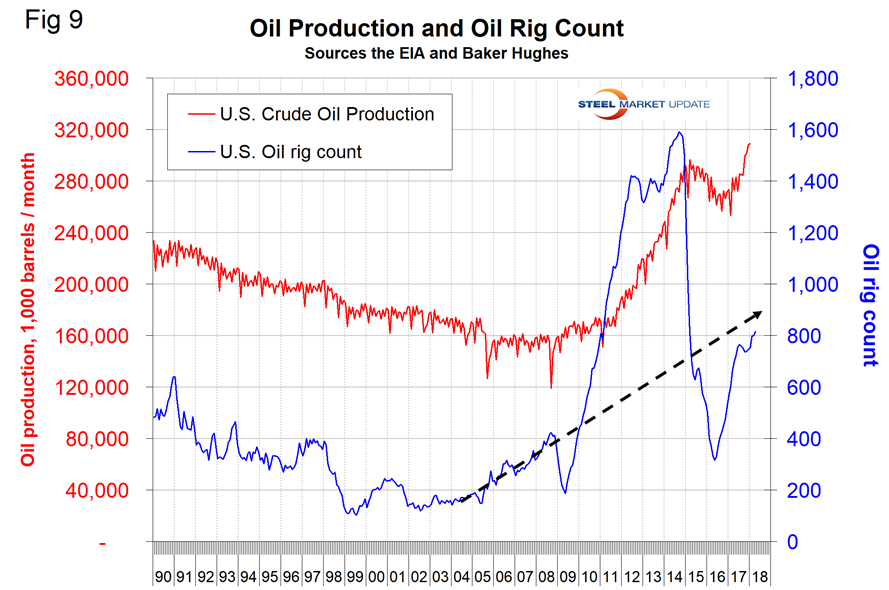
Figure 9 compares oil production and the oil rig count and shows how the increase in exploratory wells drove production from 2009 through late 2014 when the oil price collapsed. The subsequent decline in production was much less marked and is again increasing. Our take on this is that the huge increase in exploratory oil rigs beginning in 2009 may have been an anomaly and that we won’t see a repeat of the number operating in 2014 for a very long time.
Baker Hughes Rotary Rig Count: This is a weekly census of the number of drilling rigs actively exploring for or developing oil or natural gas in the United States. Rigs are considered active from the time they break ground until the time they reach their target depth and may be establishing a new well or sidetracking an existing one. The Baker Hughes Rotary Rig count includes only those rigs that are significant consumers of oilfield services and supplies.


