

Market Data

April 30, 2018
WSA: Global Steel Demand to Top 1.6 Billion Tons
Written by Peter Wright
Global steel demand will reach 1,616.1 million tons in 2018, an increase of 1.8 percent over 2017, estimates the World Steel Association in its spring Short Range Outlook. In 2019, WSA forecasts global demand will grow by 0.7 percent to 1,626.7 million tons.
“In the next couple of years, the global economic situation is expected to remain favorable with high confidence and strengthening recovery of investment levels in advanced economies” commented WSA Chairman T.V. Narendran. “Benefitting from this, steel demand in both developed and developing economies is expected to show sustained growth momentum with risks relatively limited. However, possible adverse impact from rising trade tensions and the probable U.S. and EU interest rate movements could erode this current momentum.”
The outlook for steel demand in the U.S. remains robust on the back of strong economic fundamentals – strong consumption and investment due to high confidence, rising incomes and low interest rates. The manufacturing sector is being supported by a low dollar and increasing investment, while rising housing prices and steady nonresidential sector growth point to a healthy construction sector. Though the recent tax reform is further expected to boost steel demand through its positive impact on investment, there is some concern over a possible overheating of the economy. The announced infrastructure plan is unlikely to affect steel demand in the short term.
Global steel production grew by 4.1 percent in the three months through March, according to Steel Market Update’s analysis of the WSA data. China grew by 5.4 percent. Excluding China, the growth for world steel production was 2.8 percent. In 2018, China is increasing its share of global steel production, which now stands at 49.9 percent.
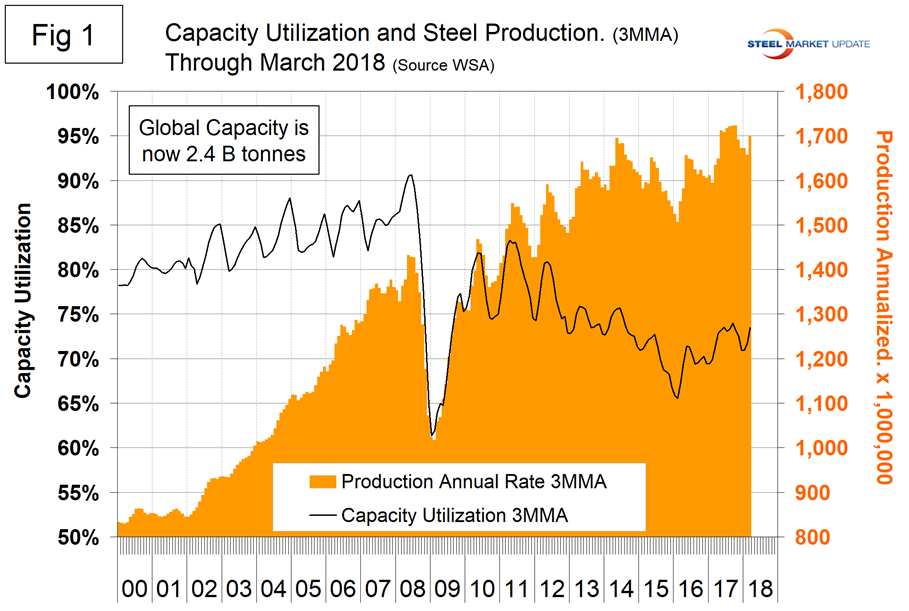
In 2017, total global steel production hit 1.687 billion metric tons, up by 5.2 percent from 2016. Production in the month of March 2018, totaled 148,330 metric tons, up from 132,386 in the short month of February. Capacity utilization in March was 74.4 percent. The three-month moving averages (3MMA) that we prefer to use were 141,732,000 metric tons and 73.5 percent, respectively.
Figure 1 shows monthly production and capacity utilization since March 2000. The summer slowdown that has occurred in each of the seven years 2010 through 2016 was delayed until November last year. On a tons-per-day basis, production in March was 4.785 million metric tons with a 3MMA of 4.725 million metric tons. This was an all-time high by both counts. In December 2016, the OECD’s steel committee estimated that global capacity would increase by almost 58 million metric tons per year between 2016 and 2018 bringing the total to 2.43 billion tons. That forecast is coming to pass as capacity is now 2.4 billion tons.
As we dig deeper, we start with seasonality. On average, global production peaked in the early summer in the years 2010 through 2016, but last year the second half downtrend was delayed until November. Figure 2 shows the average tons per day of production for each month since 2008. In those 11 years on average, March has been up by 0.84 percent; this year March was up by 1.2 percent.
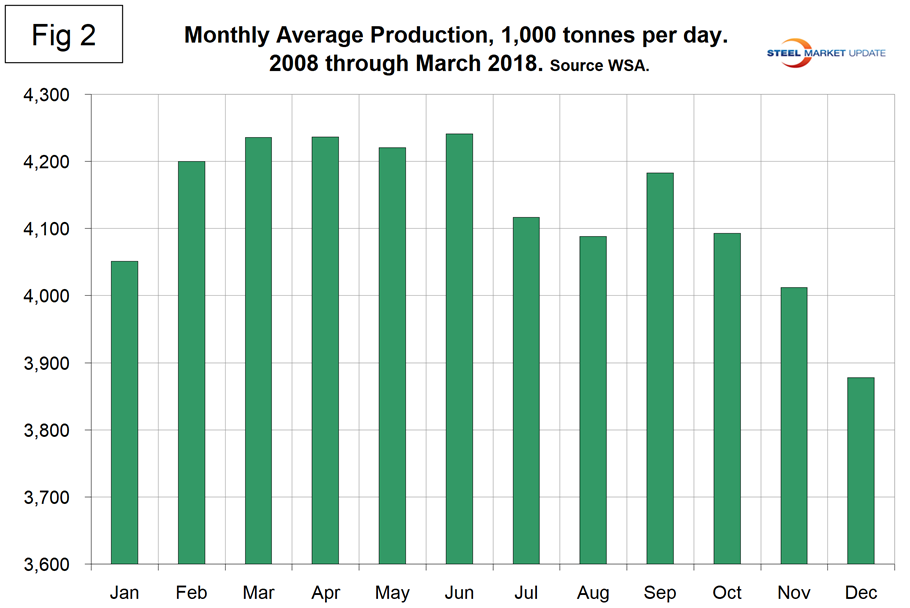
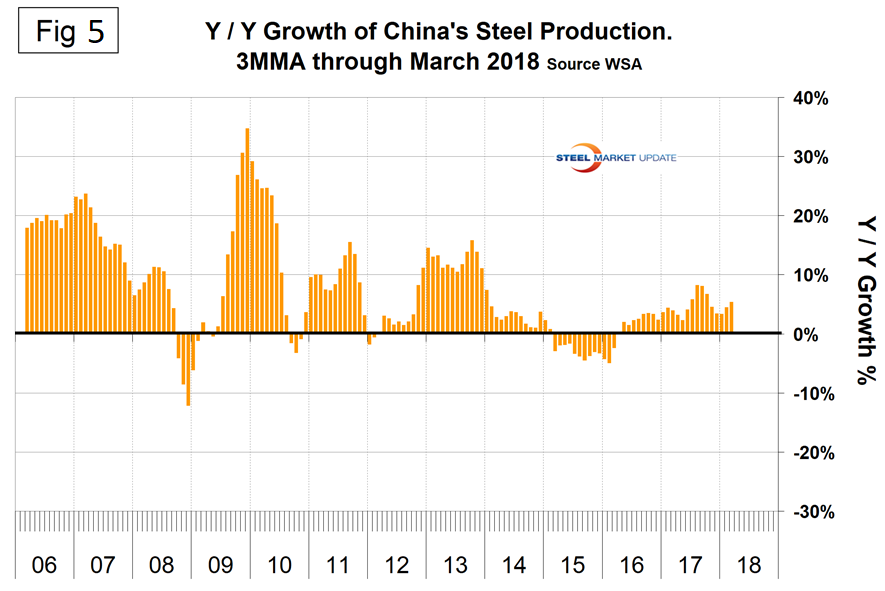
Figure 3 shows the monthly year-over-year growth rate on a 3MMA basis since January 2005. Production began to contract in March 2015 and the contraction accelerated through January 2016 when it reached negative 5.4 percent. Growth became positive in May 2016, reached a rate of 6.7 percent in September last year, then slowed every month through January before picking back up slightly in February and March.
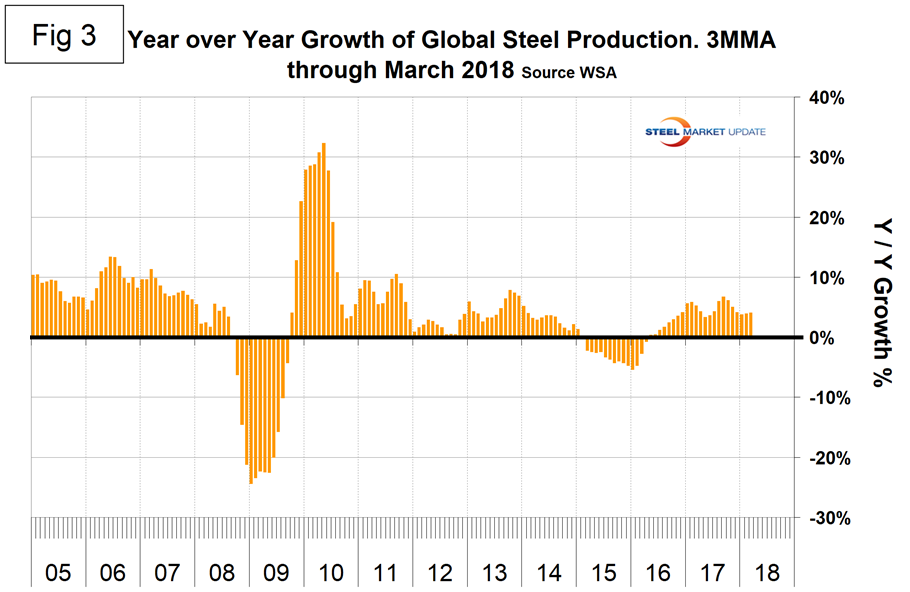
Table 1 shows global production broken down into regions, the production of the top 10 nations in the single month of March, and their share of the global total. It also shows the latest three months and 12 months of production through March with year-over-year growth rates for each period. Regions are shown in white font and individual nations in beige. The world overall had positive growth of 4.1 percent in three months and 4.6 percent in 12 months through March. When the three-month growth rate is lower than the 12-month growth rate, as it was in March, we interpret this to be a sign of negative momentum. On the same basis, China grew at 5.2 percent and 5.4 percent, a sign of positive momentum. On a regional basis, other Europe led by Turkey had the highest growth rate. The CIS had negative growth in both three months and 12 months year over year. Table 1 shows that North America was up by 1.9 percent in three months. Within North America the U.S. was up by 2.2 percent, Canada was up by 0.6 percent and Mexico was up by 1.5 percent. In the 12 months of 2017, 115.3 million metric tons were produced in NAFTA of which 70.8 percent was produced in the U.S., 11.9 percent in Canada and 17.3 percent in Mexico.
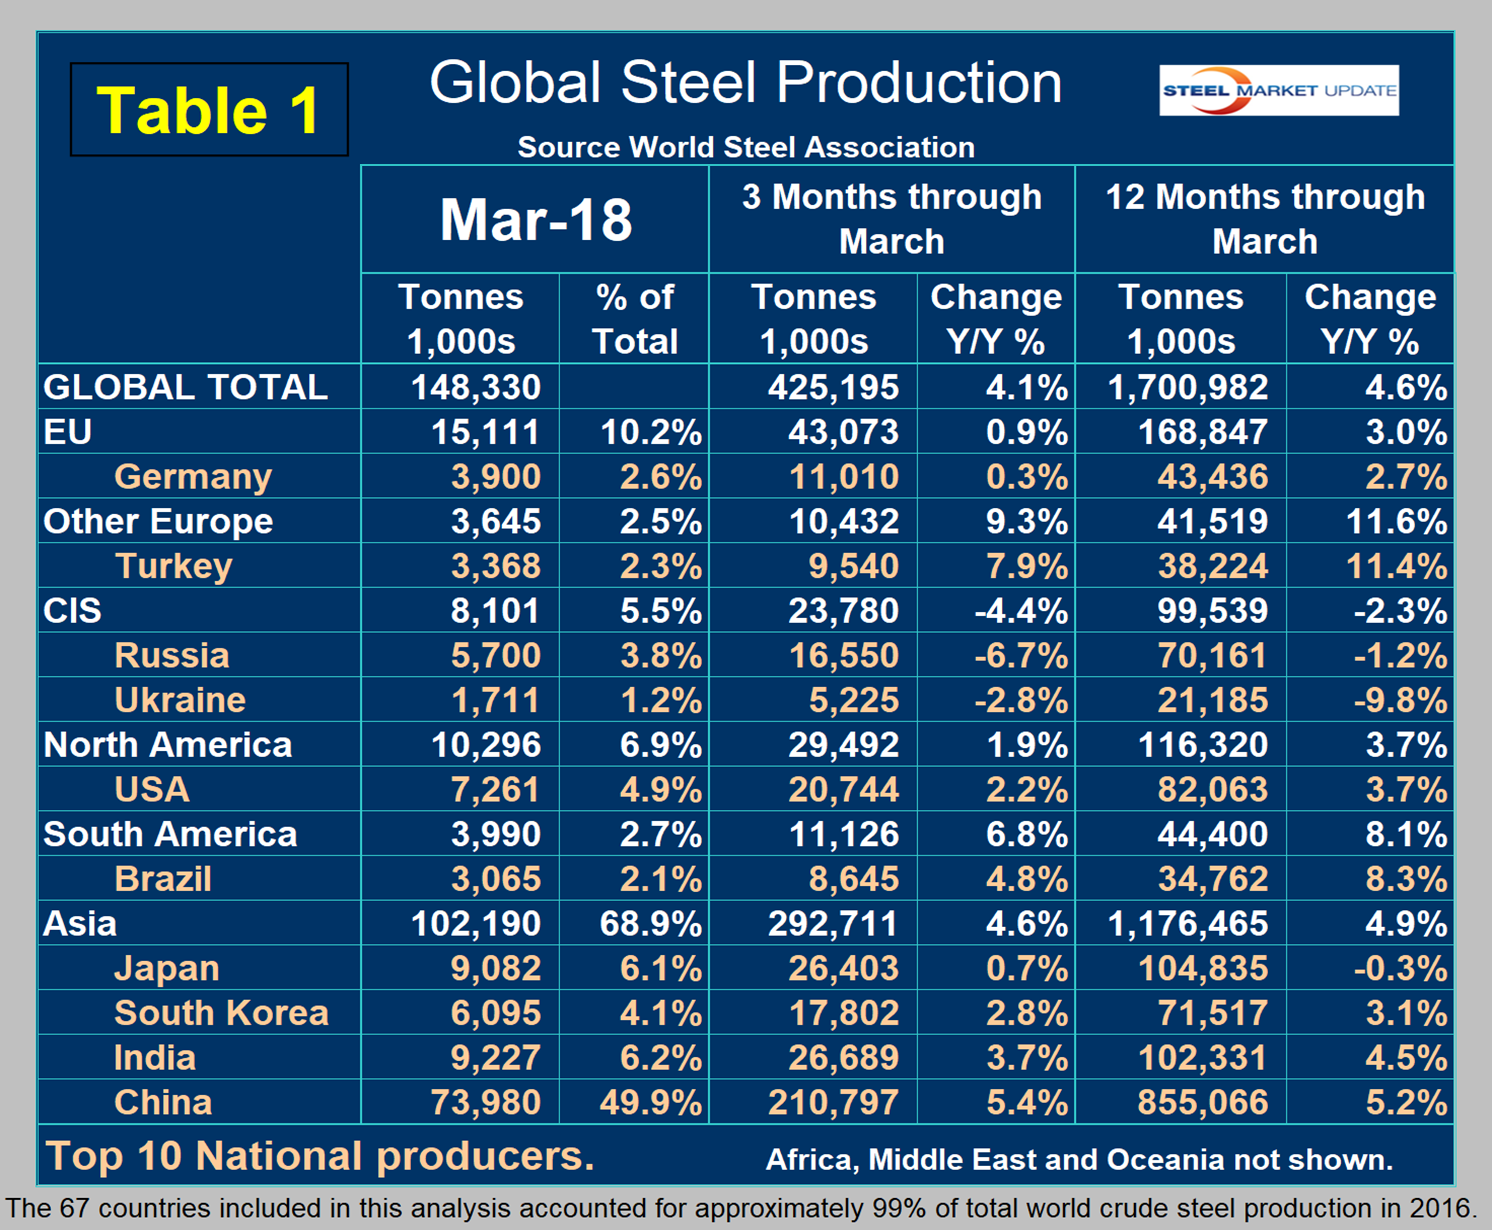
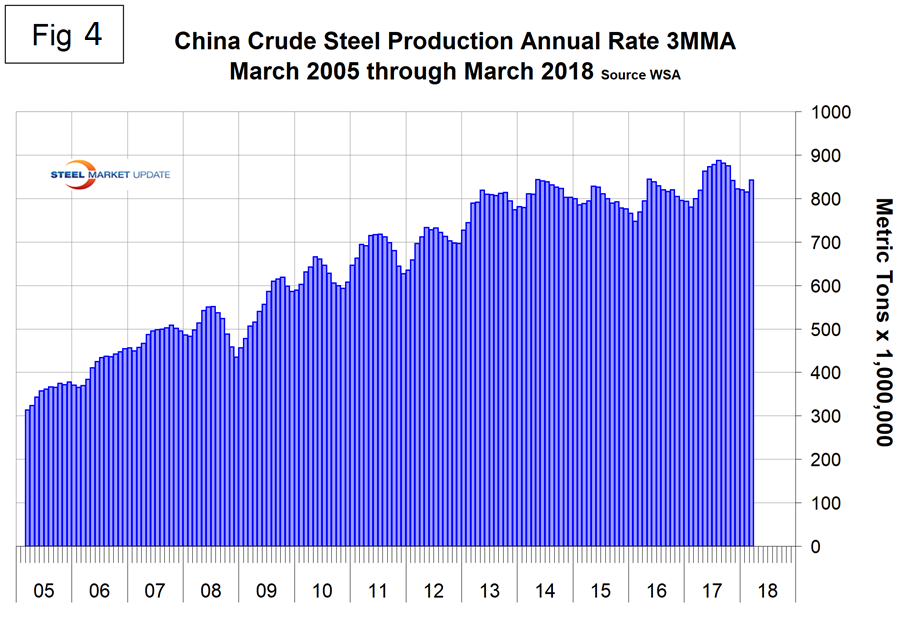
Figure 4 shows China’s production since 2005 and Figure 5 shows the year-over-year growth. In the three months through January 2018, China’s growth rate was lower than the rest of the world. That changed in February and March this year when China’s growth exceeded the rest of the world by 0.6 and 1.3 percent, respectively. It is clear that China’s much publicized reduction in capacity is not resulting in production cutbacks as capacity utilization of the operating plants has increased. In March, China produced 49.9 percent of the global total. On March 5 the National Development and Reform Commission (NDRC) said it will reduce steel capacity by around 30 million metric tons and coal output by about 150 million metric tons this year. (Note the use of the words capacity and output!) The cuts would put the country on track to meet its 2020 targets in the government’s five-year plan about two years ahead of schedule. The 2018 cuts were higher than expected, said Zhang Min, a coal market analyst at China Sublime Information Group. “Setting a high target this year showed the government is not slowing down the pace of reform for the two industries,” said Zhang.
As we have noted before in these SMU updates, cutting capacity is not the same as cutting production when capacity utilization is as low as it is today.
The April WSA Short Range Outlook for apparent steel consumption in 2018 and 2019 is shown by region in Figure 6. WSA is one of the largest industry associations in the world. Members represent approximately 85 percent of the world’s steel production, including over 160 steel producers, national and regional steel industry associations and steel research institutes.
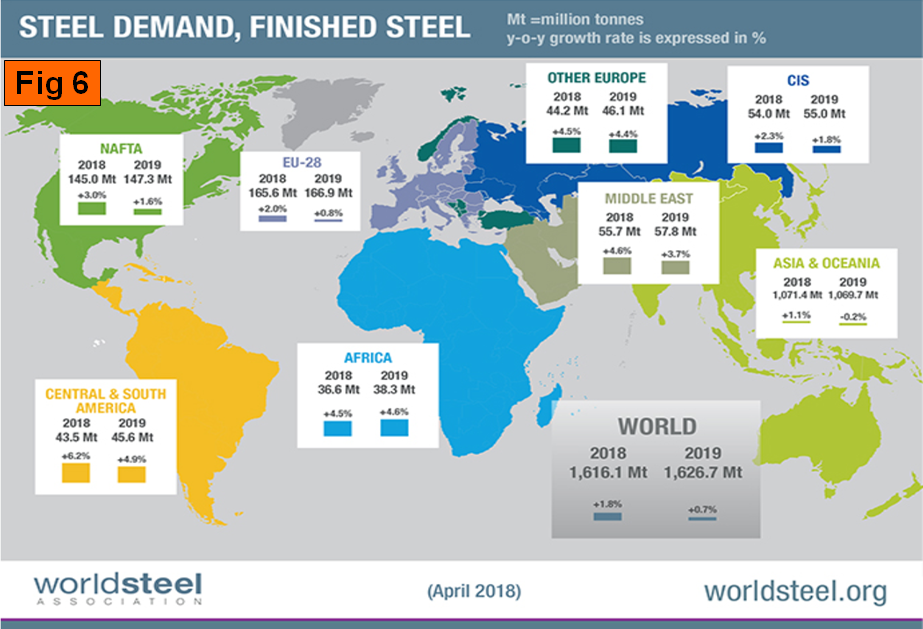
SMU Comment: If present trends continue, Chinese pressure on the global steel market will worsen. WSA increased its forecast for steel consumption in 2018 from 1,548.5 million metric tons in its April 2017 forecast to 1,616.1 million metric tons in its April 2018 forecast. This would be a projected growth of 1.8 percent in 2018, which based on the present momentum seems about right. In its April forecast, the IMF raised its projection for global growth in 2018 and 2019, which will have a positive effect on global steel consumption, particularly in the developing world.


