

Analysis

May 3, 2018
March CPIP Data Shows Growth in Construction Spending
Written by Peter Wright
Total construction spending has expanded for seven straight months, according to Steel Market Update’s latest analysis of Department of Commerce data. The growth of total construction on a rolling 12-month basis year over year increased from 2.1 percent in January to 2.2 percent in February to 2.3 percent in March this year. On a rolling three-month year-over-year basis, the situation is much better with growth improving every month from August through March when it reached 4.8 percent.
Construction expenditures data is developed by the Department of Commerce and is referred to as CPIP (construction put in place). Since construction is extremely seasonal, the growth or contraction we report in this analysis has had seasonality removed by providing only year-over-year comparisons.
At SMU, we analyze the CPIP data with the intent to provide a clear description of activity we believe accounts for about 45 percent of total U.S. steel consumption. See the end of this report for more detail on how we perform this analysis and structure the data. Note that we present non-seasonally adjusted numbers and we don’t include expenditures for residential improvements. Our rationale is that construction is highly seasonal and our businesses function in a seasonal world, and home improvements don’t consume much steel. For these reasons, our results may not align with other sources.
Total Construction
Total construction expanded by 4.8 percent in three months through March year over year, which has increased steadily from 0.5 percent in August last year. On a rolling 12-months basis year over year, growth in March was 2.3 percent. Since the three-month growth rate is higher than the 12-month rate, we conclude that momentum is positive. March construction expenditures totaled $83.5 billion, which breaks down to roughly $62.8 billion of private work, $18.2 billion of state and locally funded (S&L) work, and $2.6 billion of federally funded work (Table 1). Growth trend columns in all four tables in this report show momentum.
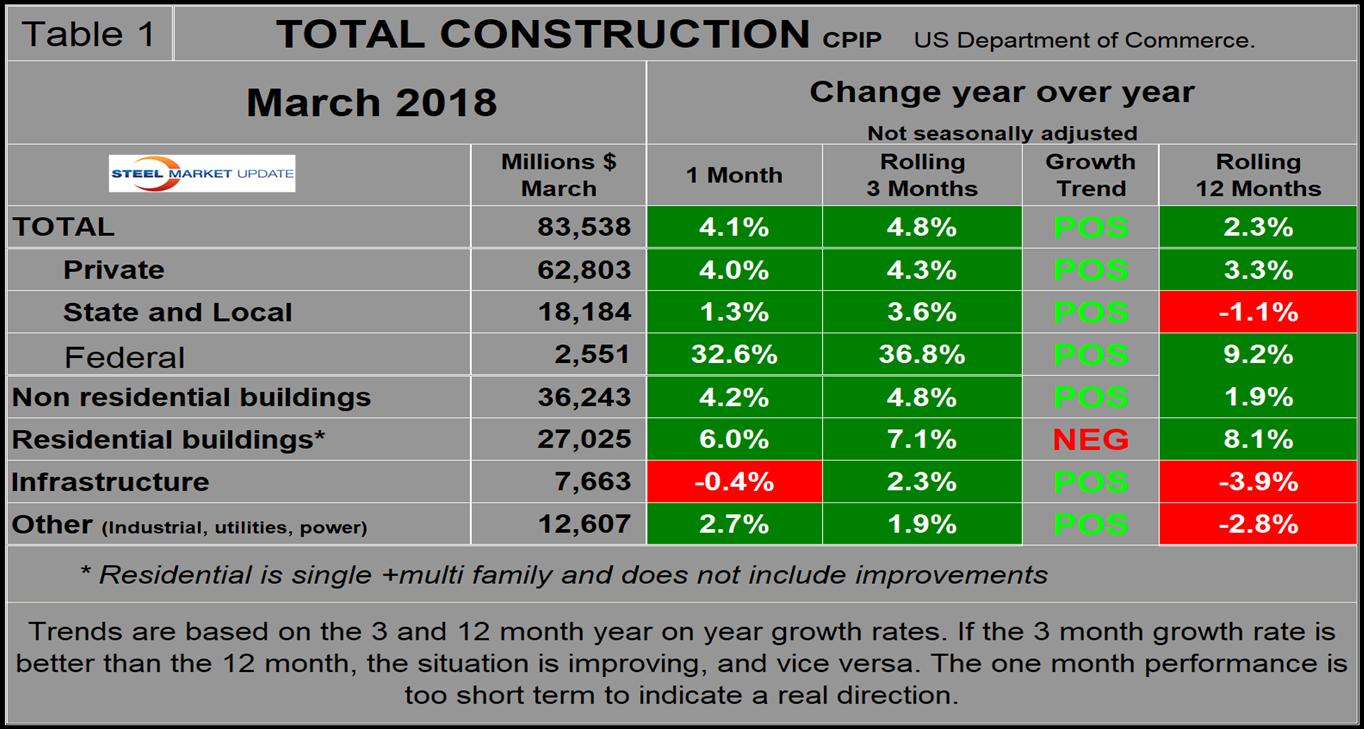
Figure 1 shows total construction expenditures on a rolling 12-month basis as the blue line and the rolling three-month year-over-year growth rate as the brown bars. Total construction is at an all-time high.
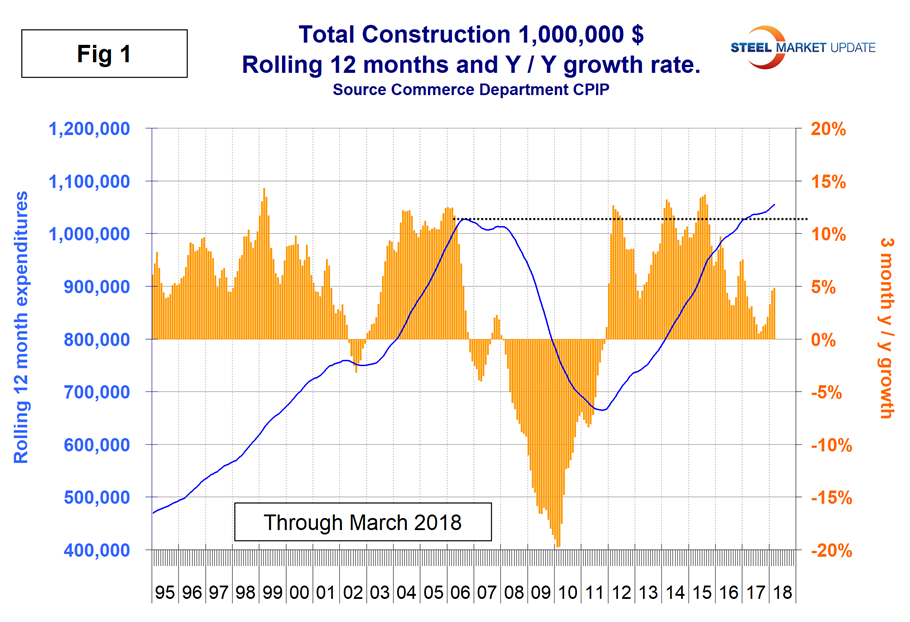
Figures 1 through 4 in this analysis have the same format, the result of which is to smooth out variation and eliminate seasonality. We consider four sectors within total construction. These are nonresidential, residential, infrastructure and other. The latter is a catchall and includes industrial, utilities and power. Of these four sectors, only residential buildings had negative momentum in the February data, which was the same as the January and February results.
The pre-recession peak of total construction on a rolling 12-month basis was $1.028 trillion through November 2006. The low point was $665.1 billion in the 12 months through April 2011. In 12 months through March 2018, construction expenditures totaled $1.055 trillion. (This number excludes residential improvements; see explanation below.)
Private Construction
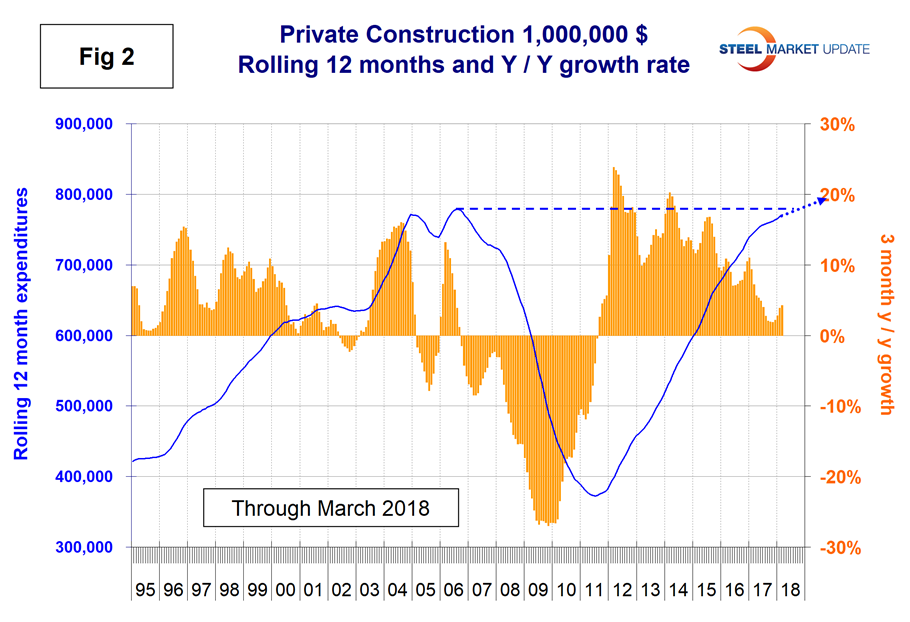
Table 2 shows the breakdown of private expenditures into residential and nonresidential and subsectors of both. The growth rate of private construction in three months through March 2018 was 4.3 percent, up from 1.9 percent in the three months through last November as shown by the brown bars in Figure 2. At the present rate, private construction will reach the pre-recession rate of expenditures by about the end of this year.
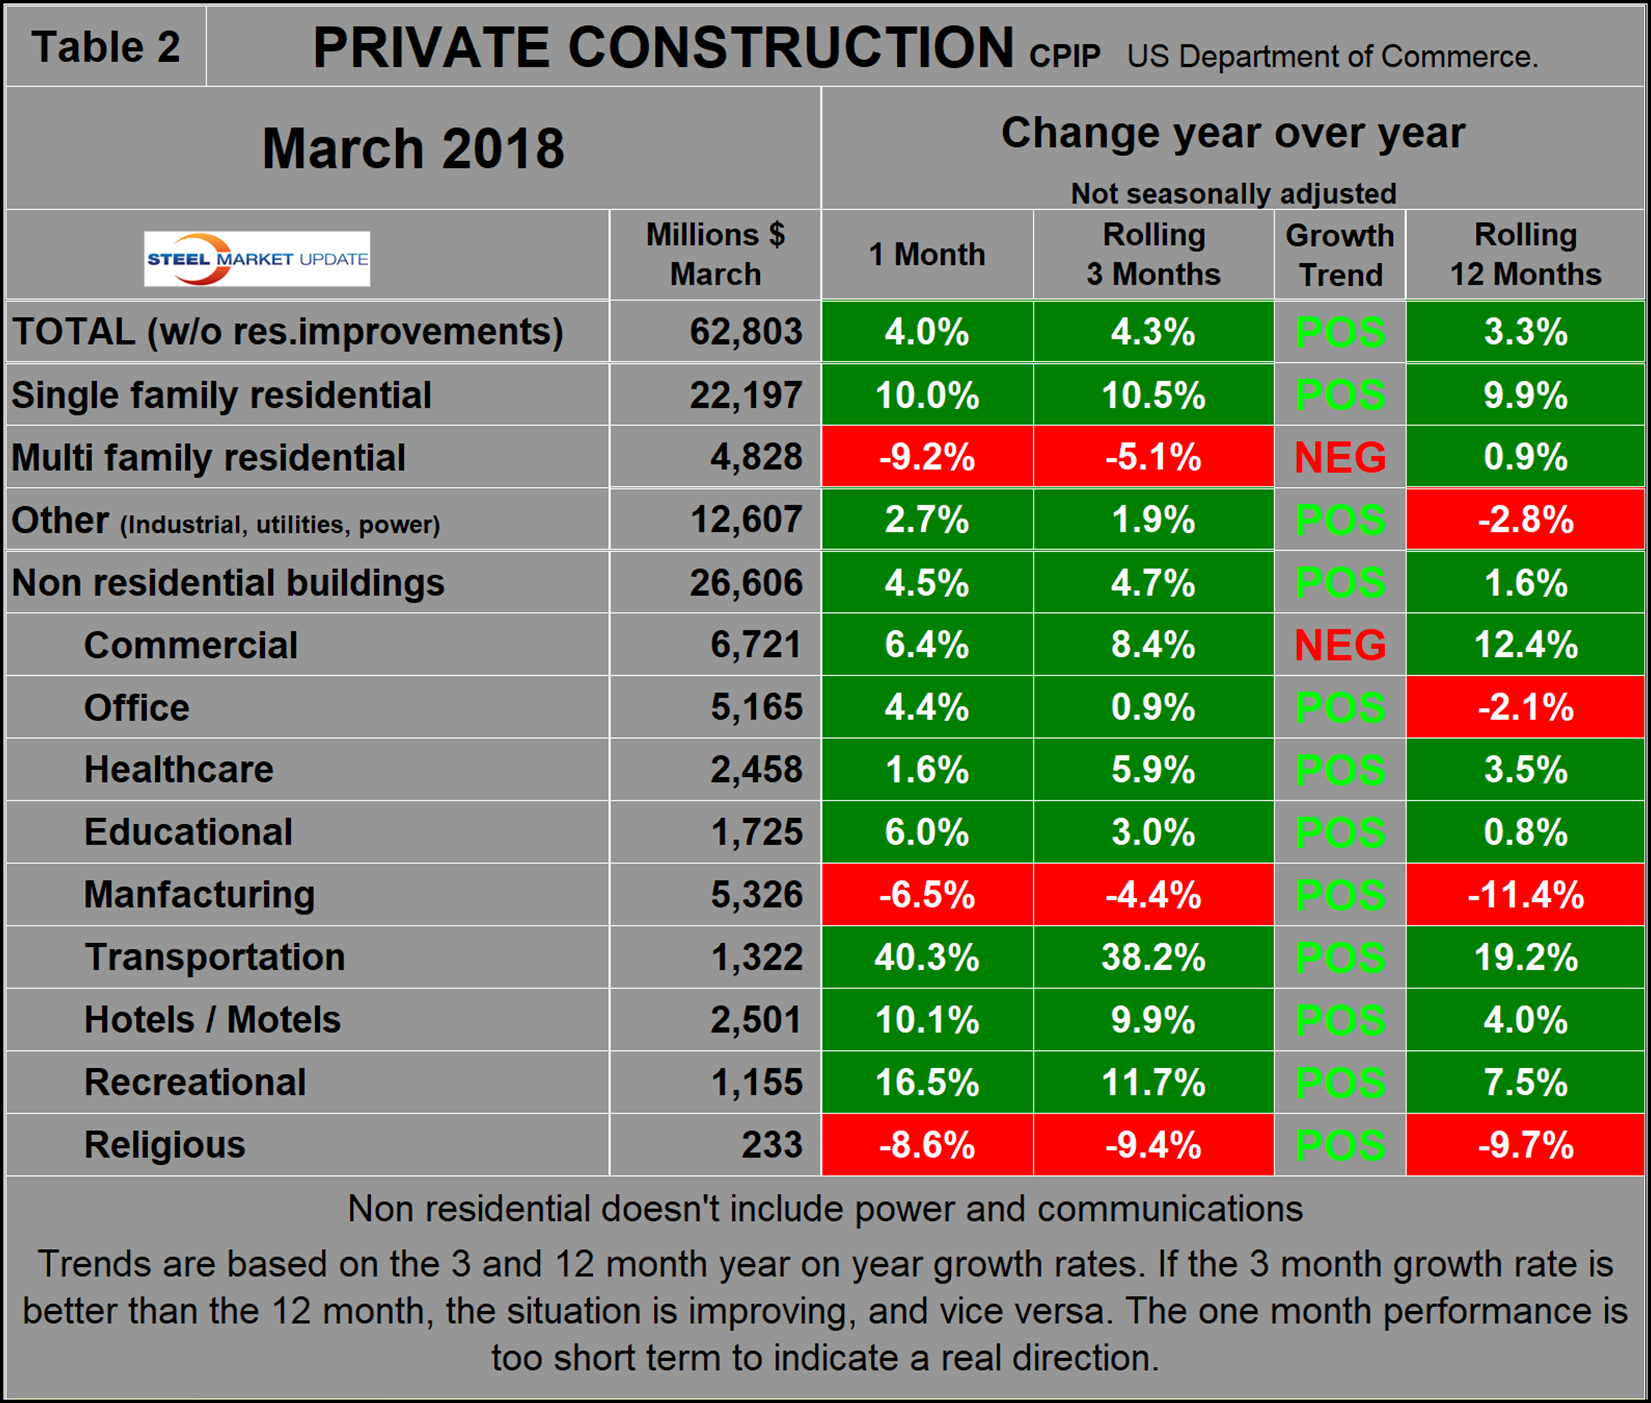
Excluding property improvements, our report shows that single-family residential grew by 10.5 percent in three months through March with positive momentum, and multifamily residential contracted by 5.1 percent with negative momentum. Homebuilder sentiment is high but has been declining since last December. In our view, the 2018 tax legislation and rising interest rates puts single-family home construction in jeopardy. The Census Bureau reports on construction starts in its housing analysis. In the starts data, the whole project is entered into the database when ground is broken. Construction put in place is based on spending work as it occurs; the value of a project is spread out from the project’s start to its completion. Single-family starts grew at 5.0 percent in the three months through March, which was lower than the growth rate of CPIP. Multifamily starts contracted by 2.3 percent in March.
Within private nonresidential buildings, all sectors except commercial (mainly stores) had positive momentum. The first quarter Federal Reserve Senior Loan Officer Survey indicated there is currently a net decrease in demand for construction and land development loans and that loan terms are tightening. The Fed survey reviews changes in the terms of, and demand for, bank loans to businesses on a quarterly basis based on the responses from 73 domestic banks and 24 U.S. branches and agencies of foreign banks.
State and Local Construction
S&L work expanded by 3.6 percent in the rolling three months through March year over year with positive momentum. However, the months December through March were the first with positive growth since May 2016 (Table 3). The improvement was driven by nonresidential buildings. The overall S&L figure includes both nonresidential buildings and infrastructure.
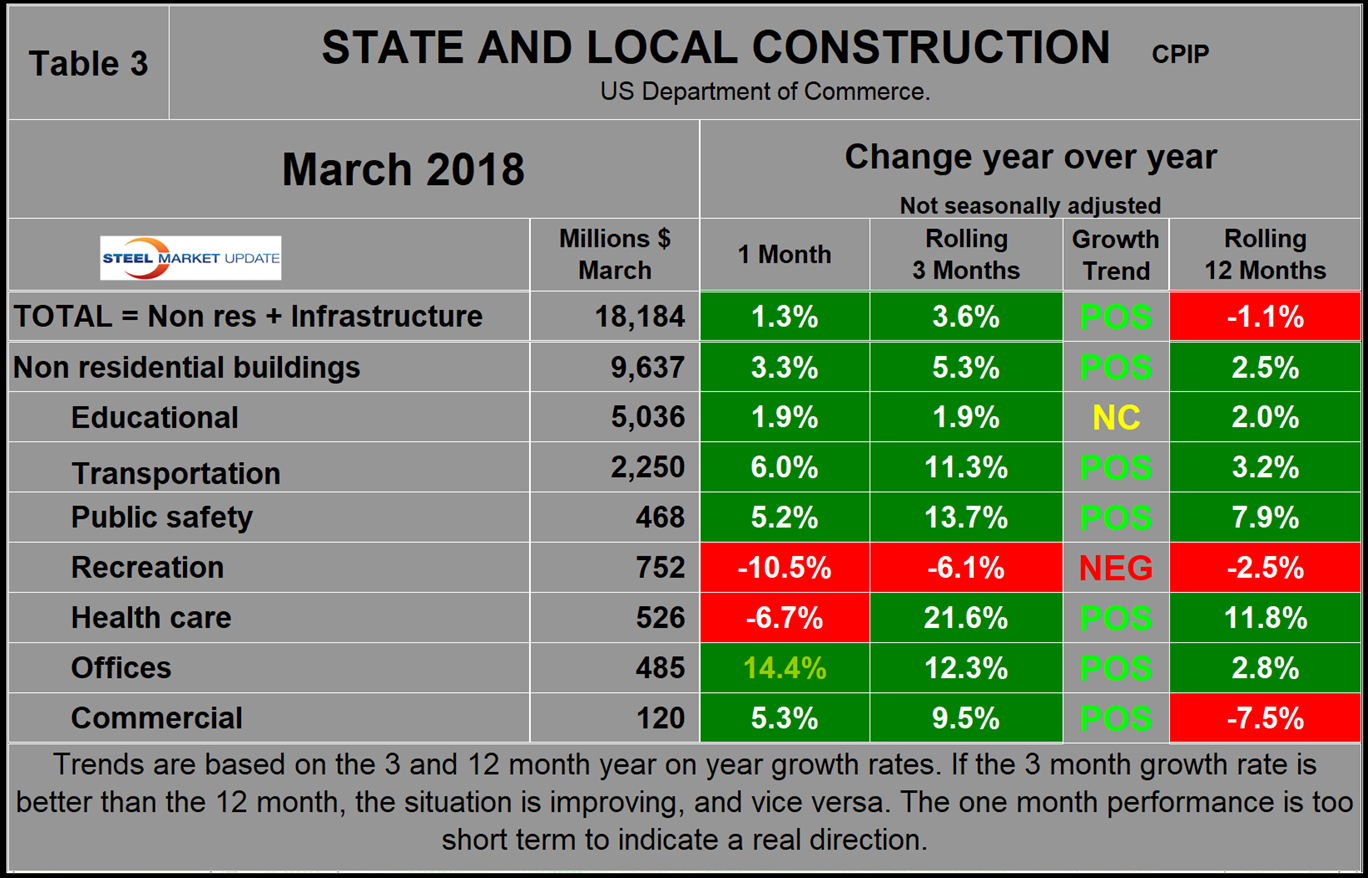
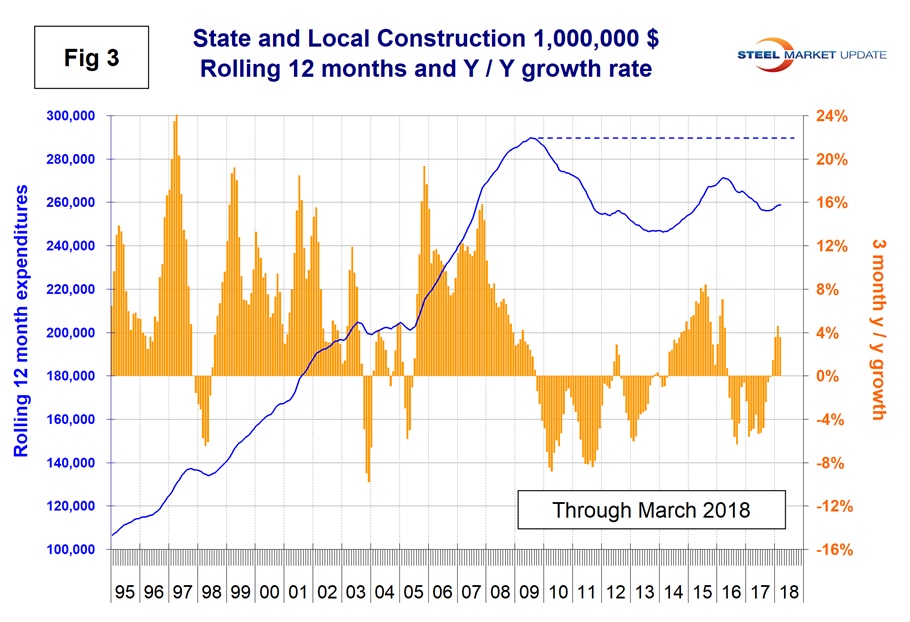
Figure 3 shows that S&L nonresidential buildings expanded by 5.3 percent in three months through March, down from 7.0 percent in February, which was the best result since September 2015. Total S&L nonresidential buildings slumped in the period May 2016 through September 17, therefore our year-over-year comparisons will probably look good for the next few months. Educational buildings are by far the largest subsector of S&L nonresidential at $5.036 billion in March and experienced a 1.9 percent positive growth on a rolling three months basis with zero momentum. The downturn in S&L expenditures shown in Figure 3 means that a full recovery to the pre-recession level of expenditures won’t be achieved until well into the next decade.
Drilling down into the private and S&L sectors as presented in Tables 2 and 3 shows which project types should be targeted for steel sales and which should be avoided. There are also regional differences to be considered, data for which is not available from the Commerce Department.
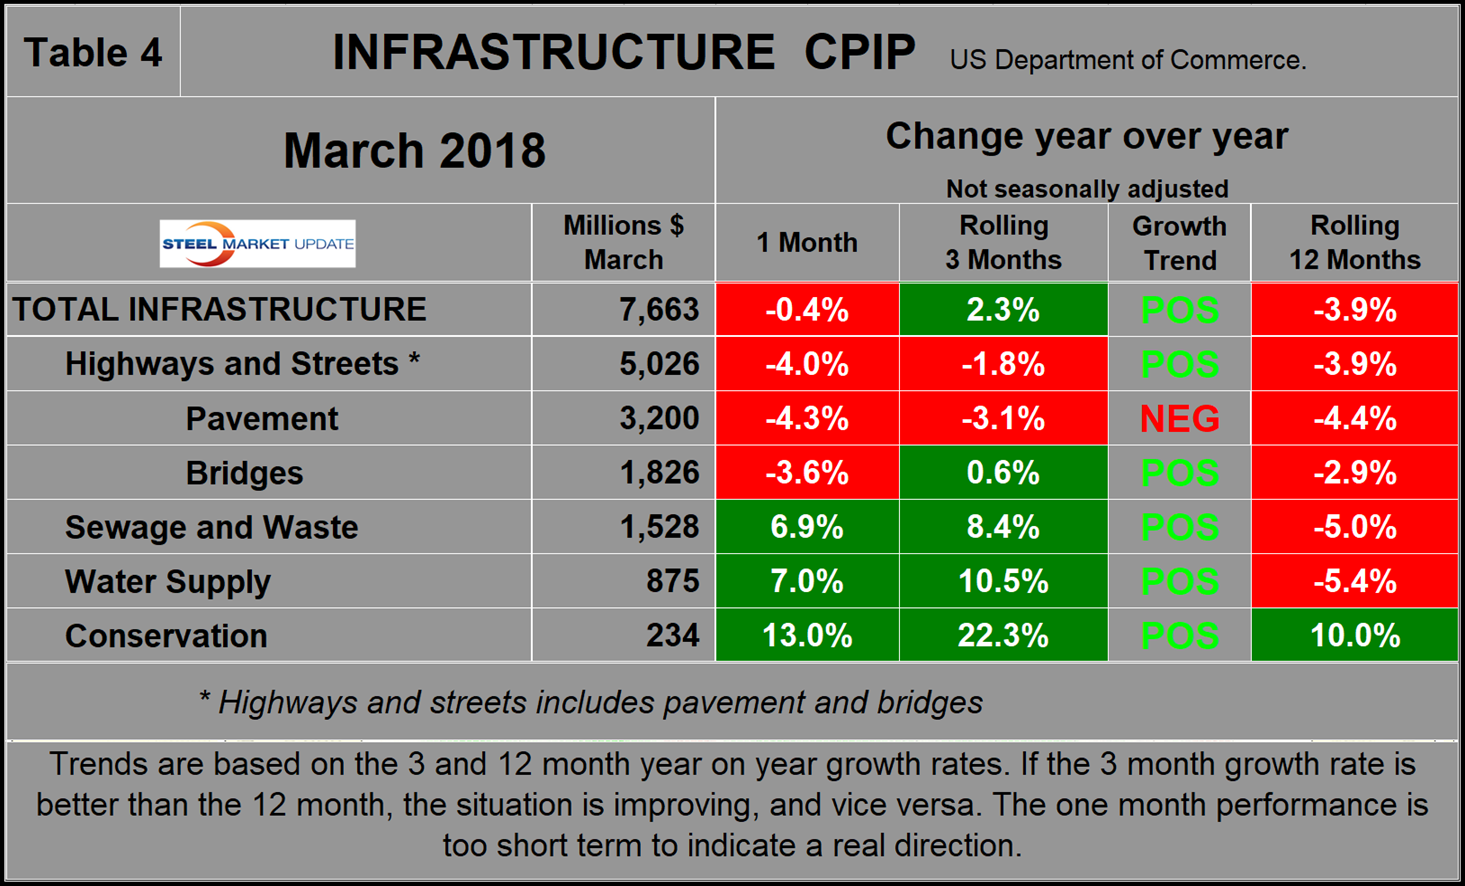
Infrastructure
Infrastructure expenditures had positive growth in the first eight months of 2016, then declined every month through January 2018. February 2018 had a 2.0 percent positive growth and March had 2.3 percent. Highways and streets including pavement and bridges account for about two-thirds of total infrastructure expenditures. Highway pavement is the main subcomponent of highways and streets and had a 3.1 percent contraction in three months through March. Bridge work contracted by 3.6 percent, down from a 7.9 percent growth rate in December (Table 4).
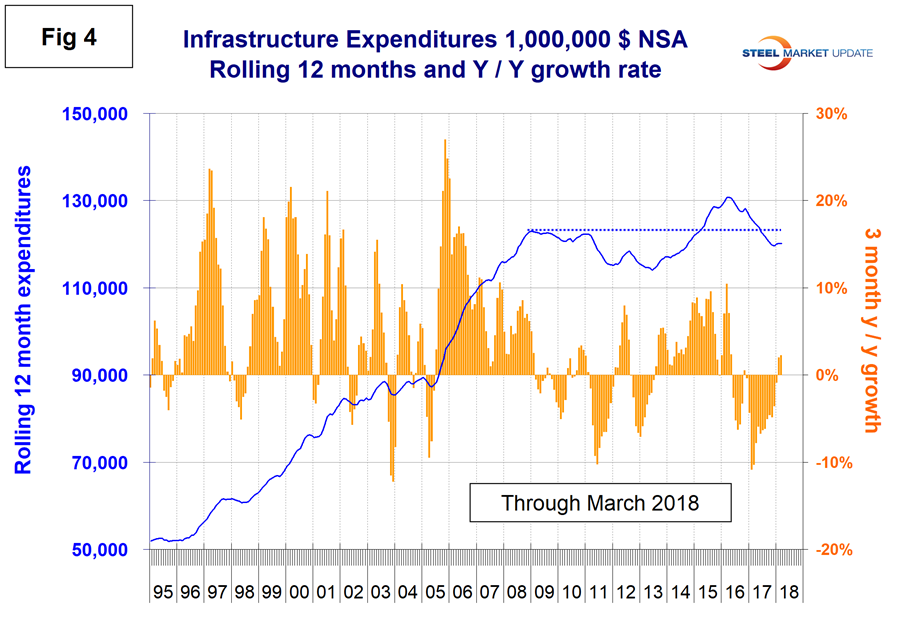
Infrastructure expenditures had a recent peak in the rolling 12 months through April 2016 and have since declined to a level lower than the previous peak in March 2009 (Figure 4).
Total Building Construction Including Residential
Figure 5 compares year-to-date expenditures for building construction for 2017 and 2018. Single-family residential is dominant and in the 12 months of 2017 totaled $264.5 billion, up from $242.5 billion in 2016. It seems likely that the 2018 tax bill, by its reduction in the deductibility of mortgage interest and local taxes, will negatively affect single-family home construction.
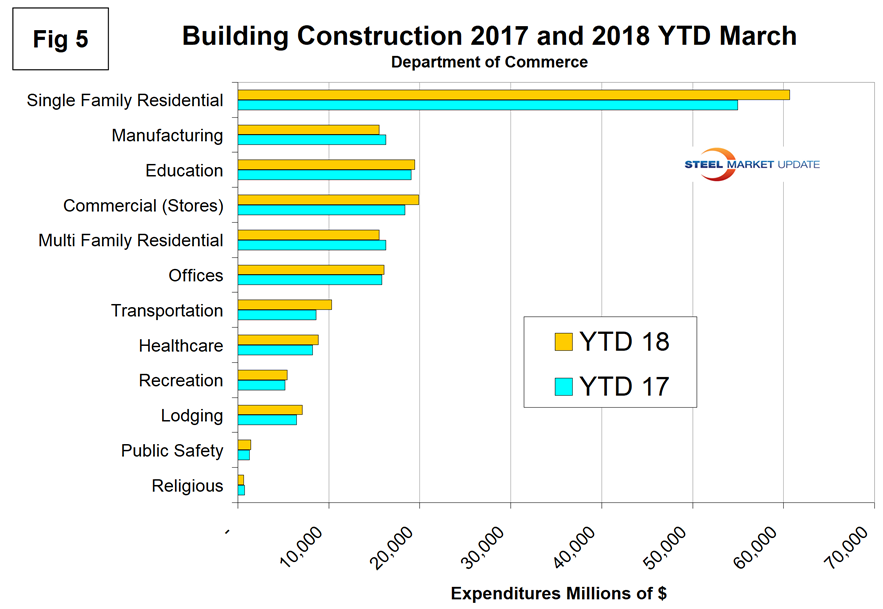
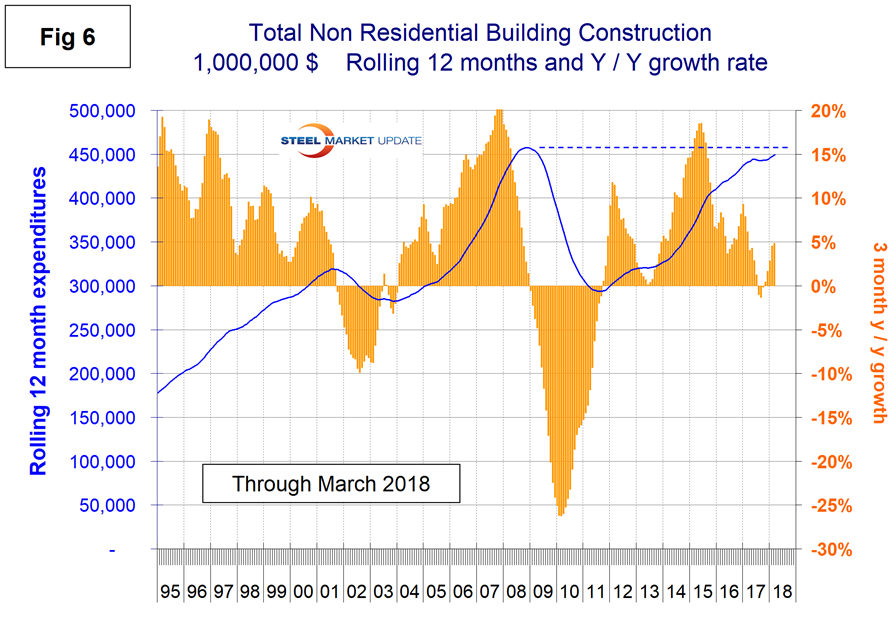
Figure 6 shows total expenditures and growth of nonresidential building construction. Growth slowed in January through July last year, went negative in August through October, then became increasingly positive in November through March 2018.
The American Institute of Architects reported on April 21 that architecture firm billings rose for the sixth consecutive month in March, although the pace of growth slowed modestly from February. Overall, the AIA’s ABI score for March was 51.0 (any score over 50 indicates billings growth), which still reflects a healthy business environment. While business conditions softened somewhat at firms located in the Northeast region, billings remained strong at firms located in the South and West regions. “New project activity coming into architecture firms continues to grow at a solid pace. As a result, project backlogs—in excess of six months at present—are at their highest post-recession level,” said AIA Chief Economist Kermit Baker. “Business remains strong in the South and West, and firms with a residential specialization continue to set the pace.”
Explanation: Each month, the Commerce Department issues its construction put in place (CPIP) data, usually on the first working day covering activity one month and one day earlier. Construction put in place is based on spending work as it occurs, estimated for a given month from a sample of projects. In effect, the value of a project is spread out from the project’s start to its completion. This is different from the starts data published by the Census Bureau for residential construction, by Dodge Data & Analytics and Reed Construction for nonresidential, and Industrial Information Resources for industrial construction. In the case of starts data, the whole project is entered to the data base when ground is broken. The result is that the starts data can be very spiky, which is not the case with CPIP.
The official CPIP press release gives no appreciation of trends on a historical basis and merely compares the current month with the previous one on a seasonally adjusted basis. The background data is provided as both seasonally adjusted and non-adjusted. The detail is hidden in the published tables, which SMU tracks and dissects to provide a long-term perspective. Our intent is to provide a route map for those subscribers who are dependent on this industry to “follow the money.” This is a very broad and complex subject, therefore to make this monthly write-up more comprehensible, we are keeping the information format as consistent as possible. In our opinion, the absolute value of the dollar expenditures presented are of little interest. What we are after is the magnitude of growth or contraction of the various sectors. In the SMU analysis, we consider only the non-seasonally adjusted data. We eliminate seasonal effects by comparing rolling three-month expenditures year over year. CPIP data also includes the category of residential improvements, which we have removed from our analysis because such expenditures are minor consumers of steel.
In the four tables included in this analysis, we present the non-seasonally adjusted expenditures for the most recent data release. Growth rates presented are all year over year and are the rate for the single month’s result, the rolling three months and the rolling 12 months. We ignore the single month year-over-year result in our write-ups because these numbers are preliminary and can contain too much noise. The growth trend columns indicate momentum. If the rolling three-month growth rate is stronger than the rolling 12 months, we define that as positive momentum, or vice versa. In the text, when we refer to growth rate, we are describing the rolling three-month year-over-year rate. In Figures 1 through 4 and 6, the blue lines represent the rolling 12-month expenditures and the brown bars represent the rolling three-month year-over-year growth rates.


