

Market Data

May 8, 2018
BLS Data Shows Job Creation Increase in April
Written by Peter Wright
Employment increases in manufacturing and construction are signposts for steel sales activity. 2018 is starting off well.
Rising employment and wages are the basis of GDP growth because personal consumption accounts for almost 70 percent of GDP. Steel consumption is related to GDP; therefore, we need to be aware of changes to the employment picture. Net job creation in April as reported by the Bureau of Labor Statistics (BLS) on Friday was up by 21 percent from March’s upwardly revised count. In this context, net means the difference between gains and losses, which are both much larger numbers than we are used to considering. Over a seven-year period, gains averaged 7,211,000 per quarter as losses averaged 6,597,000 on the same basis.
Figure 1 shows the 3MMA of the number of jobs created monthly since 2000 as the brown bars and the total number employed as the black line. These numbers are seasonally adjusted by the BLS, which has been criticized in the past for the ineffectiveness of its seasonal adjustment calculations.

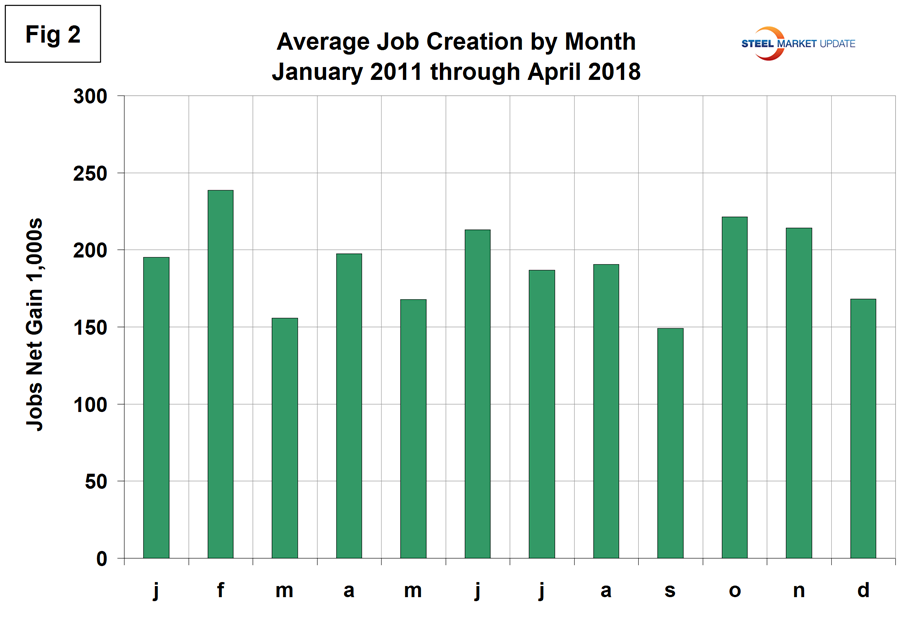
To examine if any seasonality is left in the data after adjustment, we have developed Figure 2. In the eight years since and including 2011, March has been the second lowest job creation month of the year, which we attribute to poor seasonal adjustment. On average in those years, April has increased by 27 percent. This year, April rose by 21 percent, therefore fairly typical. In the April report, job creation in March was revised up by 32,000 and February down by 2,000 jobs.
Total nonfarm payrolls are now 10,059,000 more than they were at the pre-recession high of February 2008. Total nonfarm employment in April was 148,424,000. According to BLS data, the average workweek for all employees on private nonfarm payrolls was unchanged at 34.5 hours in April. In manufacturing, the workweek increased by 0.2 hour to 41.1 hours, while overtime edged up by 0.1 hour to 3.7 hours. The average workweek for production and nonsupervisory employees on private nonfarm payrolls increased by 0.1 hour to 33.8 hours. In April, average hourly earnings for all employees on private nonfarm payrolls rose by 4 cents to $26.84. Over the year, average hourly earnings have increased by 67 cents, or 2.6 percent. Average hourly earnings of private-sector production and nonsupervisory employees increased by 5 cents to $22.51 in April.
Unit labor costs and productivity changes are reported quarterly by the BLS and Q1 2018 data was reported in early May. The average increase in unit labor costs in the four quarters through Q1 2018 was 1.15 percent per quarter. The total change in output per hour of all nonfarm businesses was 1.3 percent in the four quarters through Q1 2018.
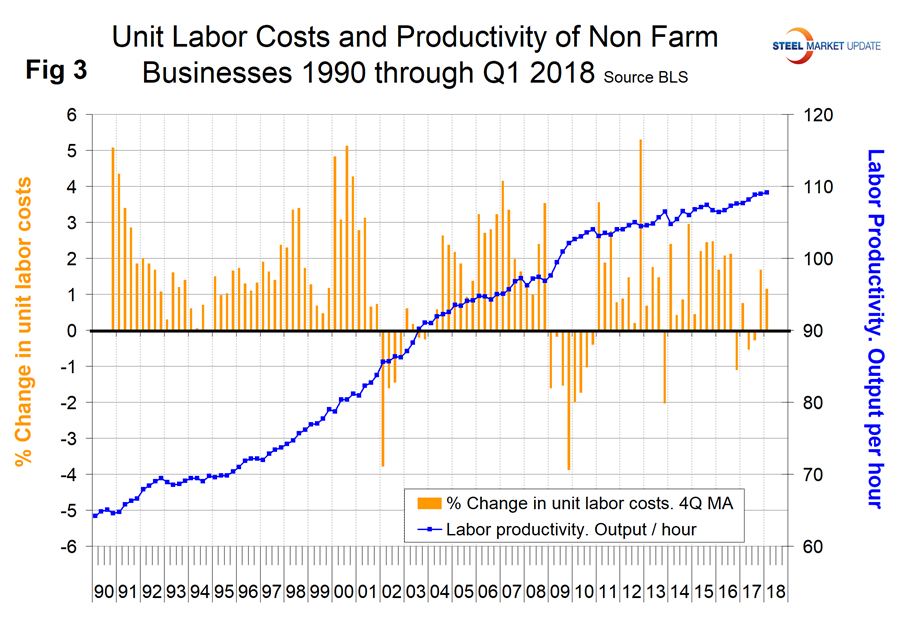
Table 1 breaks total employment down into service and goods-producing industries and then into private and government employees. Most of the goods-producing employees work in manufacturing and construction and the components of these two sectors of most relevance to steel people are broken out in Table 1.
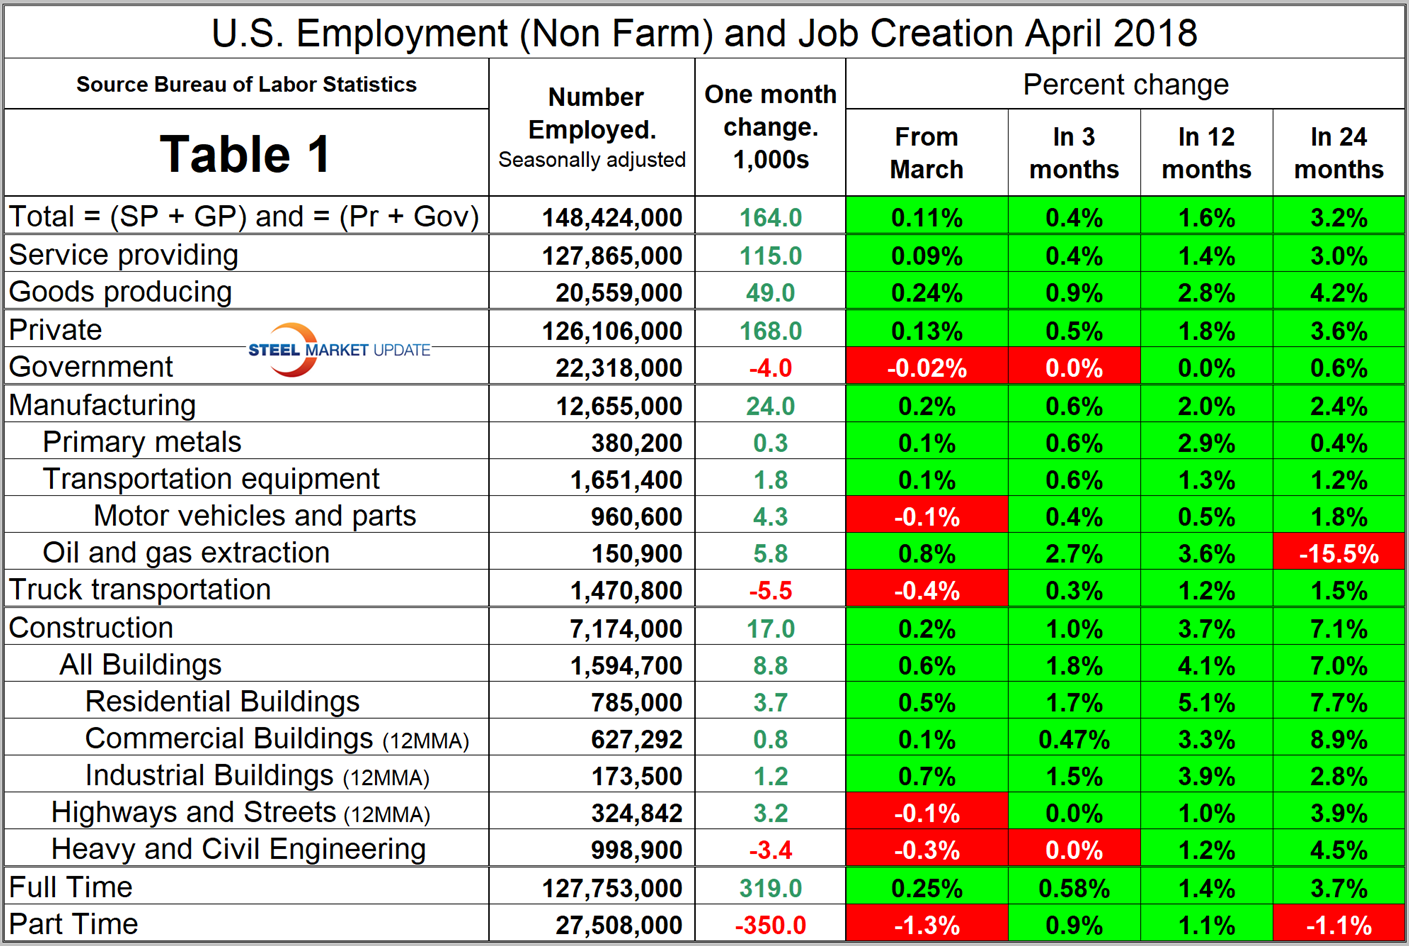
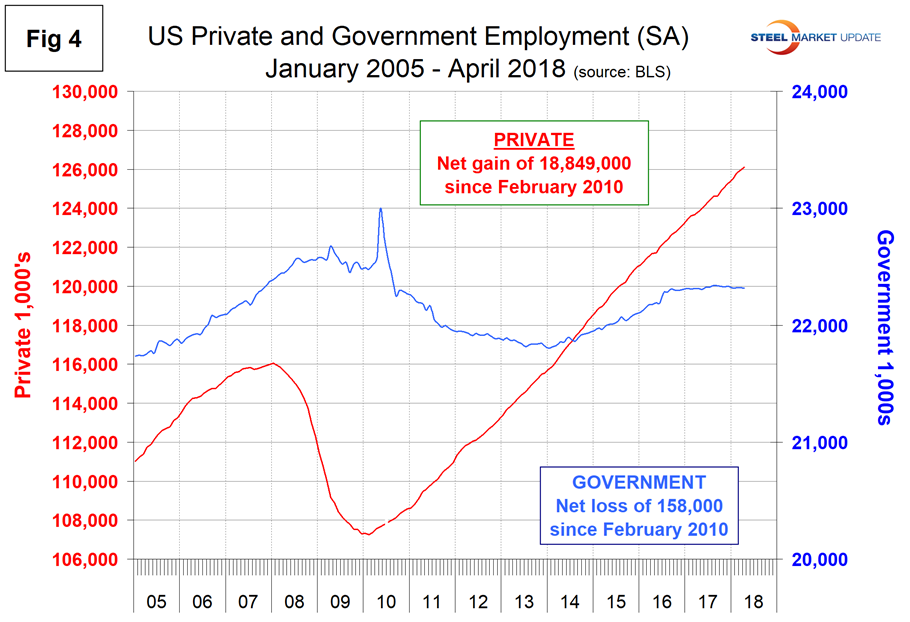
In April, 168,000 jobs were created in the private sector and government lost 4,000 jobs. The number employed by the federal government increased by 1,000 to 2.8 million, state governments lost 7,000 for a total of 5.1 million and local governments gained 2,000 to reach a total of 14.4 million. Since February 2010, the employment low point, private employers have added 18,849,000 jobs as government has lost 158,000 (Figure 4).
In April, service industries expanded by 115,000 as goods-producing industries, driven mainly by construction and manufacturing, expanded by 49,000. Since February 2010, service industries have added 15,759,000 and goods-producing 2,932,000 positions. This has been a drag on wage growth since the recession as service industries on average pay less than goods-producing industries such as manufacturing.
Table 1 shows that primary metals gained 300 jobs in April, and in the last 12 months on a percentage basis was up by almost 50 percent more than total manufacturing. Motor vehicles and parts industries were reported to have gained 4,300 jobs in April. Trucking lost 6,000 jobs in April giving back most of what had been a strong gain in March. Note, the subcomponents of both manufacturing and construction shown in Table 1 don’t add up to the total because we have only included those with the most relevance to the steel industry.
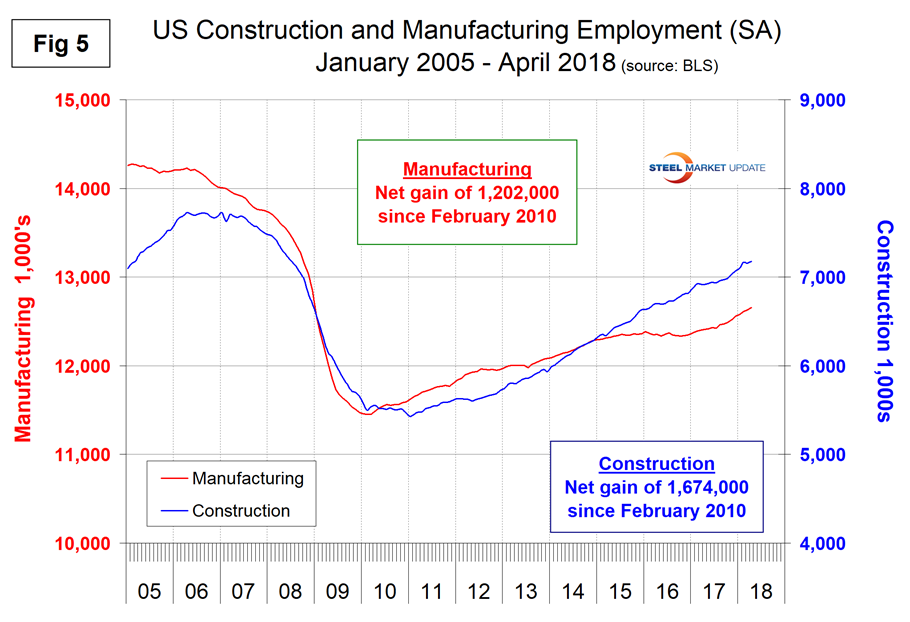
Construction was reported to have gained 17,000 jobs in April after a 10,000 loss in March. Year to date, construction has added 102,000 jobs. Construction has added 1,674,000 jobs and manufacturing 1,202,000 since the recessionary employment low point in February 2010 (Figure 5). According to the Associated General Contractors of America (AGC), 78 percent of construction firms are reporting difficulty in finding qualified labor. The jobless rate among experienced construction workers is at a record low, and in the last two years job openings in the construction industry have neared pre-housing bubble peaks.
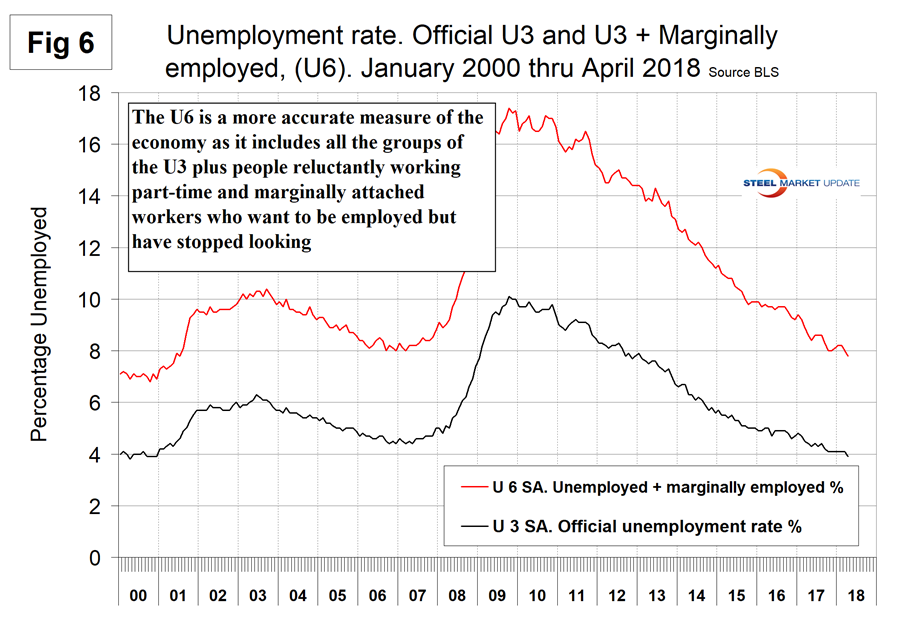
The official unemployment rate, U3, reported in the BLS Household survey (see explanation below) came in at 3.9 percent, down from 4.1 percent in every month October through March. Much was made of this in Friday’s press, but this is not a very representative number. The more comprehensive U6 unemployment rate declined from 9.2 percent in January last year to 7.8 percent in this latest report (Figure 6). U6 includes individuals working part time who desire full-time work and those who want to work but are so discouraged they have stopped looking. The differential between these rates was usually less than 4 percent before the recession, and in both March and April it was 3.9 percent.
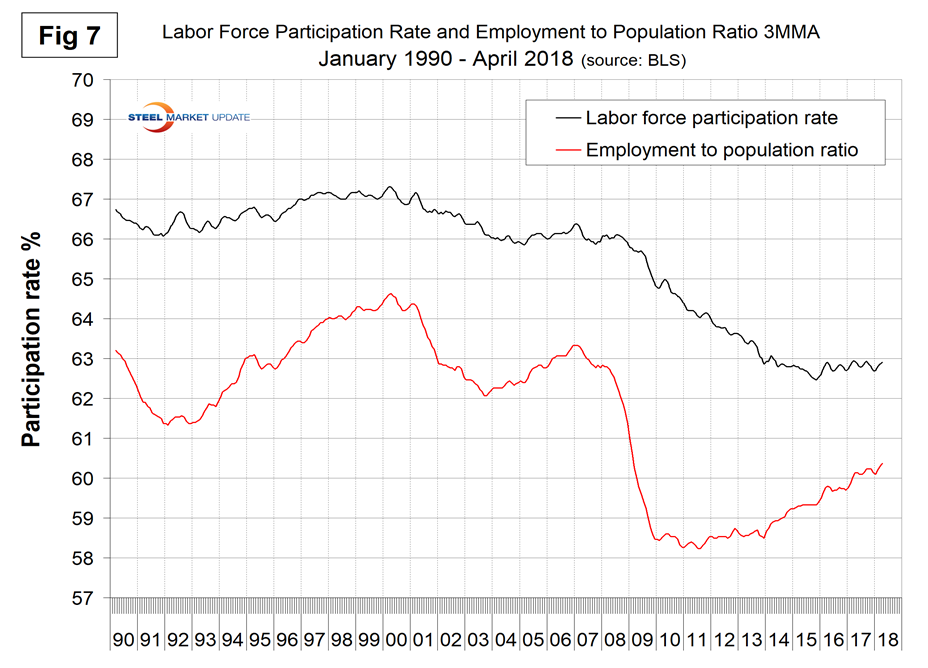
The employment participation rate is calculated by dividing the number of people actively participating in the labor force by the total number of people eligible to participate. This measure was 62.8 percent in April, up from 62.7 percent in each month October through January. Another gauge is the number employed as a percentage of the population, which we think is more definitive. In April, the employment-to-population ratio was 60.3 percent, up from 59.7 percent in the two years since April 2016. The employment-to-population ratio has made progress for the last four years, but the labor force participation rate has been stalled for two years. Figure 7 shows both measures on one graph.
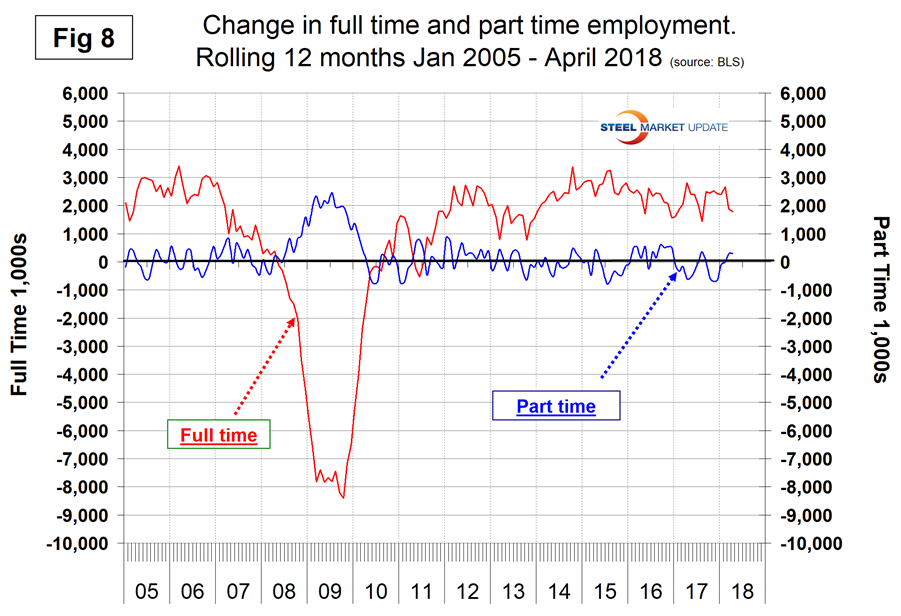
In the 40 months since and including January 2015, there has been an increase of 7,819,000 full-time and only 2,000 part-time jobs. Figure 8 shows the rolling 12-month change in both part-time and full-time employment. This data comes from the Household survey and part-time is defined as less than 35 hours per week. Because the full-time/part-time data comes from the Household survey and the headline job creation number comes from the Establishment survey, the two cannot be compared in any given month. To overcome the volatility in the part-time numbers, we must look at longer time periods than a month or even a quarter, which is why we look at a rolling 12 months for the full-time and part-time employment picture shown in Figure 8.
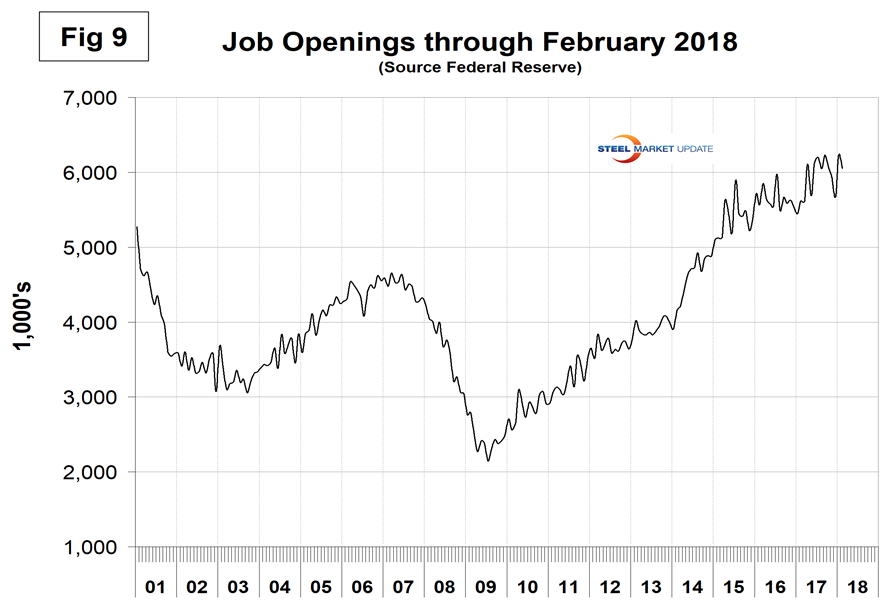
The job openings report known as JOLTS is reported on about the 10th of the month by the Federal Reserve and is over a month in arrears. Figure 9 shows the history of unfilled job openings through February when openings stood at 6,052,000, down from the January count of 6,312,000 which was an all-time high. There has been an improving trend since mid-2009.
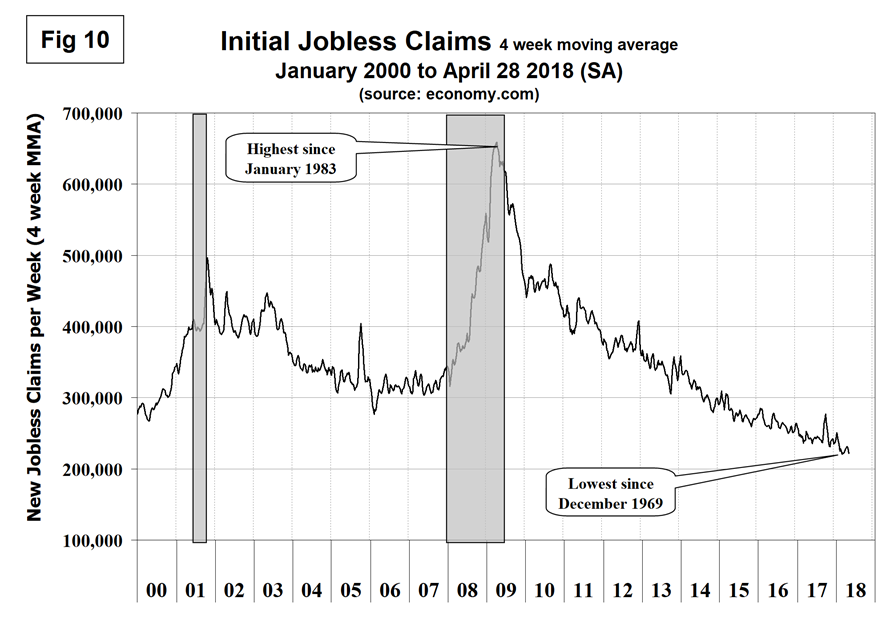
Initial claims for unemployment insurance, reported weekly by the Department of Labor, flattened in 2017 except for the hurricane-driven spike. New claims in April were at the lowest level since 1969. In the week ending April 28, initial claims were 211,000 with a four-week moving average of 221,500 claims. This is a continuation of the longest streak since 1973 of initial claims below 300,000 (Figure 10).
On Wednesday, Moody’s commented: “The job market is in good shape, but initial claims are too good to be true. After dropping to their lowest level since December 1969, new filings rose a mere 2,000 to 211,000 in the week ended April 28, noticeably better than either we or the consensus anticipated. However, given the extremely low level, we expect some payback in coming weeks—which won’t be cause for concern.”
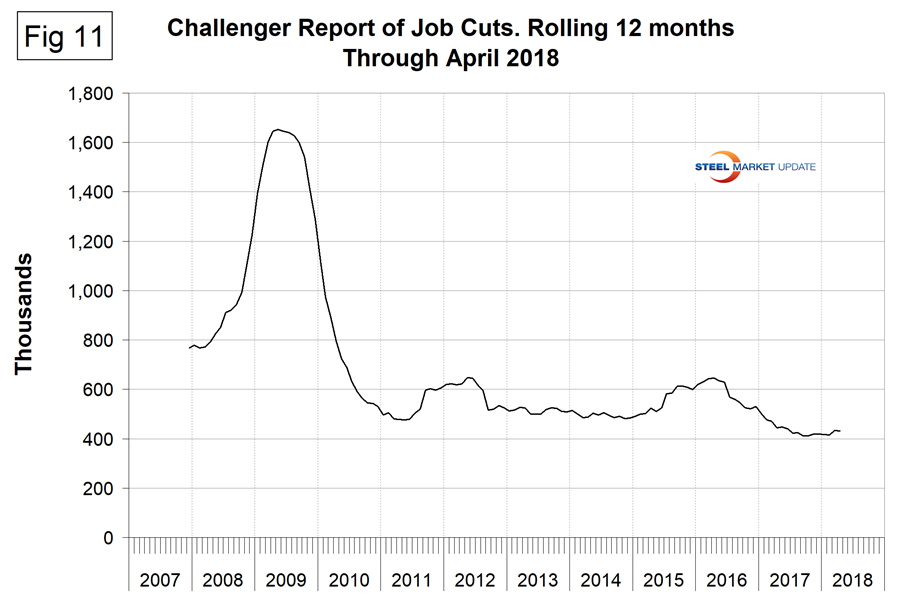
Another piece of the employment puzzle is the Challenger report, which measures monthly job cuts (Figure 11). This data also tends to be quite erratic; therefore, we again examine a rolling 12 months and can see that job cuts decreased from April 2016 through September 2017, then leveled off before ticking up slightly in 2018. Across industries, cuts were highest in retail, which announced 7,844 cuts over the month. Overall, job cut announcements are low historically as companies hold onto their workers and hiring announcements remain elevated.
SMU Comment: There were no negatives in the April jobs report. As 2018 unfolds, the employment situation is very good, job openings are near an all-time high, and new claims for unemployment are at a 44-year low. Manufacturing employment is 2.0 percent higher than this time last year and construction is up by 3.7 percent. The employment situation has been described as “full” by some analysts and unit labor costs were up in Q4 2017 and Q1 2018. Employment growth in manufacturing and construction is predictive of steel sales activity.
Explanation: On the first Friday of each month, the Bureau of Labor Statistics releases the employment data for the previous month. Data is available at www.bls.gov. The BLS reports on the results of two surveys. The Establishment survey reports the actual number employed by industry. The Household survey reports on the unemployment rate, participation rate, earnings, average workweek, the breakout into full-time and part-time workers and lots more details describing the age breakdown of the unemployed, reasons for and duration of unemployment. At Steel Market Update, we track the job creation numbers by many different categories. The BLS database is a reality check for other economic data streams such as manufacturing and construction. We include the net job creation figures for those two sectors in our “Key Indicators” report. It is easy to drill down into the BLS database to obtain employment data for many subsectors of the economy. For example, among hundreds of sub-indexes are truck transportation, auto production and primary metals production. The important point about all these data streams is in which direction they are headed. Whenever possible, we try to track three separate data sources for a given steel-related sector of the economy. We believe this gives a reasonable picture of market direction. The BLS data is one of the most important sources of fine-grained economic data that we use in our analyses. The states also collect their own employment numbers independently of the BLS. The compiled state data compares well with the federal data. Every three months, SMU examines the state data and provides a regional report, which indicates strength or weakness on a geographic basis. Reports by individual state can be produced on request.


