

Market Data

May 8, 2018
Shipments-to-Inventories Ratio Postive for Steel
Written by Peter Wright
Steel mill shipments are increasing, and the shipment-to-inventory ratio is decreasing, which is positive for the industry.
According to American Iron and Steel Institute data, total steel mill shipments increased by 13.1 percent from January 2016 through January 2018 and by 2.4 percent in January 2018 year over year. Is this believable?
This is the second writeup of an analysis we began at the beginning of 2018 in which we investigate alternative data sources for steel mill shipments. The Census Bureau provides monthly data on manufacturing inventories, shipments and new orders for total U.S. manufacturing. Also, for individual industries, one of which is steel products. Total shipments and inventories are reported in millions of dollars, seasonally adjusted. This data had a major revision in May 2017. See the end of this piece for more details.
Steel shipments and inventories are increasing as the inventory-to-shipment ratio is decreasing, which is a very healthy trend for the supply chain. To efficiently manage inventory, companies generally want to keep the ratio low. A rise in the inventory-to-shipment ratio indicates that shipments are falling, or the operation is keeping too much inventory on hand, or both.
Results for March were released on May 3. Figure 1 shows monthly shipments in millions of dollars since 1992 with the year-over-year growth. Shipments are up by 26.4 percent from March 2016 and by 13.5 percent in March year over year. They are still down by 10.8 percent from October 2014. Year-over-year growth has been in double digits since February 2017 as shown by the brown bars in Figure 1.
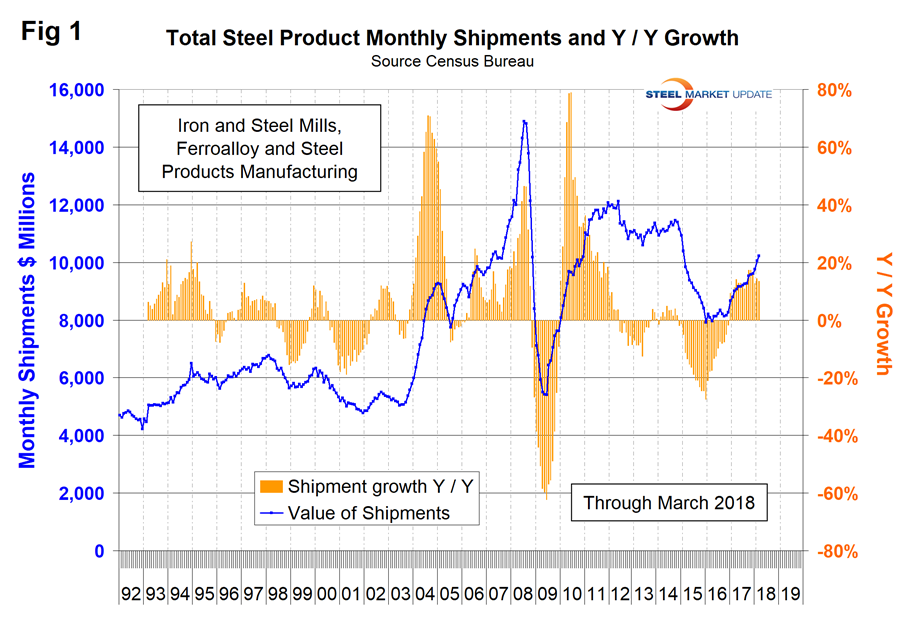
Figure 2 shows the same total shipment line as Figure 1 but now includes the inventory-to-shipment ratio. An excellent trend on both counts.
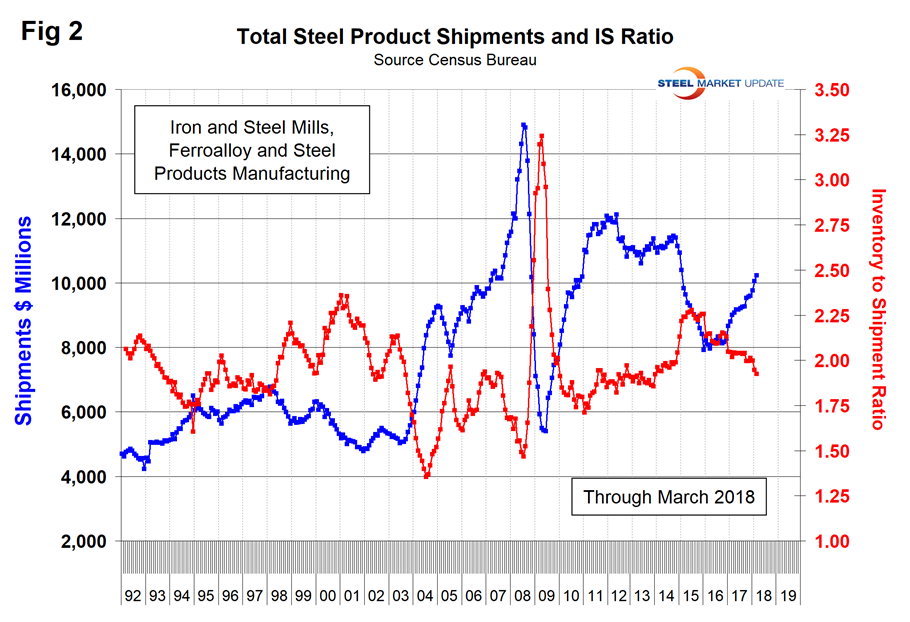
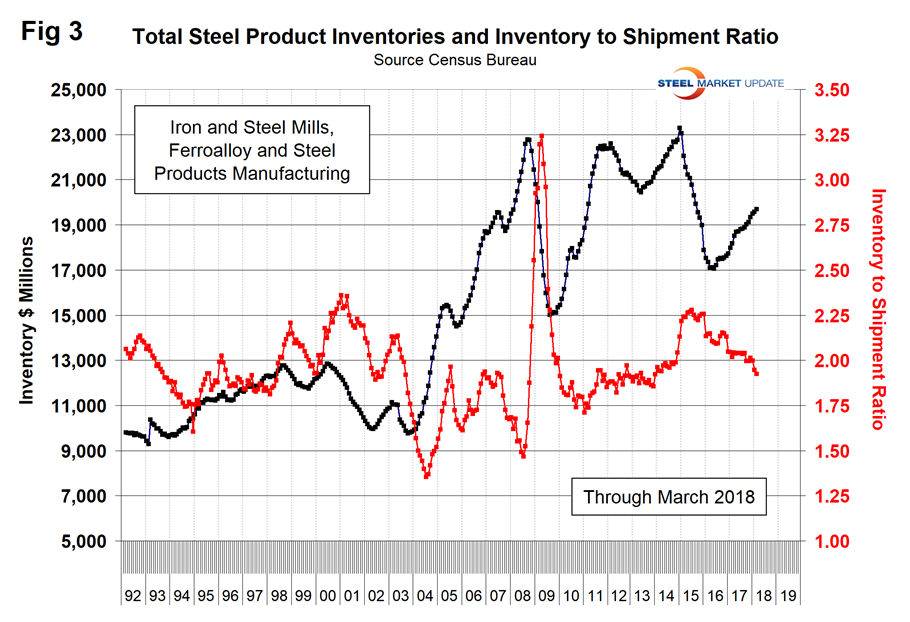
Figure 3 shows total inventory in millions of dollars and repeats the inventory-to-shipment ratio shown in Figure 2. Since July 2016, total inventories through March 2018 grew by 14.4 percent, but the inventory-to-shipment ratio declined from 2.09 to 1.92 in that time frame. The ratio is down from 2.26 in January 2016.
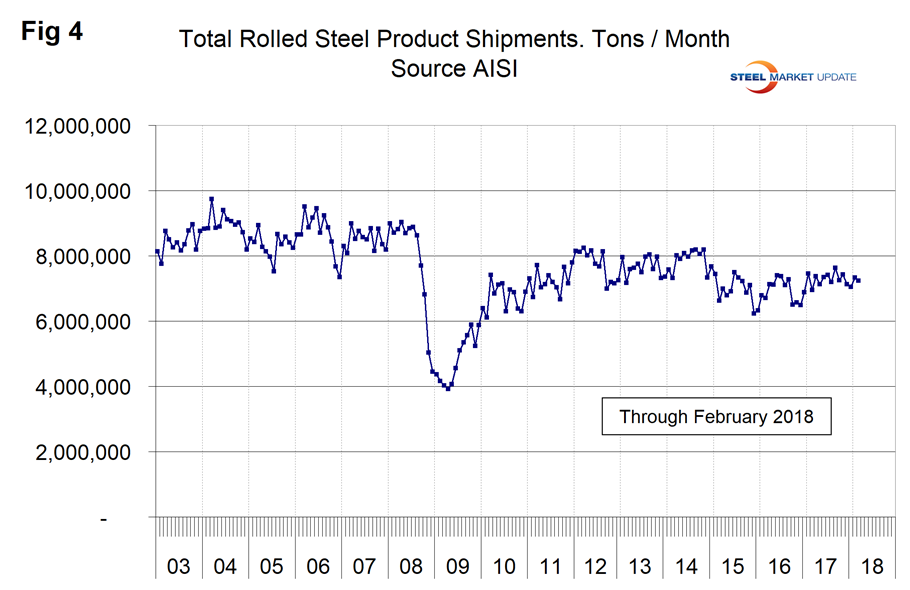
SMU Comment: We try to review several different sources of comparable data to verify our conclusions. In this case, we are comparing shipment data from the American Iron and Steel Institute and the Census Bureau, the latter having the added value of month-end inventory levels. Figure 4 shows total rolled product shipments since 2003 based on data from AISI. Comparing Figure 4 with Figures 1 and 2 is not apples to apples because one is tons and the other is revenue dollars, which brings price into the calculation. However, the Census Bureau data looks more believable. As we think more about this, we will try to get price out of the equation. At the very least, what we get out of the Census Bureau data is that the shipment-to-inventory ratio is trending nicely.
Revised historical data from the Manufacturers’ Shipments, Inventories and Orders (M3) Survey were issued on May 18, 2017. These revisions result from: benchmarking the M3 shipments and inventories data to the 2015 Annual Survey of Manufacturers (ASM) and revised 2014 ASM data on a 2012 NAICS basis; incorporating the unfilled orders-to-shipments ratios obtained from the 2015/2014 Manufacturers’ Unfilled Orders (M3UFO) Survey by applying these ratios to the respective ASM shipments data, as well as incorporating revised unfilled orders-to-shipments ratios for prior years by applying them to the respective ASM data; adjusting the new orders data to be consistent with the benchmarked shipments and unfilled orders data; correcting monthly data for late receipts, reclassifications of reported data, and revisions to previously reported data; and updating the seasonally adjusted data based on the results of benchmarking and the recent annual review of the seasonal adjustment models. These revisions spanned the seasonally adjusted data for January 2002 through March 2017 and the data not seasonally adjusted for January 2007 through March 2017. An updated press release contains revised monthly tables for January 2017 through March 2017. Please call M3 staff at (301) 763-4832 with any questions.


