

Market Data

June 22, 2018
SMU Analysis: Rig Count is Up, But Oil Price is Down
Written by Peter Wright
The price of oil topped the $70 per barrel mark last month, a level that often triggers new investment. Indeed, the rig count is up significantly from last year. But the oil price has since receded a bit.
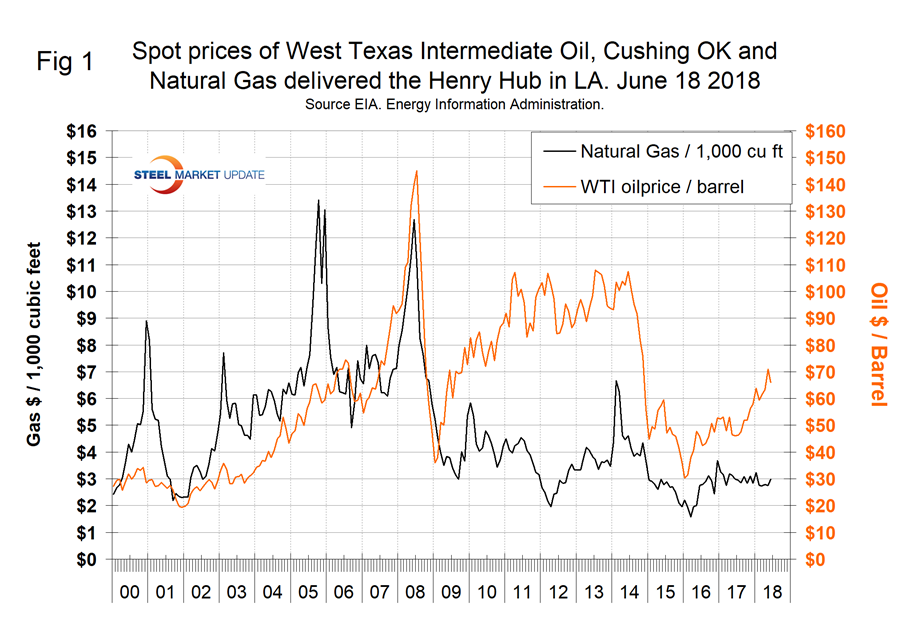
The spot price of West Texas Intermediate (WTI) broke through $70 on May 7 for the first time since Nov. 27, 2014, and stayed above that level through May 24. The price declined to $64.75 on June 6 and recovered slightly to $65.91 on June 18. The total number of operating rigs exploring for oil and gas rose by 13.5 percent year over year to reach 1,059 on June 15. The prices of oil and natural gas drive the consumption of energy-related steel products including oil country tubular goods, pipe fittings and well head equipment, among others. Welded tubular goods (not including OCTG) consumed about 5.5 million tons of hot rolled sheet in 2017.
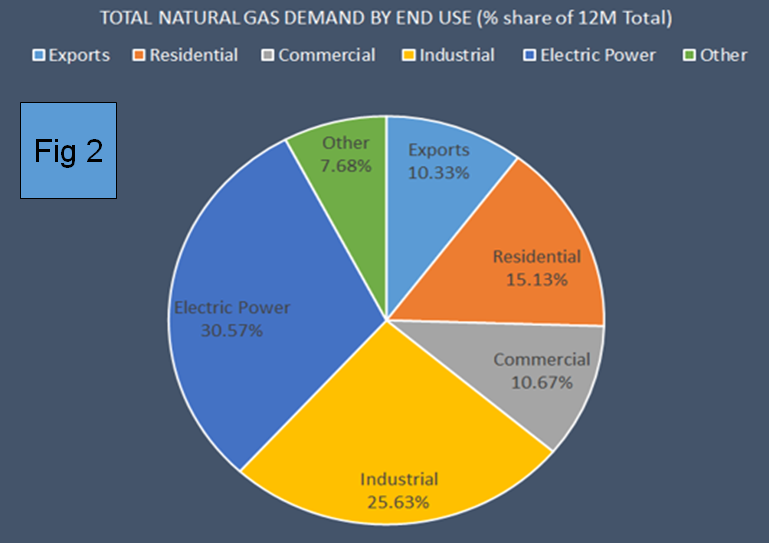
Figure 1 shows historical oil and gas prices from January 2000 through June 18, 2018. Our price and inventory data come from the Energy Information Administration (EIA). Some of the lightest and sweetest oil in the world is West Texas Intermediate. Light sweet crude oil has less sulfur than sour oils, and takes less time and is easier to refine than heavy oils. The lighter and sweeter the better. Buyers from all over the world, from South Korea to India, are purchasing American crude. Even oil-rich Venezuela uses the light sweet crude from the U.S. to blend with its gooey heavy product. The price of natural gas at the Henry Hub in Louisiana through June 15 at $2.99 was up by 24 cents since Feb.9. There was a brief spike in the price of gas early in the year when the price reached $4.28 on Jan. 5. (Note: Figure 1 shows only one result for the midpoint of each month). That was the first time for gas to break through $4.00 since November 2014. Figure 2 shows the breakdown of natural gas consumption in 2017 (source EIA). One reason natural gas is described as clean is that it emits 50 percent less CO2 when it’s burnt than does coal. But natural gas isn’t clean in the way that solar is clean. It’s cleaner than coal or oil; simply better than the worst, that’s all.
Stocks of crude oil in the U.S. haven’t changed much in 2018, but year over year are down by over 106 million barrels. Figure 3 shows the inventory level, including the strategic petroleum reserve and the year-over-year change.
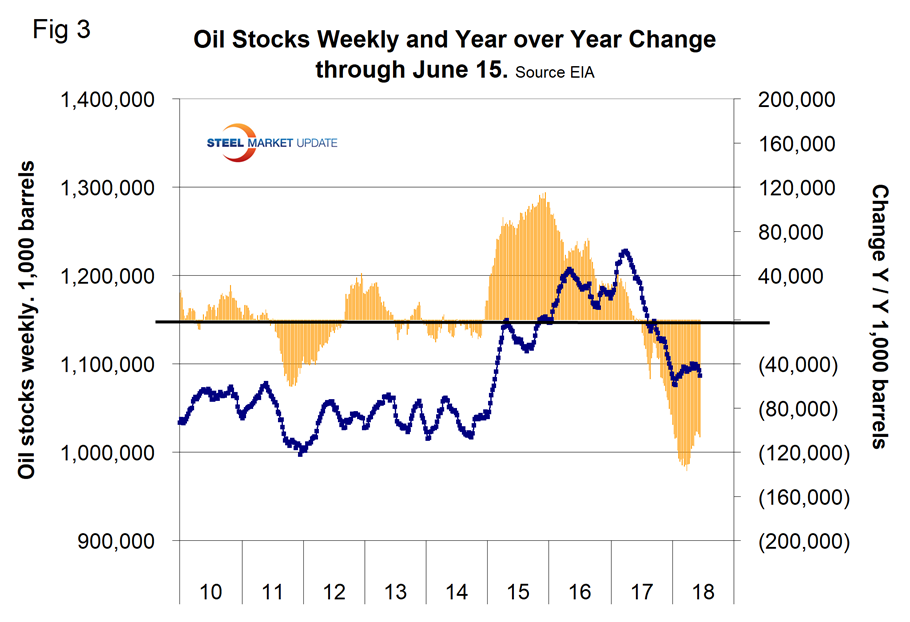
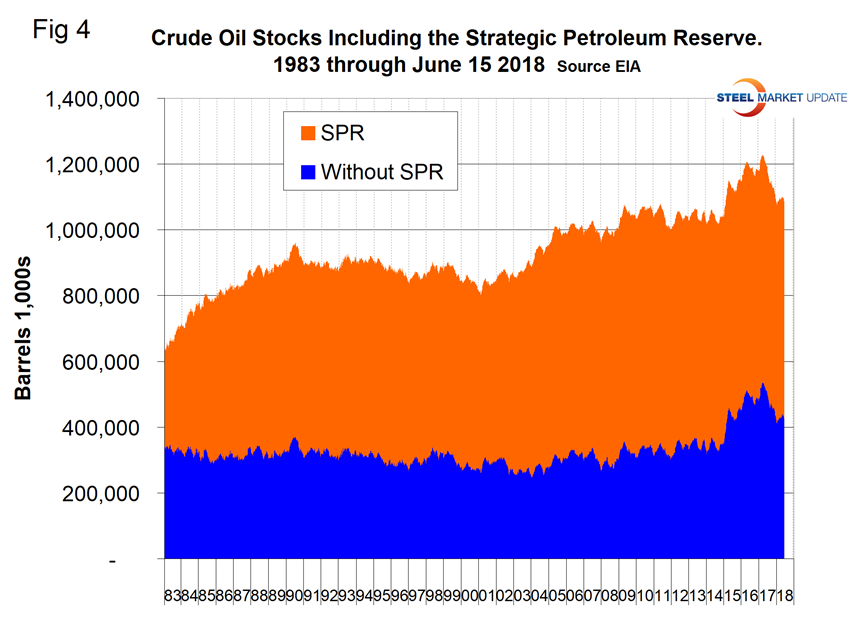
Figure 4 breaks total crude inventory into the working portion and the strategic petroleum reserve. Total inventories declined every month since June 2017, but are still historically high.
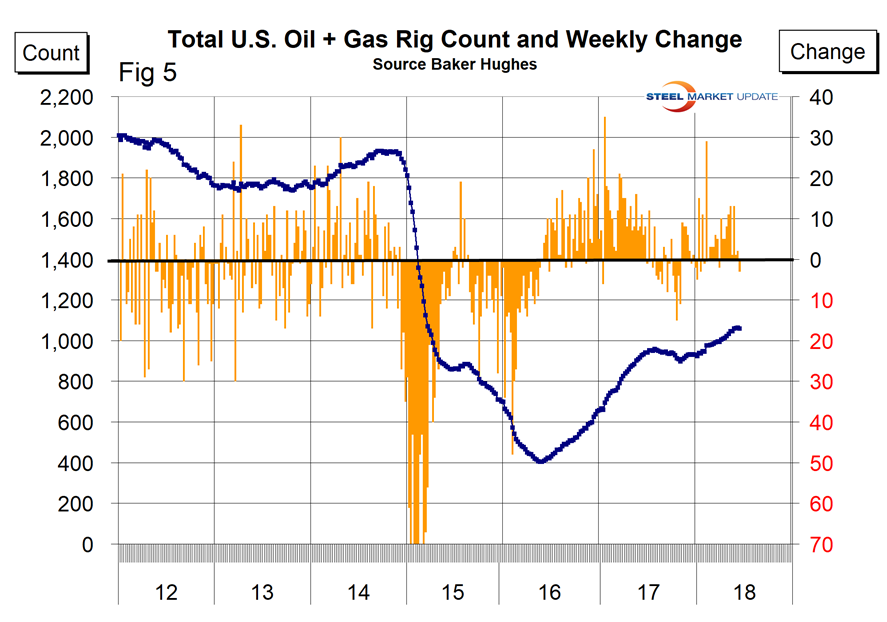
The total number of operating rigs in the U.S. on June 15 was 1,059, up from 1,046 in our last update on May 18. The count was down by 3 in the latest week of data from 1,062 on June 8, which was the highest since March 20, 2015. Figure 5 shows the total number of operating rigs in the U.S. and the weekly change.
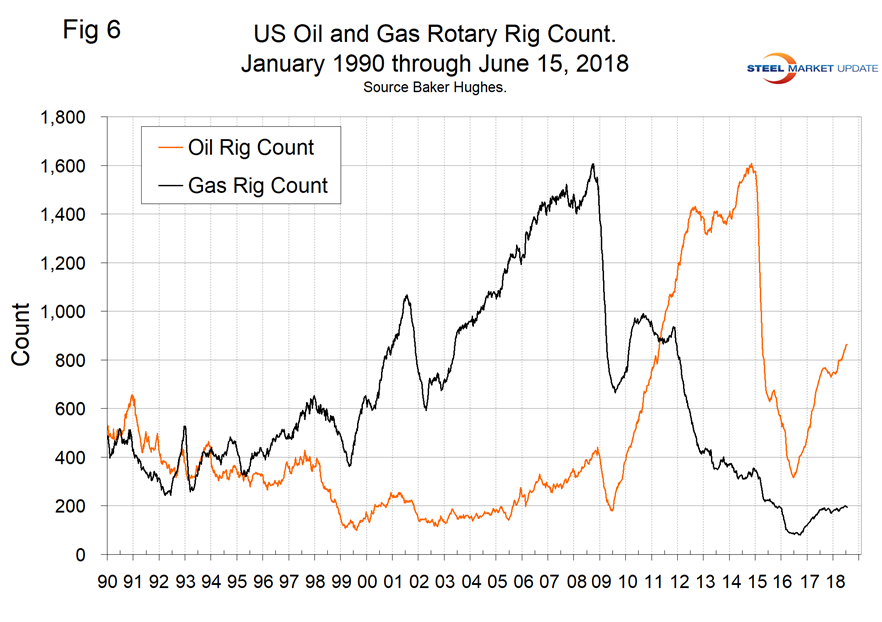
The oil rig count had a low point of 316 on June 27, 2016, and stood at 863 on June 15, 2018. The U.S. gas rig count rose from its low point of 81 on Aug. 5, 2016, to 194 on June 15. The year-over-year growth rate of total U.S. operating rigs was 13.5 percent in the latest data. Figure 6 shows the Baker Hughes U.S. Rotary Rig Counts for oil and gas equipment in the U.S. (explanation below).
On a regional basis in the U.S., the big three states for operating rigs are Texas, Oklahoma and North Dakota. Figure 7 shows the land rig count in those states since 2000 and that non-conventional drilling in North Dakota has declined by 65 percent from its heyday in late 2014. This is not as bad as it sounds because previously drilled and capped wells are being put back on stream. In fact, the North Dakota active count has increased by 10 since the beginning of March.
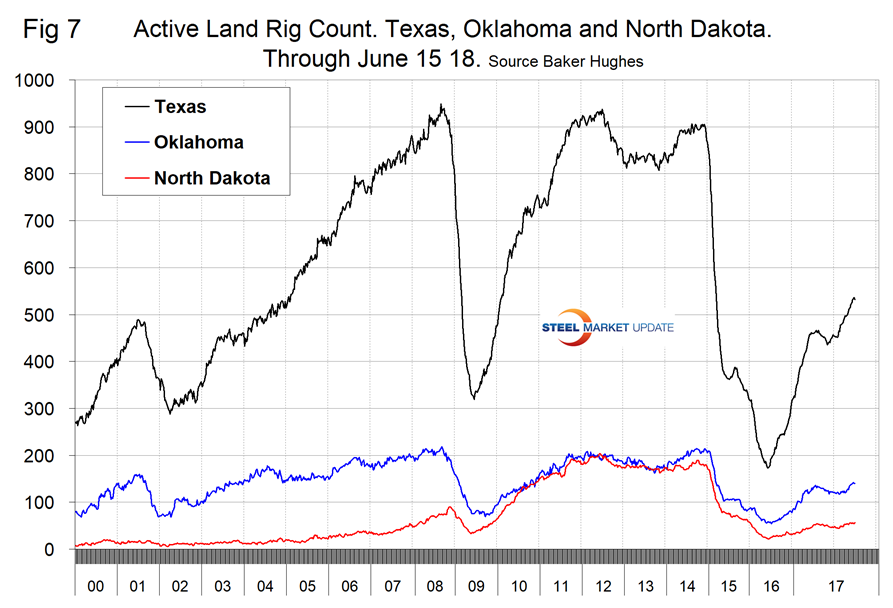
Figure 8 illustrates the monthly U.S. oilfield production of crude from January 1970 through March 2018 (latest data available) in thousands of barrels per month. The historical high was October 1970 at 310.4 million barrels. Production steadily declined to half that level in the late 2000s before the fracking revolution kicked in. December 2017 broke the old record with 310.7 million barrels produced and March set a new record at 324.7 million barrels. In our research this month, we came across a graphic from the EIA showing the production from traditional wells and hydraulically fractured wells through 2015 (Figure 9).
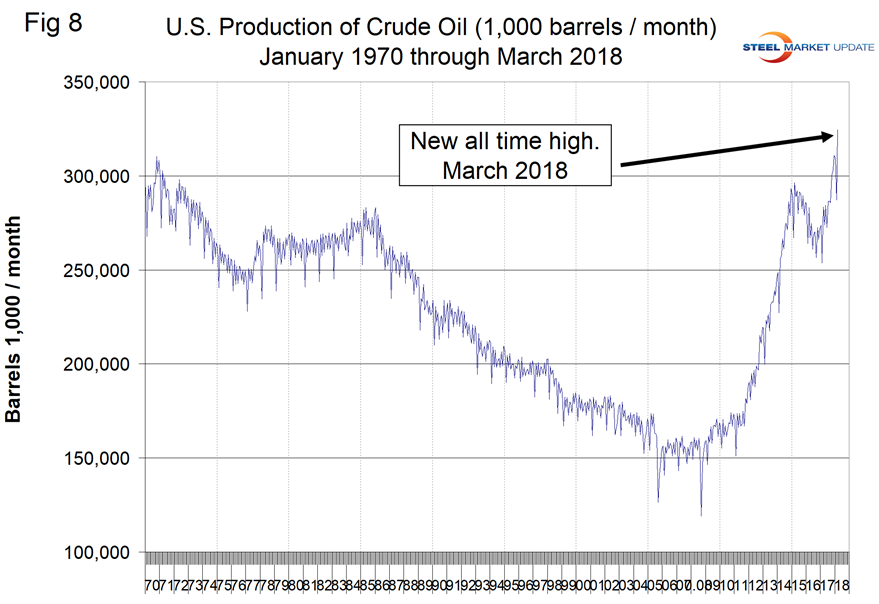
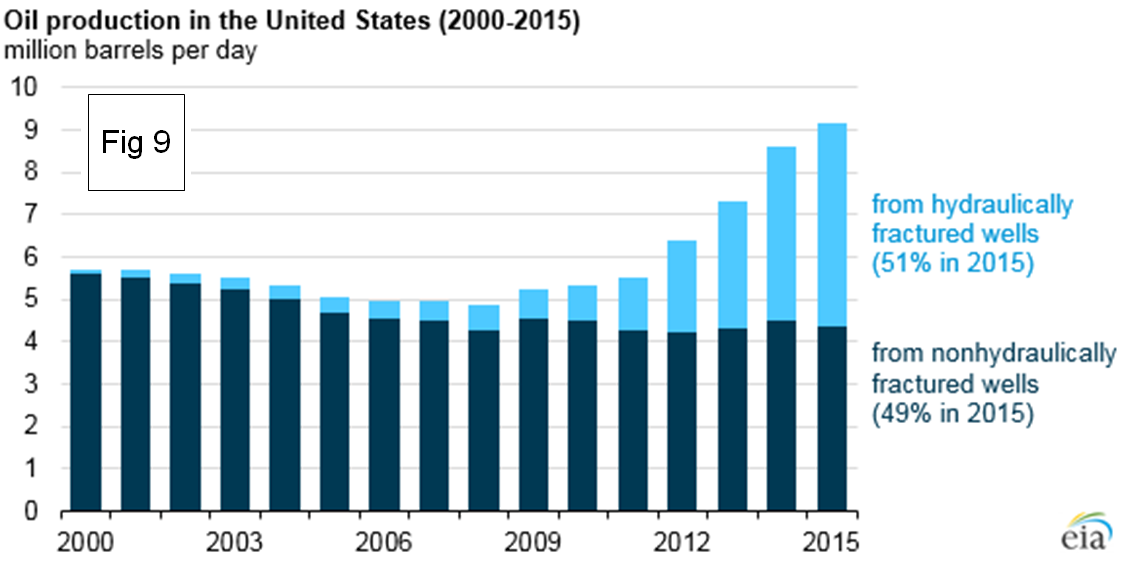
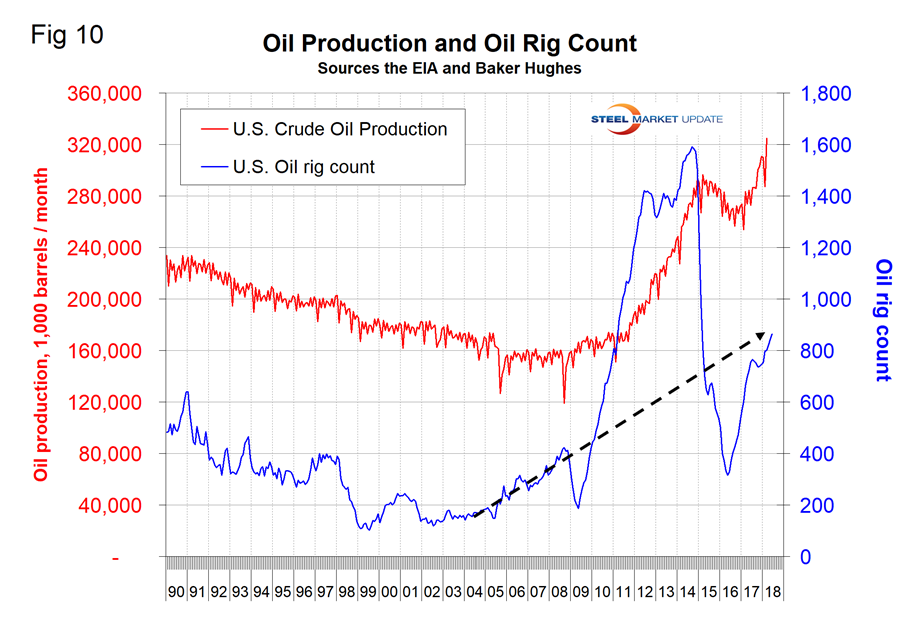
Figure 10 compares oil production and the oil rig count and shows how the increase in exploratory wells drove production from 2009 through late 2014 when the oil price collapsed. The subsequent decline in production was much less marked and is again increasing. Our take on this is that the huge increase in exploratory oil rigs beginning in 2009 may have been an anomaly and that we won’t see a repeat of the number operating in 2014 for a very long time.
Baker Hughes Rotary Rig Count: This is a weekly census of the number of drilling rigs actively exploring for or developing oil or natural gas in the United States. Rigs are considered active from the time they break ground until the time they reach their target depth and may be establishing a new well or sidetracking an existing one. The Baker Hughes Rotary Rig count includes only those rigs that are significant consumers of oilfield services and supplies.


