

Market Data
July 17, 2018
SMU Analysis: Oil Price Seeks Traction
Written by Peter Wright
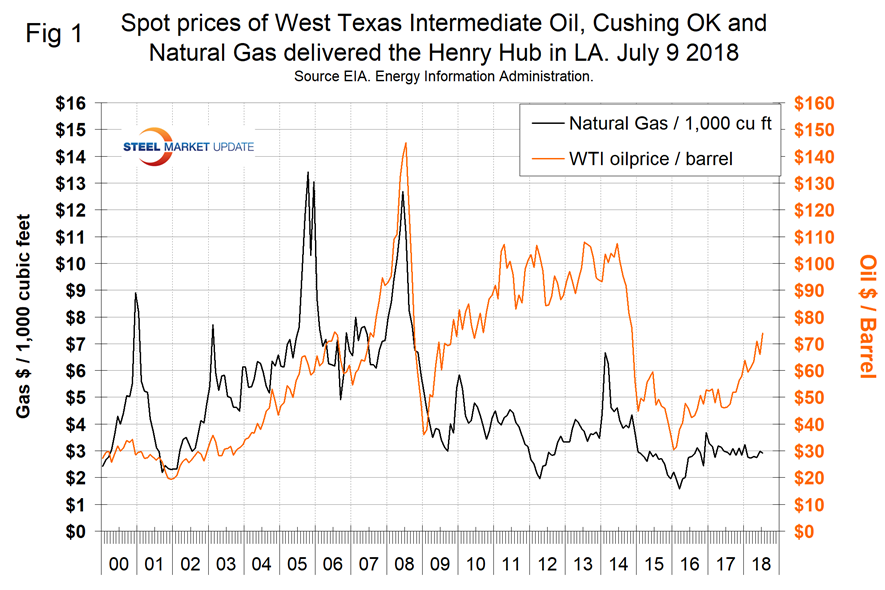
Oil prices have bounced around a bit lately, struggling to stay above the $70 per barrel mark. The spot price of West Texas Intermediate (WTI) broke through $70 on May 7 for the first time since Nov. 27, 2014, and stayed above that level through May 24 this year. The price declined to $64.75 on June 6, then once again broke through $70 on June 26, closing at $73.93 on July 13.
The prices of oil and natural gas drive the consumption of energy-related steel products including oil country tubular goods, pipe fittings and well head equipment, among others. Welded tubular goods (not including OCTG) consumed about 5.5 million tons of hot rolled sheet in 2017.
Figure 1 shows historical oil and gas prices from January 2000 through July 13, 2018. Our price and inventory data come from the Energy Information Administration (EIA). The price of natural gas at the Henry Hub in Louisiana, except for a few short-lived spikes, has made no progress in two years. Gas closed at $2.91 on July 6. The price of WTI was up by 144 percent from its recent low in January 2016.
Stocks of crude oil in the U.S. have declined by 3.0 percent since May 18 and are now lower than at any time since Jan. 23, 2015. Figure 2 shows the inventory level, including the strategic petroleum reserve and the year-over-year change.
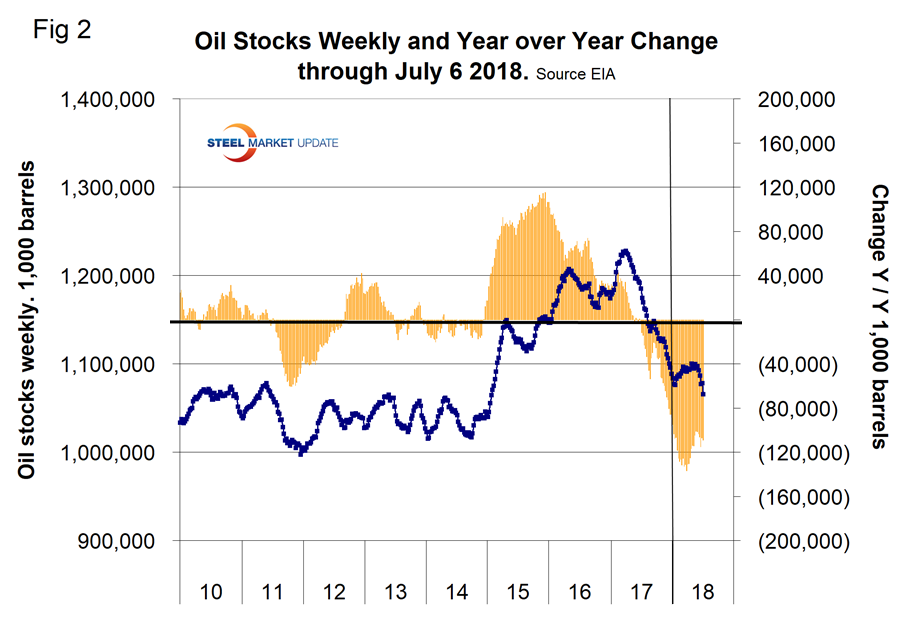
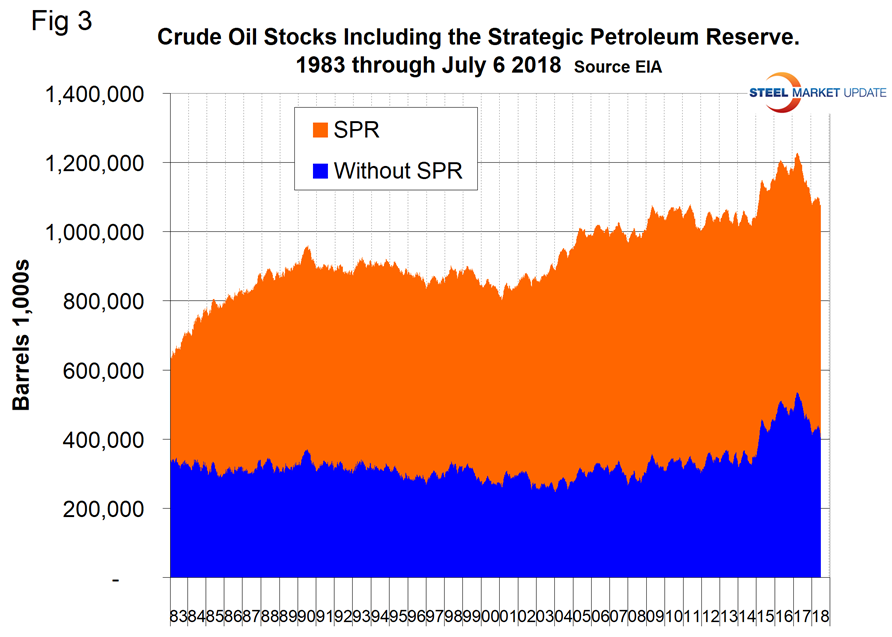
Figure 3 breaks total crude inventory into the working portion and the strategic petroleum reserve. Total inventories are down by 109 million barrels year over year.
The total number of operating rigs in the U.S. on July 13 was 1,054, down from 1,059 in our last update on June 15. Figure 4 shows the total number of operating rigs in the U.S. and the weekly change.
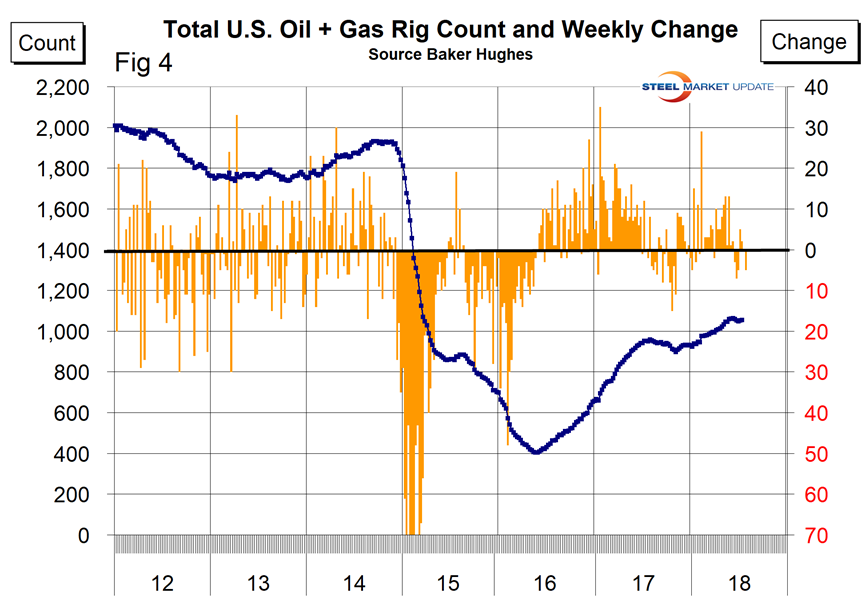
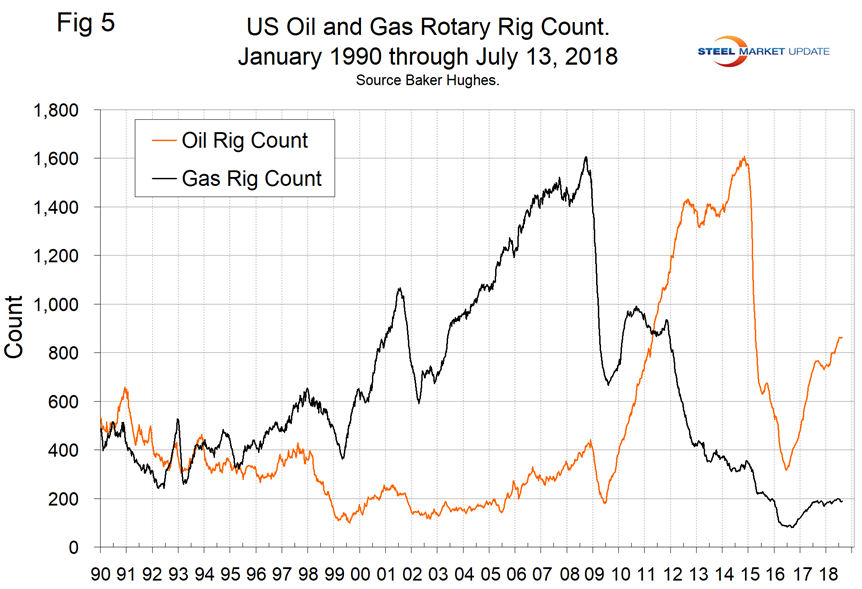
The oil rig count had a low point of 316 on June 27, 2016, and stood at 863 on July 13, 2018. The U.S. gas rig count rose from its low point of 81 on Aug. 5, 2016, to 189 on July 13. Since our last update on June 15, the oil count was unchanged and gas rigs were down by five. The year-over-year growth rate of total U.S. operating rigs was 10.7 percent in the latest data. Figure 5 shows the Baker Hughes U.S. Rotary Rig Counts for oil and gas equipment in the U.S. (explanation below).
On a regional basis in the U.S., the big three states for operating rigs are Texas, Oklahoma and North Dakota. Figure 6 shows the land rig count in those states since 2000 and that non-conventional drilling in North Dakota has declined by 65 percent from its heyday in late 2014. This is not as bad as it sounds because previously drilled and capped wells are being put back on stream. In fact, the North Dakota active count has increased by 10 since the beginning of March.
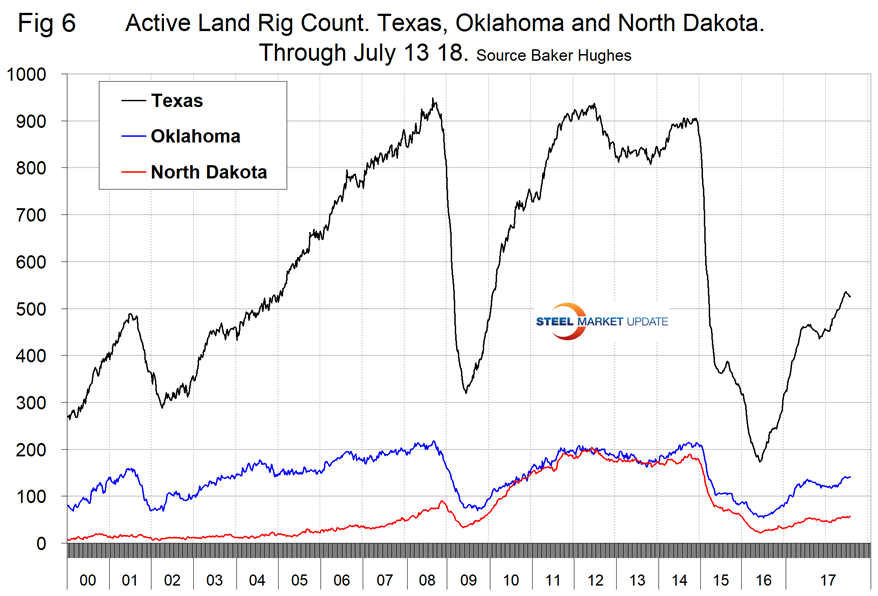
Figure 7 illustrates the monthly U.S. oilfield production of crude from January 1970 through April 2018 (latest data available) in thousands of barrels per month. The historical high was October 1970 at 310.4 million barrels. Production steadily declined to half that level in the late 2000s before the fracking revolution kicked in. December 2017 broke the old record with 310.7 million barrels produced and March set a new record at 324.7 million barrels. April declined to 314.0 million barrels.
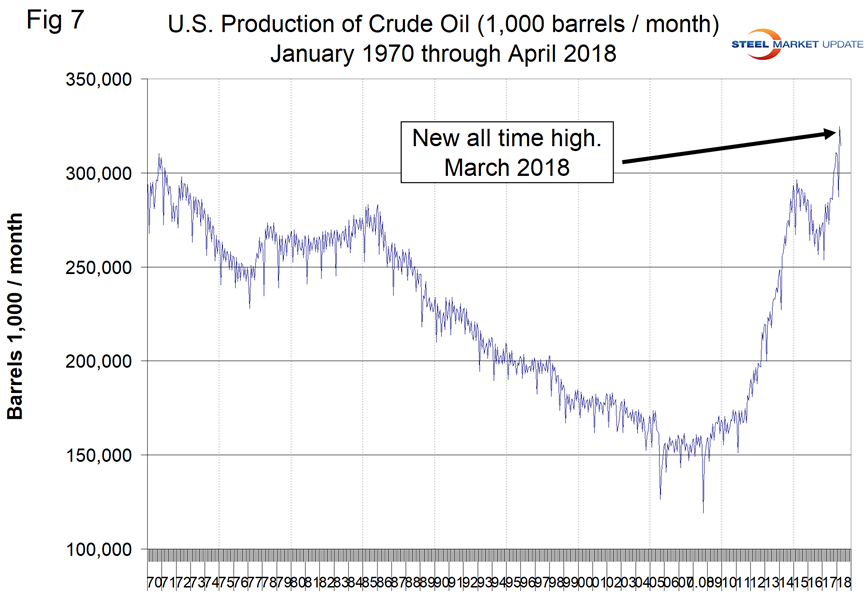
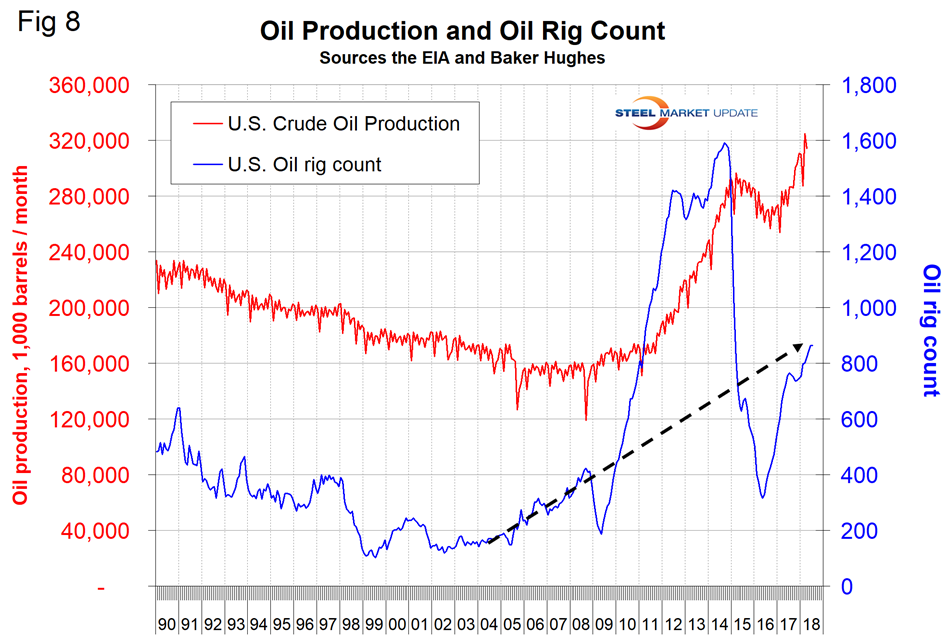
Figure 8 compares oil production and the oil rig count and shows how the increase in exploratory wells drove production from 2009 through late 2014 when the oil price collapsed. The subsequent decline in production was much less marked and is again increasing. Our take on this is that the huge increase in exploratory oil rigs beginning in 2009 may have been an anomaly and that we won’t see a repeat of the number operating in 2014 for a very long time.
Baker Hughes Rotary Rig Count: This is a weekly census of the number of drilling rigs actively exploring for or developing oil or natural gas in the United States. Rigs are considered active from the time they break ground until the time they reach their target depth and may be establishing a new well or sidetracking an existing one. The Baker Hughes Rotary Rig count includes only those rigs that are significant consumers of oilfield services and supplies.


